Dissertations The Graduate School
Spring 2016
Predictors of private school sustainability using IRS
form 990
Paul G. Leaman James Madison University
Follow this and additional works at:https://commons.lib.jmu.edu/diss201019
Part of theEducational Leadership Commons,Education Economics Commons,Elementary and Middle and Secondary Education Administration Commons, and theFinance and Financial Management Commons
This Dissertation is brought to you for free and open access by the The Graduate School at JMU Scholarly Commons. It has been accepted for inclusion in Dissertations by an authorized administrator of JMU Scholarly Commons. For more information, please [email protected].
Recommended Citation
Leaman, Paul G., "Predictors of private school sustainability using IRS form 990" (2016).Dissertations. 103.
Predictors of Private School Sustainability Using IRS Form 990 Paul G. Leaman
A research dissertation submitted to the Graduate Faculty of JAMES MADISON UNIVERSITY
In
Partial Fulfillment of the Requirements
for the degree of Doctor of Philosophy
Strategic Leadership Studies in PreK-12 Education
May 2016
FACULTY COMMITTEE: Committee Chair : Dr. Karen Ford
Committee Members/ Readers: Dr. William Ritchie
Dr. Margaret Sloan Dr. Bryan Smyth
ii
To Mary, for the hours, days, weeks, and months you have graciously given me toward this culminating project. Many “Honey do’s” have ripened and rotted as you helped me prioritize this research. Thank you for constantly encouraging and supporting me on this labor-of-learning journey. Let’s go celebrate!
iii
Acknowledgments
Few people get excited about studying IRS forms; however, my Dissertation Committee found promise and valiant ways to support my research ideas. To a truly special team dedicated to constructive thought over criticism, thank you. Dr. Ford, your leadership, encouragement, and counsel toward finding a strong committee was
invaluable. Dr. Sloan, from day one, your enthusiasm for a 990 project with relevance for private school leaders gave me a “can do” spirit. Dr. Ritchie and Dr. Smyth, your depth of understanding statistical procedures, finance, and meaningful metrics for private education helped redesign my methods in life-giving ways. I am deeply grateful for your hours of reading, thinking, consulting, and help in refining my processes and this product.
iv
Table of Contents
Table of Contents ... iv
List of Tables ... vii
List of Figures ... viii
Abstract ... ix
I. Introduction ... 1
Trends in Private Education ...1
Why Sustainability? ...4
Definition of Terms...5
Adapting to Changing External Environments ...6
Complexities of Nonprofit Sustainability ...7
Financial Data Considerations ...8
Questions to Research ...9
II. Literature Review ... 13
Educational Leaders and School Finance ...13
Nonprofit Annual Funds ...17
Potential Factors of Sustainability ...21
Organizational Case Studies of Vulnerability...24
Multiple Dimensions of Nonprofit Sustainability...27
Accessing and Using Private School Financial Data ...29
Theories of Nonprofit Finance ...30
Theory on nonprofit competition. ... 30
Theory on resource dependence. ... 31
v
Theory on debt management. ... 33
Theory on organizational slack and endowments. ... 36
Theory on joint cost accounting. ... 39
Suggestions for improved reporting... 40
Financial Metrics for Private School Analysis ...41
Predicting Financial Vulnerability and Sustainability ...43
III. Methodology ... 48
Context and Summary of Research Design ...48
Independent Variable Selection ...50
Data Collection and Population Samples ...51
Data Preparation...53 Statistical Analysis ...54 Threats to Validity ...56 Internal threats. ... 57 External threats. ... 57 IV. Results... 59 Framework ...59 Group 1 ... 62 Group 2 ... 64 Group 3 ... 66 Group 4 ... 68 Group 5 ... 69
V. Conclusions and Recommendations ... 72
vi
Discoveries Supporting Theory ...72
Group 1 Conclusions... 74 Group 2 Conclusions... 76 Group 3 Conclusions... 78 Group 4 Conclusions... 79 Group 5 Conclusions... 82 Concluding Comments... 84 VI. Appendices ... 86 Appendix A—Figures ...86 Appendix B—Tables ...96
Appendix C—Composite Score Templates, Benchmark Plots, Sample Analyses ...105
Group 1 Composite Score & Benchmark Plot ... 105
Group 2 Composite Score & Benchmark Plot ... 107
Group 3 Composite Score & Benchmark Plot ... 109
Group 4 Composite Score & Benchmark Plot ... 111
Group 5 Composite Score & Benchmark Plot ... 113
Appendix D—Normality Test Examples for Group 1 ...115
vii List of Tables
Table 1: School Group Population Sizes ... 59
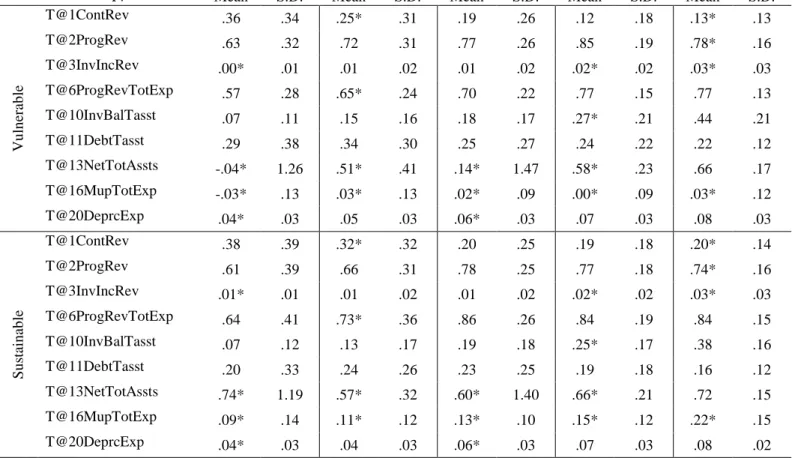
Table 2: Group Means and Standard Deviations ... 61
Table 3: Vulnerable and Sustainable Equality of Group Means ... 62
Table 4: Group 1 Statistics Summary ... 63
Table 5: DV Benchmarks by School Group ... 64
Table 6: Group 2 Statistics Summary ... 65
Table 7: Group 3 Statistics Summary ... 67
Table 8: Group 4 Statistics Summary ... 68
Table 9: Group 5 Statistics Summary ... 70
Table 10: Finance Factors from Literature Review ... 96
Table 11: Resource Sufficiency Ratios ... 97
Table 12: Mission Resource Ratios... 98
Table 13: Stability Markers (ISM, 2011) ... 99
Table 14: KPMG (1999) Ratio Translation ... 100
Table 15: Common-Sized Predictor Variables ... 101
Table 16: Survey Summary—Factors of Private School Financial Strength ... 102
Table 17: School Group Population Sizes ... 103
viii List of Figures
Figure 1: Factors of Sustainability ... 5
Figure 2: IRS Form 990-Part I and II ... 86
Figure 3: Form990—Basic Info ... 89
Figure 4: Form 990 Core Part IV—Checklist of Required Schedules ... 89
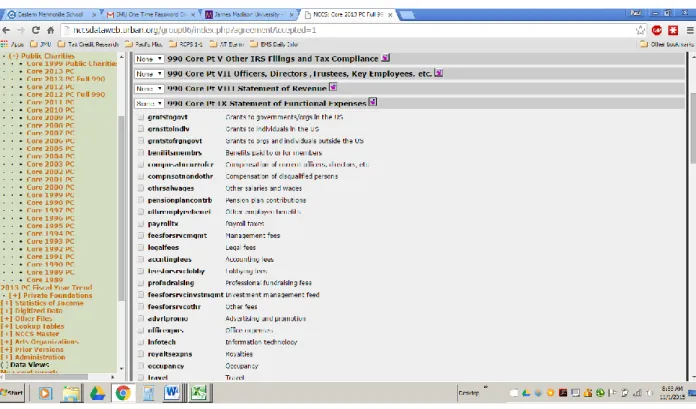
Figure 5: Form 990 Core Part IX—Statement of Functional Expenses ... 90
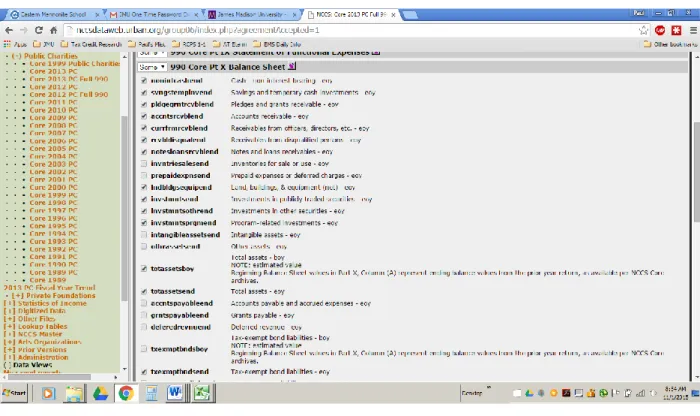
Figure 6: Form 990 Core Part X—Balance Sheet ... 91
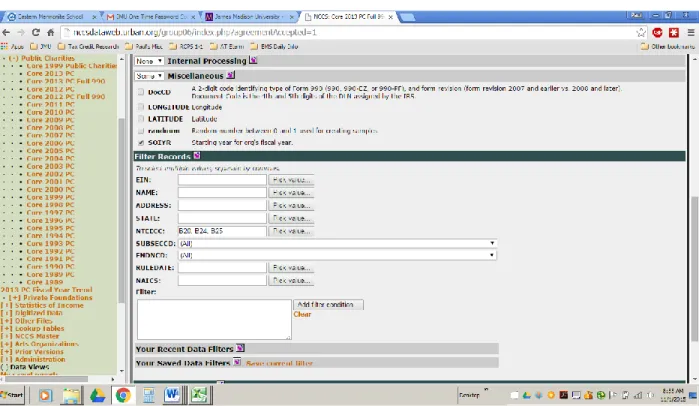
Figure 7: Form 990—Miscellaneous ... 92
ix Abstract
Private school leaders face financial sustainability challenges as competition for students and money increases. This study aims to identify financial metrics which school leaders can use for monitoring and guiding their school’s financial health. IRS Form 990 provided the financial data for calculating predictors of interest. The study evaluated data from 2009–2013 for five groupings of schools, as measured by operational size. The study included 1029 private schools after removing outliers and cases with missing data. Private school leaders helped define the dependent variable as the ratio of total
revenue/total expense. Sustainable schools carried an averaged five-year ratio of greater than one and the vulnerable school ratio averaged less than one. A standard multiple regression modeled significant predictors from a pool of nine independent variables. The Mark Up variable consistently explained most of the unique variance between vulnerable and sustainable schools in every school group. The research developed a composite score model with benchmarks for school leaders to assess their school’s financial sustainability. The study also raised questions for subsequent research on private school financial
I. Introduction Trends in Private Education
Private education is rooted in the conceptualization of early America, whereby the precept of individual rights and freedoms fostered the nonprofit sector. Private religious schooling was the forerunner of education in early America. Ornstein and Levine (1984, p. 159–160) classify the evolution of American education into the eras of “Permissive” (1640s–1820s), “Encouraging” (1820s–1850s), “Compulsory” (1850s–1980s), and “Freedom or School Choice” (1980s–present). During the Permissive Era, parents were given latitude for helping their children become literate for religious and law-abiding purposes. Private academies grew in number and with varied purposes. Benjamin Franklin founded a private secondary school in 1749 with a practical curricular bent. Public education began taking root during the Encouraging Era when Massachusetts passed a law requiring towns to form school committees and other states began following suit (Ornstein & Levine, 1984). Coulson (1999) reports that Horace Mann, Secretary of Massachusetts’s Board of Education, advocated for employing the Protestant Bible to teach reading in public schools in the 1830s. By 1850 only 1 person in 10 self-identified as illiterate according to U.S. Census data. The influx of immigrants from diverse backgrounds during the 1850s compelled governments to “establish social order and mainstream vast numbers of children into a common school setting,” the public school (Coulson, 1999, p.79–80). This began the Compulsory Era, which extended for decades and resulted in a shift of educational responsibility from the parent to local, state, and federal governments.
Alexis de Tocqueville’s Democracy in America, a commissioned writing project for the French in 1835, narrates the unique governance in America. Tocqueville speaks of American immigrants as individuals who “braved the inevitable miseries of exile because they wished to ensure the victory of an idea” (Goldhammer, 2004, p. 37). He reported public education as “one of the primary interests of the state” with town-supported taxes and laws requiring children to attend school alongside respect for “divine law that showed man the way to freedom” giving way to enlightenment (Goldhammer, 2004, p. 47). He continues describing America as a place “where the law speaks so absolute a language” of rights and freedoms granted to the people and with localities given the authority to look after their own interests (Goldhammer, 2004, p. 80). Value for individual rights and the freedom to make a difference within one’s community
established an early American culture whereby nonprofits and private education benefited the people.
In the early 1920s, a few state compulsory education laws made it illegal for children to attend private schools (Coulson, 1999, p. 122). In 1925, the U.S. Supreme Court, in Pierce v. Little Sisters for the Poor, stated,
The fundamental theory of liberty upon which all governments in the Union repose excludes any general power of the State to standardize its children by forcing them to accept instruction from public teachers only. The child is not a mere creature of the State; those who nurture him and direct his destiny have the right, coupled with the high duty to recognize and prepare him for additional obligation. (U.S. Supreme Court, 1925)
Laws shifted from attendance directives to financial ones, with states prohibiting the use of public funds for private religious education.
The School Choice Era is marked by educational authority, rights, and freedoms reverting back to the parents of children. By the mid-1990s homeschooling was
permissible in all 50 states and a few states began experimenting with voucher and tax credit systems. In 2002, the federal government’s No Child Left Behind Act (NCLB) intuited a nation in educational crisis. Trends toward varied school options expanded with public charter schools, growth in homeschool populations, and more states issuing
vouchers for students trapped in failing schools and/or tax credit support for families within low-income levels (Friedman Foundation, 2015). The jury remains out on the long-term impact of the School Choice Era on private education. Programs vary by state, some seemingly becoming contagious. For example, Pennsylvania enacted an Education Improvement Tax Credit (EITC) program in 2001 with a state cap of 30 million in corporate tax credits. EITC expansion over the next 10 years grew to a total of $75 million (Reach Alliance, 2015). In 2012 The General Assembly of Virginia passed legislation for the Education Improvement Scholarships Tax Credits Program requiring the Virginia Department of Education to establish scholarship guidelines for eligible students attending accredited private schools (VDOE, 2013). Subsequently, in May 2015, the Virginia High School League announced settlement of an antitrust lawsuit permitting private school membership in the VHSL for the first time since it was established in 1913 (VHSL, 2015).
Separation of church and state, compulsory attendance, waves of immigration, high-stakes testing, vouchers, tax credit programs, and rights for league play give witness
to factors of society and the economy contributing changes toward a private school’s sustainable success or vulnerability to failure. Pluralistic societal pressures stretch education with governments calling for the standardization of learning outcomes while special interest groups appeal for value-based options. Economically, private education subsidizes the cost of public education by approximately 5.3 million K-12 students annually (NCES, 2015). Each private school’s mission speaks to its unique purpose, and enrollment trends throughout history suggest private school patterns will continue to ebb and flow in the future. External conditions help shape these patterns and affect both public and private schools in ways beyond an individual school or leader’s control. Full awareness of a school’s internal challenges alongside external influences and potential interactions on a school’s future becomes the charge of school leaders.
Why Sustainability?
As a private school leader, serving on accreditation teams provides excellent professional growth. These validation visits offer insight into one’s own school while serving like-minded institutions and the education profession. Private school
communities frequently speak of the school’s founding history, sense of school community, and strategies for strengthening the school’s mission. The efforts a
community gives toward a private school’s mission grows constituent pride with sincere interest in long-term success. Even with strong philosophical support within a school community, my observations have noted common challenges of limited resources among many private schools. At a minimum, private school leaders expect to sustain an
organization’s mission, yet at times, economic challenges leave schools and leaders feeling threatened and vulnerable. By classifying and then analyzing vulnerable and
sustainable schools, this experimental research aims to identify financial metrics which school leaders can use for monitoring and strategically improving their school’s financial health toward greater probabilities of long-term sustainability and mission fulfillment. Definition of Terms
Private schools, for the purposes of this study, are defined as privately-funded, tuition-based, 501(c)(3) corporations governed by an independent board. Nonprofit organizations, designated by 501(c)(3) status, are classified by the National Center for Charitable Statistics (NCCS) into 10 major categories. Education represents one of the major nonprofit categories, dividing further into 29 subcategory codes. This research isolates data from only elementary and secondary schools found within education’s B20, B24, and B25 subcategories (NCCS, 2015).
Merriam-Webster’s dictionary defines vulnerable as “open to attack, harm, or damage” and sustainable as “able to last or continue for a long time” (Merriam-Webster’s online dictionary, n.d.). In 1987, following global oil shortages, African droughts, deforestation, and ozone depletion, the Brundtland Commission defined
sustainable progress as “development that meets the needs of the present without compromising the ability of future generations to
meet their own needs” (United Nations, 2007, p.1). Sustainability is complex with a myriad of
definitions touching on interactions between the triple bottom-line constructs of economics, the environment, and society, see Figure 1 (Elkington, 1994; Adams, 2006; Slaper & Hall, 2011). Just as
Venn Diagram (Adams, 2006)
humanity’s survival on the planet is influenced by a multiplicity of factors, private school sustainability deserves the consideration of multiple dimensions.
The literature review will highlight a mix of factors thought to influence nonprofit sustainability and assumed to transfer to the private school sector. The primary interest of this research is the identification of financial factors useful in defining and predicting nonprofit private school vulnerability and sustainability. A summary of the financial factors discovered during the research process are found in Appendix B—Tables and serve as reference points for the reader.
Financially speaking, vulnerable and sustainable schools represent contrasting situations in relation to changes in net assets over time (Trussel, Greenlee, Brady, Colson, Goldband, & Morris, 2002) and net assets originate from net operational income. For purposes of classification, vulnerable schools demonstrate a revenue/expense ratio of less than one, indicating a loss of net operational income. Sustainable schools demonstrate a ratio of greater than one when comparing revenue/expense over an extended period of time. Through statistical analysis, this study aims to identify the financial factors which significantly contribute to financial vulnerability and sustainability before developing a predictive model school leaders can use to assess their own school’s financial health. Adapting to Changing External Environments
Organizational environments undergo constant change; therefore, a private school leader must gather the people of her constituency to reinvent and adapt to ongoing
demands for sustainability. Heifetz and Laurie (2001) urge adaptive leaders to expose employees to an organization’s difficult challenges, and rely on their collective
to build systemic cultures of continuous improvement through strategic planning and collaboration within their respective community and industry sector for long-term sustainability. Change occurs internally within and externally around organizations, requiring constant adjustments for survival. School challenges of enrollment, escalating cost of tuition, limitations of financial aid, underpaid faculty, facility modernization, and debt management are frequent topics of conversation on accreditation teams. Concerns about financial vulnerability and long-term sustainability are real for many school leaders. A prudent school leader must gain understanding of organizational complexities and financial metrics to assist her school community in following sustainable practices. Complexities of Nonprofit Sustainability
In the for-profit sector, financial measures alone gauge success (Herman & Renz, 2008). In the nonprofit sector, the barometer of success tends to be much broader.
Mission accomplishment is the goal of nonprofit organizations. In education, school leaders commonly gather constituents to revisit a school’s mission and core values, and to draft visionary statements during strategic planning and prioritization efforts. Strategic goals, objectives, and written action plans improve probabilities for sustainability and success. Positive interactions between an organization’s people, environment, and
economic capacity are believed to grow synergy and organizational success; the opposite is also true (Boley and Uysal, 2013). Private school success or failure reflects a
compilation of many factors and interactions. Researchers consistently agree that there are multiple dimensions to gauging a nonprofit’s sustainability (Harvey & Synder,1987; Kaplan & Norton, 1992, 1996; Speckbacher, 2003; Thomas, 2004; Herman & Renz, 2008; ISM, 2011). Even with many variables playing a part in a private school’s
missional success, adequate financial resources remain an essential ingredient for sustainable operations. Financial factors of sustainability have become the experimental target of this research, with the ultimate goal of defining metrics useful to school leaders for monitoring, managing, and improving the financial sustainability of their private school.
Financial Data Considerations
In addition to identifying financial factors of sustainable and vulnerable private schools, this study hopes to accurately predict a private school’s trend toward one of these ends. Predictions hold many opportunities for error from unforeseen factors.
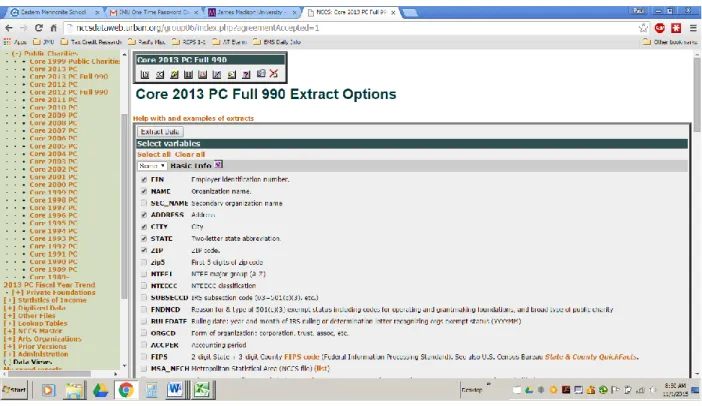
Learnings from this study do not intend to suggest causation; rather, the data studied aims to inform school leaders of financial metrics to monitor and strategically shift in order to improve a school’s financial strength and, ultimately, its mission. This study will evaluate the Internal Revenue Service’s (IRS) Form 990 as provided by the National Center for Charitable Statistics (NCCS) at the Urban Institute, a database serving the nonprofit sector. Form 990 reporting often happens through an independent accounting professional as part of an audit process that follows Generally Accepted Accounting Principles (GAAP). GAAP establishes consistent accounting standards required for publicly traded companies, and many smaller organizations choose to abide by these standards as well. GAAP has become more complex since the passage of the Sarbanes-Oxley Act (SOX) in 2002, which required boards and top management to certify the accuracy of financial information while giving more independence to third-party auditors. Accountants for many small- to mid-sized companies find GAAP becoming too unwieldy and impractical for their clients, and are choosing to follow “other comprehensive basis
of accounting” (OCBOA) practices for reporting financials (Films Media Group, 2014). Regardless of the accounting practice, employee-entered data and self-reported school financials leave room for inconsistencies between schools. NCCS data provides but a moment-in-time snapshot; therefore, financial predictions cannot guarantee future performance. Even so, school leaders with accessible, comparable, and understandable metrics discovered from the independent school sector may benefit leaders in making better financial decisions on behalf of their school community.
Questions to Research
This research aims to identify significant financial factors which distinguish between vulnerable and sustainable schools. The first task involves a literature review to help define financial categories and ratios potentially impacting net income and asset change in private schools. Various factors going into net income and asset growth may not reflect a school’s annual operational health. For example, a large bequest would likely reflect positive income and asset growth during one year even though the change in assets may have been starkly different without the gift. Alternatively, an economic
recession might decimate a school’s endowment earnings for a time, resulting in asset loss despite operating in the black. This study, using a 5-year trend analysis, identifies macroscopic factors true over time; however, it overlooks the impact of one-time events, a worthwhile topic for subsequent research.
Many factors of revenue and expense influence a private school’s net revenue any given year. This project primarily relies on Form 990 data as summed for major line item categories, because financial statements on hundreds of schools are next to impossible to obtain and practices for tracking financial details vary among schools. Factors of revenue
include program services as a measure of tuition and fees, contributions and grants to measure donor goodwill, investment income to reflect endowment earnings, and other revenue to capture rental, ticket sales, and other miscellaneous income streams. Major expense categories include salaries and benefits, fundraising expenses, and other
expenses that reflect school program costs. Analysis will also consider data from Part IX, Statement of Functional Expenses, and Part X, Balance Sheet, for asset, liability, and fund balance consideration.
School boards, finance committee members, heads of school, and business office staff should all be aware of primary indicators directly influencing income/expense and asset/liability changes for schools. Income and expense statements help inform a school’s annual tendency toward one end or another of the vulnerable-sustainable (V-S) spectrum; however, these internal reports do not provide an industry-wide perspective. Question 1 frames the discovery of financial predictors for private schools as a research interest.
Question 1.
What financial factors reliably predict a private school’s financial sustainability as measured by net income?
Many private schools rely on multiple revenue streams to augment tuition income. Tuition and fees, listed as Program Service Revenue on Form 990, are the staple revenue source for schools. In addition, many private schools have advancement departments focused on growing a school’s resources for annual operations, special projects, endowment growth, and capital development. The success of advancement efforts, in part, may differentiate financial success for a school. Many schools encourage parents and other constituents to support the school’s annual fund to bridge the gap between tuition revenue and operational expenses. Annual fund contributions are often a
significant portion of a private school’s revenue stream; however, as non-guaranteed income, this soft resource can vary significantly from year to year (Soghoian, 2012). Auditors define the difference between program services revenue and total expenses as a private school’s true annual deficit, which can be interpreted as the amount of annual contributions required to cover expenses (PBMares, 2013). Insight into revenue generation by each Form 990 category might provide school leaders recommended budgetary parameters for annual operations.
The next research question compares the relative influence of various income streams and expense categories in relation to sustainable and vulnerable practices. Knowledge of relative influence informs school leaders of strategic adjustments for continually moving a school toward improved financial health.
Question 2.
What financial factors most heavily influence a school’s sustainability as measured by its revenue/expense ratio?
Sustainable nonprofits learn to live within available financial resources (Soghoian, 2012). One challenge of private school leadership involves facility
development on top of sustainable annual operations. Financing capital projects often includes debt management, compounding the challenge of meeting operational expenses. On the accounting side of the balance sheet, new facilities become assets with the loan portion listed as a liability. Facility assets depreciate each year, resulting in fewer net assets when loan payments do not reduce liabilities more than depreciation. Post-construction financials are important for school leaders to monitor, as debt-associated asset changes may challenge a school’s sustainability. Another question of interest addresses potential concerns associated with debt.
Question 3.
What relationships exist between long-term organizational liabilities and a school’s sustainability?
School boards, leaders, and advancement professionals will benefit from knowing ranges of manageable debt before initiating projects. Banks and lenders certainly have metrics for evaluating an institution’s capacity for debt management; even so, threats to school sustainability can result from excessive capital debt. School leader access to the influences of debt on income and asset growth may help ensure wise decisions regarding a school’s capacity for capital projects. This information also provides advancement teams and school leaders a tool for communicating capital fundraising requirements prior to project approval.
Finally, do interactions exist between the factors influencing a private school’s sustainability? For example, with private school reliance on donors for both annual fund and capital expansion, how might the addition of a capital campaign alter a school’s annual revenue/expense ratio? Another relationship of interest is the impact endowments have on a school’s V-S status. The multitude of financial factors explored in this project promise a variety of interactions and rich potential for further research.
The literature review of Chapter 2 summarizes published research to date on nonprofit and private school finance. The exploration of specific financial relationships influencing private school sustainability seeks to strengthen leadership capacity for strategically minded private school leaders and to spawn new avenues for research exploration.
II. Literature Review
The introduction provided a historical summary of private education’s evolution in the United States. The proliferation of nonprofits coupled with the escalating cost of education has resulted in many independent schools facing financial challenges. Perhaps like no other time in history, private schools need business-savvy leaders capable of addressing these challenges with wisdom and creativity. Using research, Chapter 2 strengthens the case for exploring answers to the proposed introductory questions. Nonprofit finance theory builds the framework and ultimately leads the reader to data measures for collection and statistical testing. Data analysis aims to verify the financial factors significant in predicting a private school’s classification as vulnerable or
sustainable. The derived financial DV comes from a 5-year period and bases predictive modeling on the recent past to evaluate private school financial success. Knowledge gained on private school financial ratios and principles will be useful for guiding school leaders in major business decisions and sustaining their respective missions for years to come. This literature review begins with the situation in which many private school leaders find themselves based on licensure requirements for K-12 school leadership. Educational Leaders and School Finance
Business models for tax-based public education vary considerably from tuition-based private schools. Public school divisions typically employ specialized staff for financial management whereas financial leadership in private schools ultimately falls upon the lead administrator’s shoulders. School leaders in small school divisions may find themselves in unfamiliar financial waters because licensure does not require
traverses through undergraduate studies in education, teaching, coaching, activity sponsorship, and a myriad of other educational experiences accompanied by formal training required for administrative licensure. The Virginia Department of Education offers four options to secure K-12 administration and supervision licensure. Standard expectations for licensure include 3 years of successful instructional experience, a master’s degree with an educational leadership concentration from an accredited
program, a supervised internship, adequate performance on a licensure assessment, and a superintendent’s recommendation (VDOE, 2103). Accredited graduate programs in school administration require only one graduate course on school finance and business management (JMU, 2015; UVA, 2015).Graduate program requirements prioritize educational purposes and confirm limited finance training for many school leaders. The basics of budgeting and fiscal management may be learned through conferences, division training, continuing education course work, and life experiences; however, fiscal
leadership may be missing or dependent on business office staff and board members as the school’s experts. This scenario leaves many school administrators with a foggy vision for effective financial leadership. This research intends to provide the private school leader, regardless of financial background, with reliable and easy-to-learn financial benchmarks for monitoring sustainability.
Nonprofit and for-profit business models differ; even so, accounting practices follow similar financial reporting structures (Young, 2007). Familiarity with basic accounting structures builds a framework for understanding private school finance. Financial reports include the profit and loss (P & L) statement and the balance sheet. The P & L statement compares year-to-date income and expense lines with budgeted
projections and gives detailed insight into an organization’s operations. Income and expense lines are custom created by the organization for tracking transactions in areas of interest. Ultimately, accounting procedures group the customized lines for reporting to the Internal Revenue Service (IRS) on Form 990. For private schools, the IRS income categories are program services (tuition and fees), contributions (cash donations), investment income, and other revenue (rentals, ticket sales, lunches, and other
miscellaneous income) (IRS, 2012). In a similar fashion, expense lines track paid year-to-date costs. The P & L statement, when summed, projects net profit or loss on the given year’s operations. The P & L statement provides a microscopic image of an
organization’s year-to-date financial performance.
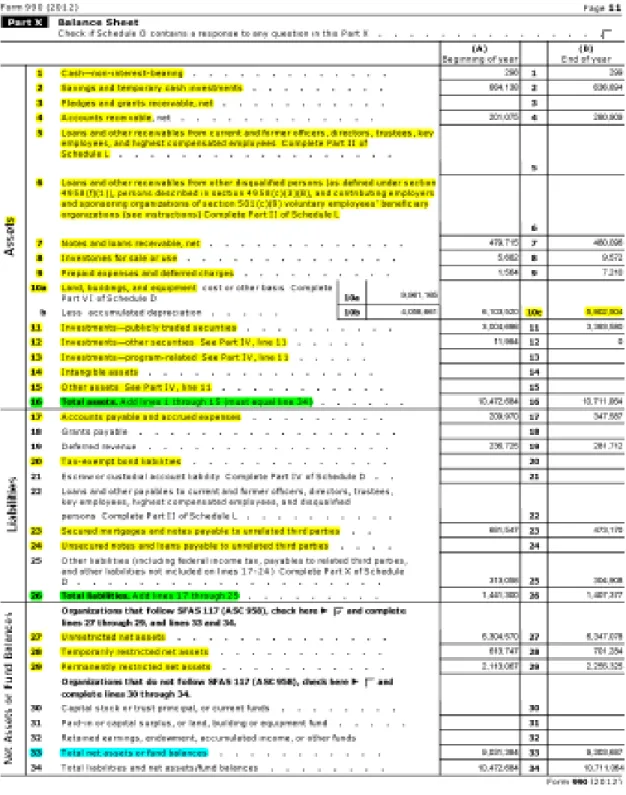
The balance sheet tracks an organization’s total assets over time. Total assets must balance, or equal, total liabilities plus total equity. Assets represent the fair market value of everything held by the organization inclusive of all cash, savings, receivables, sellable inventory, prepaid expenses, property, investments, and rights. Liabilities include payables, bond issues, loans, and obligations owed to another party (IRS, 2012). Equity, often referred to as net assets, equals the organization’s ownership of total assets. The balance sheet gives a macroscopic image of an organization’s asset allocations and helps explain currency flow in an organization. Comparison of balance sheets over 2 or more years helps identify financial changes over time (Higgins, 2012). Financial researchers study financial ratios from balance sheets, P & L statements, and tax submissions to understand the fiscal management of organizations.
Organizational leaders, be they board members or chief executives, are
financial benchmarks to analyze and question as they monitor and leverage their
organization’s financial capacity. Bowman (2011) argues that nonprofits, especially those without organizational slack provided by endowments, must pay close attention to
financial capacity and sustainability. Financial capacity refers to available cash for responding to short-term crises and measures an organization’s ability to invest when considering the long term. Bowman (2011) defines financial sustainability as available cash for emergencies in the short term and growth in assets for the long term. Available cash, measured as the revenue/expense ratio, contributes to the definition of financial sustainability used in this research.
Private schools benefit from tax exemption, a status which ensures that excess revenue help sustain the nonprofit rather than transferring to individuals as in the for-profit sector (IRS, 2015). These schools may receive tax-deductible contributions and many rely on these donations for meeting annual budgets. Nonprofit schools, unless they are church affiliated, are held accountable in the use of contributions and excess revenue by required annual submissions of Form 990 to the U.S. government. These forms are publicly available as a transparency measure for donor awareness and research purposes (IRS, 2015). Defining benchmarks from Form 990 allows school leaders to monitor their own school’s fiscal health with strategic and easy-to-track metrics in efforts toward greater financial sustainability.
Greenlee and Bukovinsky (1998) identified financial ratiosto assist auditors in analyzing nonprofit resources. They categorized five ratios measuring the adequacy of resources for operations (found in Table 11), and seven additional ratios gauging financial support for the organization’s mission (found in Table 12). Due to a broad
nonprofit sector, they recommend that nonprofits compare organizational ratios with other similar entities for meaningful analysis. Massa and Parker (2007) report on the value Dickinson College found through benchmark comparisons with other colleges. Institutions of higher education must often make tough prioritization choices when managing financial sustainability and mission. Institutional trend data alongside peer comparisons and national statistics of industry-like sectors can help enlighten best practices and assist in making difficult financial decisions (Finkler, 2011). To date, little research specific to K-12 private schools on sustainable financial parameters exists, leaving a void of relevant financial information for private K-12 school leaders. Nonprofit Annual Funds
Annual fund programs of nonprofits commonly aim to secure the operational revenue required for a given year. Sr. Generose Gervais of the Mayo Clinic’s Saint Mary’s Hospital is credited with declaring, “No money, no mission!” followed by, “No mission, no need for money!” (Lim, 2012, p. 22). These exclamations resonate with many nonprofit leaders who faithfully walk the tightrope of serving an organization’s mission on meager operating funds. While the for-profit sector measures success by financial performance, mission-driven nonprofits prioritize program services (Herman & Renz, 2008); even so, nonprofit sustainability demands access to adequate funding.
Private schools benefit from tuition revenue not available to many charities, yet many schools still rely heavily on annual contributions to meet operational expenses. While annual fund describes the financial contributions required every year to cover operational expenses, an organization’s annual deficit reflects the shortfall of program and investment income in comparison to total operational expenses (PBMares, 2013). As
demonstrated using multiple comparisons in Table 10 (1-3), realized annual deficits dissolve when contributions for an annual fund combine with other revenue sources to fulfill all operational expenses. This project assumes limitations for every school in its ability to generate an annual fund and other soft revenue; therefore, at some point a school’s annual deficit threatens its sustainability.
Cash given for annual fund programs represents voluntary income that typically comes with associated fundraising costs of human resources and materials. Each charity views fundraising differently, with some organizations developing elaborate activities to raise money while others commit very few resources to generate contributions. To provide consistency in measure, Baber, Roberts, and Visvanathan (2001) calculated total contributions minus fundraising expenses to determine residual contributions for the work of the charity.
Rooney (2007) reports 20% of nonprofit revenue coming from philanthropy. Theoretically, strategies for raising annual fund support build weak transactional-type relationships and lack inspirational purpose (Thompson, Katz, & Briechle, 2010). Annual fund strategies for nonprofits are extensive and commonly encompass mass solicitations in efforts to resource projected operational deficits and fund short-term situations. Frequent and impersonal appeals for an annual fund may feel like payment into a black hole and more obligatory than visionary. Can research help predict whether a school’s annual deficit and level of reliance on its annual fund creates a vulnerable or sustainable environment?
Sargeant, Hudson, and Wilson (2012) cite several studies correlating donor
nurture donor satisfaction. Sargeant and Shang (2012) also found that National Public Radio’s incentives for annual fund contributions correlated with donors identifying positively toward the organization. Sargeant et al. (2012) found efforts to manage and eliminate complaints effective in building organizational loyalty. Conversely,
mishandling of complaints only deepens the original dissatisfaction. Thompson et al. (2010) found supporting evidence that regular annual fund collection processes can help cultivate regular giving practices and grow the loyalty needed for significant
contributions for capital campaigns. Annual fund reliance by many nonprofits requires successful leaders to continually nurture the satisfaction of constituents.
Advancement strategies aligning donor aspirations with the institution’s vision also elevates giving to higher levels. Personalized appeals segmented around a donor’s interest have proven more successful than blanket annual giving appeals (Greenberg, 2004; Rooney, 2007; Thompson, Katz, & Briechle, 2010). Thompson et al. (2010) propose a donor-centric model for annual fundraising that begins with listening and learning donor desires. Advancement’s role then becomes creating an annualized five-year giving plan for loyal donors to ensure annual support even during a down economy. Multi-year pledges are more efficient in human resource costs and grow organizational loyalty for subsequent major campaigns. Innovative fundraising efforts are essential for growing an expanding list of donors upon which many nonprofits rely. Shortfalls in annual funds result in realized annual deficits and potential loss of assets on the balance sheet.
Richard Soghoian (2014), longtime head of Columbia Grammar and Preparatory School in Manhattan, NY, cautions against reliance on annual giving programs. He
challenges private school heads and boards to reduce dependency on annual funds and other soft income streams by learning to live within the revenue generated by the hard income of tuition and fees. His financial operating philosophy names tuition as the means for funding the present and contributions as the means for funding the future. Soghoian proceeds to contend that many independent schools subsidize operations with endowment earnings and, over time, bloat themselves with administrative overhead. People and positions are difficult to eliminate so many nonprofit schools become financially challenged when enrollment and the economy suffer. He recommends containing operational expenses within hard income as the best strategy for reducing financial vulnerability and ensuring long-term sustainability. Balanced school budgets using only hard income allow all contributions to go toward asset growth and the organization’s future. Soghoian reports donors giving more freely when knowing their contributions benefit a school’s future. The Center on Philanthropy also proclaims major gifts as the most successful fundraising technique based on survey responses measured by its Philanthropic Giving Index (Rooney, 2007). Subsequent research to confirm donor preferences in giving for long-term asset growth instead of annual fund giving might prove useful for helping school leaders structure operational business models as they relate to contributions. Table 11 (6 and 7) suggests calculations for measuring changes in net assets over time and the amount of this change attributed to contributions. The lower the ratio of contributions to net asset change, the higher the proportion of contributions converted to net assets and used for long-term gain.
Potential Factors of Sustainability
An organization’s annual loss of assets can quickly lead to financial vulnerability and a threatened mission.Knowledge of an organization’s trend toward vulnerability allows leaders to respond smartly in hopes of averting catastrophe. Greenlee and Trussel (2000) identified equity, revenue concentration, administrative costs, and operating margins as four significant factors influencing nonprofit vulnerability. Loss of net assets (equity), loss of revenue volume and diversification, and increasing percentages of administrative costs move nonprofits toward vulnerability. Operating margins compare total revenue against total expenses and measure a nonprofit’s deficit or surplus. Financial surpluses provide the means for accomplishing a nonprofit’s work while deficits sap opportunities to provide program services. Trussel et al. (2002) define financial vulnerability as an overall decline in the organization’s net assets over a period of 3 years as the primary gauge for monitoring repeated deficits.
The range of insolvency, according to Grant Thornton (2010), is observable through balance sheet and cash flow analysis. Organizational liabilities exceeding the fair market value of assets raise a flag of concern; see Table 10 (9) for the total asset to total liability ratio metric. KPMG and Prager, McCarthy, and Sealy (1999) proposed a tighter asset-to-liability ratio measured as expendable net assets divided by long-term debt with an institutional lower limit value of 1.25 assets to 1 of debt. KPMG et al. (1999) define
expendable net assets as all unrestricted and temporarily restricted net assets not connected to the physical plant since the equity in property generally cannot be sold to service liabilities. Long-term debt includes all borrowed fund obligations including lease commitments. Organizations experiencing difficulties paying bills on time also create
cause for concern. Form 990 does not show available cash; however, by comparing days in receivables with days of payables the researcher gains insight into cash flow
availability (Thornton, 2010). Table 10 (10-14) provides financial metrics useful for monitoring cash flow, available assets, and organizational equity as a proportion of total assets.
Financially threatened organizations are likely to cut services when they experience difficulty (Tuckman & Chang, 1991). Greenlee and Trussel (2000) define financially vulnerable nonprofits as those reducing program service expenses as a proportion of revenues for 3 consecutive years. A declining program service trend indicates program cuts and possible financial duress. When total functional expenses compared with total revenue is equal to or greater than one, an organization’s operating margin is zero or less, resulting in a realized annual deficit, see Table 10 (15). Corrective measures require a reduction in expenses or an increase in revenue. An organization forced to repeatedly cut program services correlates with vulnerability (Greenlee & Trussel, 2000).
Bowman (2011) proposes a short- and long-term approach for monitoring the sustainability of “ordinary” nonprofits, defined as public charities without endowments. The long-term approach aims to maintain program and evaluates the equity ratio of net assets/total assets as a measure of financial capacity, and the return on assets (ROA) as a measure of financial sustainability. The short-term objective is resilience and measures organizational capacity based on months of spending, also known as months of
operational reserve. A Mark Up ratio effectively measures short-term sustainability. Bowman (2011) defines Mark Up as shown in Equation 1. The numerator represents
available liquid cash and can be summarized as the change in unrestricted net assets plus depreciation. As a non-cash expense, depreciation is added back as available assets. The formula reflects the operating margin of nonprofits.
(1)
This study, targeting private schools, proposes an adjustment to Bowman’s Mark Up equation. Since “ordinary” nonprofits in Bowman’s study did not have endowments, this study alters the formula by subtracting investment income from the numerator. Removing investment income also acts as an equalizer for all schools and determines whether some schools rely too heavily on investment income for operations. The Mark Up numerator in this study equals total revenue plus depreciation minus investment income minus total expenses.
Edward Altman in 1968 developed a model for predicting companies in threat of bankruptcy using discriminant analysis statistical procedures. Five financial ratios served as predictors and when multiplied with corresponding coefficients and summed together equaled Altman’s Z-score. The Z-score classified companies into a safe zone, a grey zone, or a distress zone. Equation 2 illustrates the formula and respective financial ratios used for privately held companies. Altman’s Z-score affords leaders the opportunity to analyze performance around each predictor and make strategic corrections to bring about incremental improvement (Calandro, 2007). This experimental research mirrors the concept of Altman’s work by trying to discover predictors useful for assessing private school fiscal performance.
Mark Up = (Unrestricted Revenue + Net Assets Released from Restrictions + Depreciation - Total Expenses) Total Expenses - Depreciation
Organizational Case Studies of Vulnerability
Organizational experiences illustrate the importance of monitoring for
sustainability. Awareness gives nonprofit leaders opportunities to put proactive strategies in place rather than learning too late of detrimental practices. Nonprofits caught in vulnerable trends may wonder whether a series of smaller changes versus one dramatic adjustment enhances sustainability. Effective ways to change the path of vulnerable nonprofits warrants further research but is outside the scope of this project.
Hull House, founded in 1889, developed as a series of settlement houses primarily for the immigrant community of Chicago. The nonprofit grew into a successful
organization serving 60,000 clients, only to close due to bankruptcy in 2012 after 123 years of service. Clemenson and Sellers (2013) analyzed Hull House conditions using IRS Form 990 as it became financially vulnerable and ultimately insolvent. The board had a relatively high turnover rate, with 50% leaving during the course of one year. Even so, the Hull House board had a strong core with the remaining half having served at least 7 years. Board members included CEOs, attorneys, financial advisors, and other
successful professionals and business leaders with significant experience (Chicago Business, 2012). Though not considered in this study, Table 10 (8) offers a suggested formula for measuring board churn as a factor of sustainability. Hull House’s financial
Z = 6.56(X1) + 3.26(X2) + 6.72(X3) + 1.05(X4) (2) X1 = Working Capital / Total Assets
X2 = Retained Earnings / Total Assets
X3 = Earnings before Interest and Taxes / Total Assets X4 = Net Worth / Total Liabilities
vulnerability after many years of mission-effective service reminds nonprofit leaders to closely monitor financial trends, for even long-established organizations can quickly become vulnerable.
Parochial Catholic schools illustrate an educational sector of vulnerability. Catholic education served nearly 4.5 million students in over 10,000 schools in 1965 (United States Catholic Conference, 1976). Enrollments have dropped significantly for a series of complex reasons including the lack of church leadership, resistance to change, value shifts by Catholic parents, and structural shifts from dedicated nuns to greater percentages of hired teachers (McLellan, 2000). In 1950, 90% of Catholic schools’ faculty had religious affiliation with the church; however, by 2005 this percentage had dropped to around 5%. The shift of Catholic middle-class residents from cities to suburbs, with more poverty-laden people moving into cities, also magnified the loss of Catholic school identity. Many Catholic schools became unsustainable as fewer Catholic students attended, diocese support waned, and more costly local-hire faculty became the norm (James, Tichy, Collins, & Schwob, 2008). For today’s situation, private school enrollments have steadily declined since 2001, when over 6.3 million students attended private K-12 schools (NCES, 2015). Regardless of the reasons for enrollment decline, this reality assumes some schools have undergone sustainability challenges associated with changes in enrollment. Research on the impact of enrollment change on fiscal sustainability represents another relevant topic for study and begs for standardized identification numbers for ease in sharing information between data centers.
Dickinson College illustrates a reversal of finance-related vulnerability through corrective action. President Durden inherited accumulated operating deficits of over $15
million expensed out of reserves, a financial aid budget greater than 50% of tuition revenue, and an aggressive endowment spending allowance of 6%, threatening long-term endowment capacity. With tuition and fees covering only 75% of revenue, enrollment management became a top priority (Massa & Parker, 2007).
Dickinson’s turnaround demonstrated strong financial decision making based on internal trend analysis and comparative data from similar colleges. President Durden discovered Dickinson’s historical pattern of tuition discounts equaling 52% of tuition income. With the college moving toward bankruptcy, Durden’s team immediately curtailed the discounts to 37% of tuition income within one year and gradually reduced discount levels to 30% over the next 10 years. Durden’s team grew enrollment while reducing tuition discounts allowing the college to recover financially (Massa & Parker, 2007). For making the most informed financial decisions, Hubbell, Massa, and Lapovsky (2002) emphasize the importance of benchmarking against historical records, similar institutions, best in class, and national database collections. This research aims to define a few private school benchmarks useful for helping school leaders monitor financial trends.
Massa and Parker (2007) define tuition discount theory as a strategy for growing enrollment toward capacity in efforts to add revenue without expense. By making tuition more accessible, discounting helps many schools broaden diversity within their
population in efforts to be more attractive to prospective students. Understanding historical trends and comparative school data helps prevent a school from going overboard in discounting to the point that enrollments and program services become inflated but under-funded. Carefully watched and strategically implemented, discounting can strengthen a school’s financial position; however, allowing a high tuition discount in
conjunction with a low enrollment only harms an organization’s financial health (Massa & Parker, 2007).
Dickinson’s increase in hard income through tuition and reduction in annual deficit turned the college’s financial situation around. Ultimately, discounted tuition places demands on advancement teams to generate adequate support to counterbalance the deficit created by discounts. How do school leaders balance the need for optimal enrollment with aid and scholarships? Further research on the implications of annual deficits in comparison to enrollment capacity may better inform practices in discounting tuition.
Multiple Dimensions of Nonprofit Sustainability
Environmental and economic factors, described respectively as enrollment and finance factors for schools, are but two legs of the sustainability stool (Elkington, 1994; Adams, 2006; Slaper & Hall, 2011). Harvey and Snyder (1987) identify the prioritization of sociological mission as one cultural challenge for nonprofit organizations seeking to measure sustainable success. Nonprofit professionals often value their services over financial discipline and may be fearful of businesslike financial accountability.
Speckbacher (2003) reports that most nonprofits subscribe to a stakeholder management model in which clients, employees, volunteers, and contributors are valued above corporate assets. Nonprofits rely on people investing in and contributing toward an organization’s mission; therefore, stakeholders influence nonprofit success. How does a nonprofit know whether its efforts are productive in a multidimensional performance setting? Years ago, Harvey and Synder (1987) recommended establishing benchmarks by comparing with similar programs to help gauge “reasonable” guidelines. Subsequently,
Kaplan and Norton (1992, 1996) developed the Balanced Scorecard to measure nonprofit performance by reviewing financial indicators alongside nonfinancial and intangible factors such as employee skill, customer satisfaction, and innovation. Later, Kaplan and Norton (2001) proposed that nonprofit upper management teams involve major
stakeholders in identifying core values to measure as part of an organization’s Balanced Scorecard. Informed stakeholders may be in the best position to evaluate the
sustainability success of an organization’s mission (Speckbacher, 2003).
Sustainable private schools assume organizational success. Thomas (2004) writes about the importance of boards, management practices, program services, social culture, organizational adaptability, and accurate use of data as contributing factors to an
organization’s successful performance. The private school consultancy firm Independent School Management (ISM) promotes measuring a school’s operational success using two tiers of factors, referred to as stability markers. First-tier markers are prioritized,
beginning with finance-based measures relating to cash reserves, debt, and endowment. Most other first-tier factors relate to nonfinancial markers such as the presence of a strategic plan, quality of executive leadership, hard-income capacity, board member profiles, and board leadership focused on long-term viability. ISM’s second-tier markers include a dozen factors associated with things like culture, professional development, fundraising, perceptions of compensation and benefits, facilities, and enrollment demands (ISM, 2011). In summary, research emphasizes multiple dimensions to an organization’s success with finances acting as but one key player in the sustainability game (Harvey & Snyder, 1987; Herman & Renz, 2008; ISM, 2011; Kaplan & Norton, 1992, 1996, 2001; KPMG and Prager, McCarthy, & Sealy, 1999; Speckbacher, 2003; Thomas, 2004).
Accessing and Using Private School Financial Data
One factor among many, finance remains an important consideration of private school sustainability. Access to private school data can come directly from the school or from data collection centers for public research. A comprehensive information system allows for complete, accurate, and timely access for data mining purposes (Allison, Honegger, & Johnson, 2009). The National Center for Education Statistics (NCES) uses a self-report private school survey to collect education-related data such as location, racial demographics, enrollment, and staffing for researchers, school leaders, policy makers, creditors, and the public (NCES, 2015). The U.S. government also collects private school financial data as part of annual charitable reporting and asks whether separate,
independently audited financial statements were obtained for the tax year on IRS Form 990, Part IV, 12a. Audited accountability measures may add reliability to Form 990 data. A National Center for Charitable Statistics (NCCS) disclaimer states that Form 990 gives only a financial glimpse in time and that an organization’s financial statements provide a more complete picture. Even though data collection centers such as NCCS provide data from submissions directly made to the government, it should be noted that variances in reporting affect statistical results and researchers are wise to keep this context under consideration.
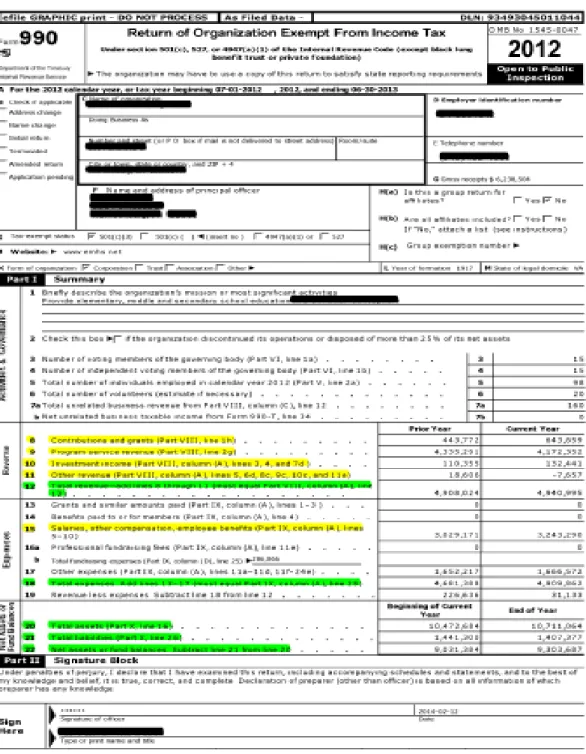
IRS Form 990 Part I summarizes topics of governance, revenue, expenses, and net assets. Total revenue on Form 990 results from the summation of eleven line items
grouped into four categories: program services, investment income, contributions and grants, and other revenue. Program services represents tuition and fee income for schools and measures enrollment-related revenue. Investment income reflects earnings from
marketable securities and bond proceeds commonly used by schools with endowments.
Contributions and grants are voluntary income fully depending on the goodwill of others. With economic conditions influencing both investment performance and donor goodwill, these revenue sources can vary significantly from year to year and serve as an unreliable “soft income” stream (Irvin, 2007; Soghoian, 2014). Other revenue reflects royalties, rentals, events, food services, ticket sales, sales of inventory, and other miscellaneous sales. A private school’s operational income must come from these four categories to support all of its programs. With many factors weighing in on nonprofit sustainability, this project probes various financial factors of income, expense, and asset management to learn patterns predicting vulnerable and sustainable school groups. At this point,
literature review of nonprofit finance theory helps the reader better understand the private school context in preparation for interpreting the results of research findings.
Theories of Nonprofit Finance
Theory on nonprofit competition.
Financial challenges are real for many nonprofit organizations. Greenlee, Randolph, and Richtermeyer (2011) report a doubling of nonprofits in the last 30 years with over 30,000 new nonprofit registrations in 2010. This proliferation of charities results in greater competition for donations and forces improved fundraising efficiencies for charitable dollars (Callen, Klein, & Tinkelman, 2003; Speckbacher, 2003).
Competition heightens vulnerability from financial shock such as an economic recession, lawsuit, or loss of a significant donor, grant, or other major revenue source (Trussel, Greenlee, Brady, Colson, Goldband, & Morris, 2002). In efforts to forewarn vulnerable organizations, Trussel et al. (2002) encouraged nonprofit monitoring of financial
indicators. They hypothesized that larger, more established nonprofits, due to a broader constituent base and longer relationships, have a competitive edge over smaller and younger counterparts. Interestingly, Trussel et al. (2002) found administrative costs, often greater in established organizations, to be inversely proportional to vulnerability because of an ability to eliminate nonessential administrative costs without cutting program services. These elements of competition support exploring organizational age, size of constituent base, and administrative costs as factors on the vulnerability-sustainability spectrum.
Theory on resource dependence.
Resource dependency theory (RDT) explains an organization’s survival as dependent on its ability to find and sustain adequate resources within an environment where organizations compete for resources while seeking distinctive autonomy from one another (Pfeffer & Salanick, 1978). A key factor of RDT is the CEO and board’s strategic leadership in organizational management and external resource procurement. Hodge and Piccolo (2005) report individual and corporate contributions, public grants, and payments from fees, sales, and services as the primary revenue streams for nonprofits. Strong private fundraising programs improve survival rates for nonprofits (Hodge & Piccolo, 2005). RDT suggests each income stream becomes a potential source of dependency on another entity (Brooks, 2000) and implies that revenue diversity improves financial security. Donation uncertainty leaves nonprofits vulnerable to major revenue crises; therefore, strategic CEOs engage board members in strategic planning and fundraising activities. Tuckman and Chang (1992) developed the Financial Vulnerability Index (FVI) as a measure of efficiency in resource management. Trussel, Greenlee, and Brady (2002)
used the FVI to measure a charity’s ability to sustain its mission amidst times of financial shock. On average, commercial and government-funded organizations are more
financially at risk than privately funded nonprofits because of overreliance on one public revenue source. Conversely, private organizations benefit from broad networks and shared ownership in the charity. Congruent with RDT, Trussel et al. (2002) found that the more streams of revenue supporting a nonprofit, the more resilient it tends to be during times of crisis. Does variance exist between V-S schools on different types of income?
Theories on income diversification.
Several theories support nonprofit diversification of income. From a political science perspective, nonprofit “legitimacy” broadens constituent interest, options for support, goodwill, and mission impact within the community (Chang & Tuckman, 1994; Kearns, 2007, p. 299). Outside funders such as foundations and grant producers are another theorized source of diversified income, enticing nonprofits to fulfill
grant-determined goals in exchange for funding support (Froelich, 1999). Chang and Tuckman (1994), based on nonprofit contingency theory, report that an organization’s mission influences income diversity. For example, a private school’s narrowly-defined mission to meet individual student needs results in reliance on tuition as the primary income source. In contrast, community-based nonprofits are more apt to receive income from fees, fundraising, grants, corporate partnerships, sponsors, and perhaps ancillary services. Nonprofit income strategies vary to reflect differences found within the nonprofit sector. Matching an organization’s revenue sources to its values, mission, and vision as
Nonprofit behavioral theory, historically and ideologically, suggests altruistic service as resistant to charging fees and netting financial profit; however, changes in operational behavior are happening over time (Young, 2013). James and Young (2007) report on the explosion of fee income among nonprofits between 1977 and 1997, with fees growing in the social services sector by 587%. Today, many nonprofits strategize to generate revenue within profitable services in order to help finance other mission-critical services. The expansion of fees and commercial ventures to strengthen nonprofit
sustainability and financial positions helps validate the notion that multiple revenue streams are advantageous.
Other revenue, listed on Form 990, encompasses royalties, rents, fundraising events, game activities, sales of inventory, plus other miscellaneous income streams such as catering or banquet services. Many schools look to expand alternative sources of revenue through enterprising activities, fund-raisers, and affiliated school groups such as athletic boosters and parent-teacher organizations. Ancillary revenue streams can
jeopardize a school’s sustainability when those contributions diminish (Allison et al., 2009). The Statement of Revenue on IRS Form 990 Part VIII provides multiple lines for listing sources of other revenue. The total revenue gets reported on Part I, Line 12. In response to the mixed findings of Trussel et al. (2002) and Allison et al. (2009), other revenue is not expected to be a significant factor for determining a private school’s placement on the V-S spectrum.
Theory on debt management.
Debt allows the consumption and benefit of a good before making payment. Organizations frequently borrow when cash flow cannot support the cost of program
initiatives and/or capital needs. The “pecking order” theory suggests organizations base loan decisions on their particular situation. For example, if a predicted return on
investment (ROI) is greater than interest on a loan, the organization will likely borrow rather than liquidating investments. A second theory of debt relates to tax deduction benefits associated with interest costs counting as a business expense (Yetman, 2007, p. 253). These two theories are irrelevant for many nonprofits. First, nonprofits without investments or reserves do not have cash options; secondly, nonprofit organizations are already tax exempt. Yetman (2007) reports that over 60% of nonprofits carry
organizational debt with an average debt-to-asset ratio of 33%.
What can we learn from observations associated with debt? Schmidt (2014) highlights three factors banks review when considering commercial loans. Net operating income (NOI) estimates the cash flow available for making loan payments. Debt service coverage compares available cash for payments, measured as NOI, with the cost of interest and principal payments for servicing the debt. Loan-to-value ratio describes the value of a loan as a percentage of the total property’s value. Banks vary and adjust the specifics of these ratios to accomplish the bank’s strategic goals. Nonprofit vulnerability, measured as a revenue/expense ratio of less than one, implies a negative net operating income, a negative debt service coverage, and high risk for a bank. Consistent
contribution trends in excess of operational expenses will improve a bank’s confidence for making nonprofit loans, as will a low loan-to-value ratio. Low debt ratios afford nonprofits leverage for emergency loans to weather economic storms. High debt ratios, on the other hand, risk organizational sustainability to external factors.
In efforts to keep debt low, nonprofits commonly enter capital campaigns for special projects outside of normal operations. Fundraising add-ons generally come with material and human resource costs. In addition, campaigns increase competition for charitable dollars. In theory, value is added whenever more than one dollar is raised for every dollar spent; however, as competition increases, so does the cost of fundraising which, at some point, becomes counterproductive (Rose-Ackerman, 1982). Debt considerations sometimes rise on the “pecking order” when raised funds fall short. The financial costs of debt include interest; therefore, lowest-interest options should generally take precedence.
Another cost to consider is the crowding out of future contributions. Debt assumes future constituents will have enthusiasm for paying off an already-constructed facility. Solicitations to fund yesterday’s projects commonly crowd out futuristic dreams. Different goals between the lender and the nonprofit present another potential cost to debt. The lending agency becomes a controlling partner when nonprofits assume a commercial loan. The lender can influence nonprofit behaviors in efforts to secure payment; for example, it might force the nonprofit to implement fees, put off other expenses, or sell assets. Organizations taking on debt should not overlook the legally binding partnership with a lending agency that can alter management’s operational decisions (Yetman, 2007, p. 258). Debt can increase organizational vulnerability during times of financial distress (Trussel et al., 2002). Nonprofit and private school leaders are wise to monitor organizational debt to prevent placing a valued mission in financial jeopardy.