2015
The testing effect in general chemistry: effects of
repeated testing on student performance across
different test modes
Anna Agripina Prisacari Iowa State University
Follow this and additional works at:https://lib.dr.iastate.edu/etd
Part of theCognitive Psychology Commons,Educational Assessment, Evaluation, and Research Commons, and theInstructional Media Design Commons
This Thesis is brought to you for free and open access by the Iowa State University Capstones, Theses and Dissertations at Iowa State University Digital Repository. It has been accepted for inclusion in Graduate Theses and Dissertations by an authorized administrator of Iowa State University Digital Repository. For more information, please [email protected].
Recommended Citation
Prisacari, Anna Agripina, "The testing effect in general chemistry: effects of repeated testing on student performance across different test modes" (2015).Graduate Theses and Dissertations. 14928.
by
Anna Agripina Prisacari
A thesis submitted to the graduate faculty
in partial fulfillment of the requirements for the degree of
MASTER OF SCIENCE
Major: Human Computer Interaction
Program of Study Committee: Thomas Holme, Major Professor
Joseph Burnett Stephen Gilbert
Iowa State University
Ames, Iowa
2015
DEDICATION
This work is dedicated to all who helped me reach this point in my professional
career: my beloved mother, Svetlana Prisacari, sister, Vera Prisacari, and my
grandparents, Pavel and Vera Prisacari, who consistently loved and supported me in my
life.
I also would like to dedicate this thesis to all my teachers; thank you for sharing
TABLE OF CONTENTS ... Page DEDICATION ... ii LIST OF FIGURES ... v LIST OF TABLES ... vi ACKNOWLEDGMENTS ... viii ABSTRACT ... ix CHAPTER 1. INTRODUCTION ... 1 Testing Effect ... 1 Computer-based Testing ... 3
Statement of the Research Problem ... 5
Overview of the Study ... 7
Significance of the Study ... 8
Overview of the Chapters ... 9
CHAPTER 2. LITERATURE REVIEW ... 10
Testing Effect ... 10
How and why the testing effect works ... 12
Testing effect in the classroom ... 14
Testing effect benefits ... 16
Test Mode ... 16
Test mode order effect ... 18
Types of questions ... 19
Student test mode preferences ... 21
Chemistry Question Types ... 22
Summary ... 24
CHAPTER 3. METHODS ... 26
Pilot Study ... 26
Participants ... 27
Material and design ... 27
Procedure ... 28
Results ... 29
Main Study ... 35
Participants ... 35
Materials and design ... 39
Procedure ... 44 Scoring ... 48 CHAPTER 4. RESULTS ... 49 Preparing Data ... 49 Evaluating Equivalency ... 50 Descriptive Statistics ... 52
Student testing preferences ... 53
Research Question 1: Overall Test Mode ... 56
Research Question 2: Gain by Question Type ... 60
Algorithmic gain ... 61
Conceptual gain ... 62
Definition gain ... 64
Repeated Versus Non-repeated Gains ... 66
Summary ... 67 CHAPTER 5. CONCLUSIONS ... 70 Empirical Contributions ... 70 Practical Contributions... 77 Limitations ... 79 Future Directions ... 80 Conclusion ... 81 REFERENCES ... 83
APPENDIX A. APPROVED IRB FORM ... 94
APPENDIX B. QUESTIONS FOR ALL TESTS ... 95
APPENDIX C. INSTRUCTIONS TO COMPUTER-BASED TESTS ... 124
LIST OF FIGURES
... Page
Figure 1 Smith, Nakhleh, and Bretz (2010) framework for general chemistry
questions ...23
Figure 2 Mean proportions of performance on Test 1 and Test 2 by conditions ...30
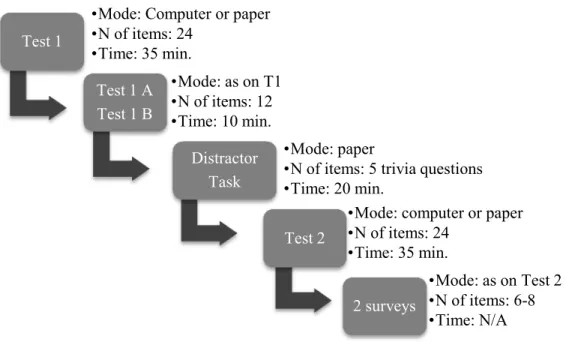
Figure 3 Diagram of the main study procedure ...47
Figure 4 The means of student responses to a question that asked the students
whether they had taken online tests for a class before ...53
Figure 5 The means of student responses to a question that asked the students about their test mode preferences ...54
Figure 6 The means of student responses to a question that asked the students why they preferred paper to online modes ...55
Figure 7 The means of student responses to a question that asked the students why they preferred online to paper test modes. ...56
Figure 8 Mean normalized gains by condition for Group I and Group II.. ...59
Figure 9 Mean normalized algorithmic gains by condition for Group I and Group II.. ..62
Figure 10 Mean normalized conceptual gains by condition for Group I and Group II.. ...63
LIST OF TABLES
... Page
Table 1 Pilot study participant information by the conditions and time of the
sessions ...28
Table 2 Frequency and percentage of participants by gender, ethnicity, year in school, and instructor and average of age and percentage received on a
final exam for each course ...36
Table 3 Number and percentage of participants by conditions for each course and percentage of participants over all courses ...37
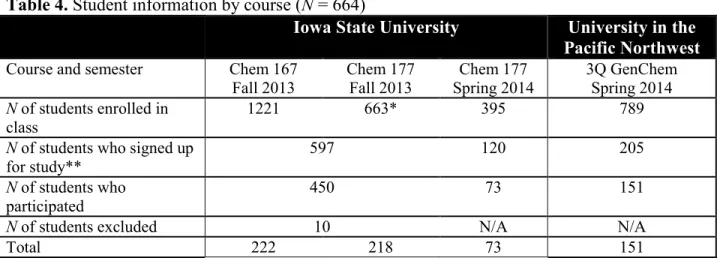
Table 4 Student information by course ...39
Table 5 Chapters and topics for each chapter from a first-semester general
chemistry course ...40
Table 6 Distribution of algorithmic, conceptual, and definition questions ...41
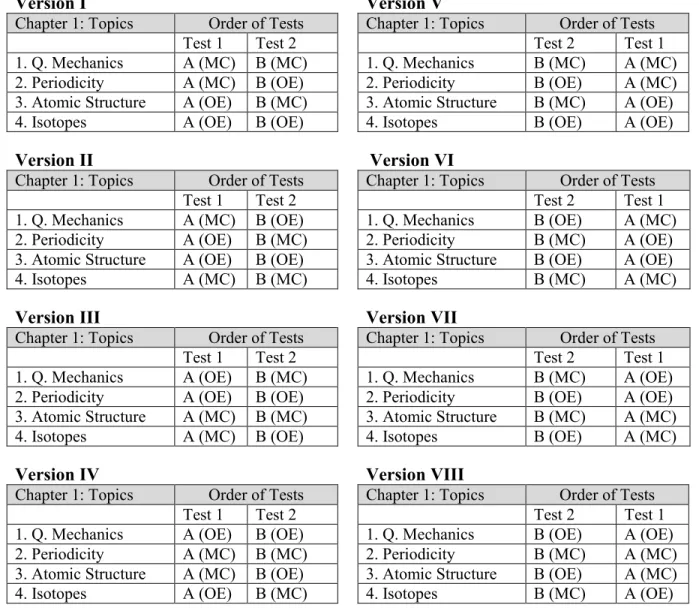
Table 7 Example of counterbalancing question formats and test order for Chapter 1 ...43
Table 8 Mean proportions of correct answers and standard deviations on Test 1 for the four courses ...51
Table 9 Post-hoc comparisons using the Tukey HSD test for the Test 1 mean
proportions for the four courses ...51
Table 10 Frequency and percentage of participants by gender for Group I and
Group II ...52
Table 11 Student distribution among four conditions for Group I and Group II for overall normalized gain analysis ...57
Table 12 Summary of Tukey’s HSD results for Group I and Group II pairwise
comparisons of normalized gain means ...59
Table 13 Sample size for Group I and Group II used for different analyses ...61
Table 14 Summary of Tukey’s HSD results for Group I and Group II pairwise
comparisons of normalized conceptual gain means. ...64
Table 15 Summary of Tukey’s HSD results for Group II pairwise comparisons of
Table 16 Means and standard deviations of mean gains by condition for Group I
ACKNOWLEDGMENTS
I would like to acknowledge and thank those who supported me during my
graduate school career. First and foremost, I would like to thank my advisor, Dr. Thomas
Holme, for introducing me to educational research. His expertise, guidance, and
enthusiasm have been invaluable. I would also like to thank my committee members, Dr.
Joseph Burnett and Dr. Stephen Gilbert for their guidance and support throughout my
graduate school journey. I appreciate all their contributions of time and ideas to this
project. I am especially grateful to Dr. Armstrong, Dr. Dark, and Dr. Carpenter for their
scholarly advise on this work and Dr. Cotos, Chris Nelson, and Dr. Huffman for sharing
their knowledge on academic writing with me.
I also would like to thank the members of the Holme’s research group at Iowa
State University for their help in designing questions for my tests, collecting data, and
scoring. Their constructive criticism and support have contributed to my professional
growth at Iowa State University. Finally, to my mother, Svetlana Prisacari, sister, Vera
ABSTRACT
Research on the testing effect shows that practice tests are more effective than
additional studying for enhancing learning. However, there has been little research
directly addressing the role of additional testing when students take paper-based or
computer-based tests in college courses. Accordingly, the purpose of this study was to
investigate the role of the testing effect and test mode on student performance.
The participants were 664 general chemistry students from two large universities
in the Midwest and the Pacific Northwest. After covering the test material in their course,
students completed two proctored practice tests that included 17 algorithmic question
pairs, 5 conceptual pairs, and 2 definition pairs. Each practice test was delivered on
computer or paper according to one of four conditions that were defined by the mode of
the initial test and the mode of the final test. These conditions were: Computer-Computer,
Computer-Paper, Paper-Computer, and Paper-Paper. After completing the initial practice
test, students repeated half of the items. Feedback was provided after each test and
performance was measured with normalized gains. After completing all of the tests,
students were asked to indicate and explain their test mode preferences for general
chemistry tests.
Four major conclusions resulted from the study. First, the testing effect was found
in all conditions, but varied in terms of the test mode. Paper-Computer showed the lowest
gains and these gains were significantly lower than those for Paper-Paper. Gains from
Computer-Paper and Paper-Paper were not significantly different from each other.
Second, the test mode did not affect the students’ performance on algorithmic questions,
from repeated items were significantly higher than the gains from non-repeated items.
However, this testing effect was not consistent across all areas of chemistry content.
Fourth, a majority of the students indicated a strong preference to take their next general
chemistry test on paper since this mode allowed them to write on the test and show their
work.
Overall, this study demonstrates the promising effects of testing. The results
contribute to the understanding of the testing effect in a college classroom and the role of
CHAPTER 1. INTRODUCTION
Testing is a powerful tool for student learning. It can be used not solely to assess
student learning and assign grades, but also to evaluate the instruction of the classroom
teacher, deliver feedback on student’s progress, review programs and curricula, and guide
policy decisions (Seymour, 2002). In effort to increase student engagement in courses,
instructors begin to instill their lectures with a number of activities, such as clicker tests,
thus increasing and diversifying the use of testing in school. Therefore, it comes as no
surprise that for over 100 years, there has been a strong interest to investigate testing and
the effects it has on student learning (Abbott, 1909; Gates, 1917; Glover, 1989; Little &
McDaniel, 2015; H. A. Peterson, 1944; Pyc & Rawson, 2010; Rock, 1957; Spitzer, 1939;
Stenlund, Sundström, & Jonsson, 2014; Tulving, 1967; Wheeler, Ewers, & Buonanno,
2003).
Because testing is the core in education, the demand to study the effect of testing
continues to grow. However, knowing that testing is important is not sufficient; knowing
how to use testing effectively under different classroom conditions is an essential
addition to educational research. To move forward, it is important to recognize and
integrate the newfound knowledge of diverse and interdisciplinary studies that
empirically explored the effect of testing with student-level data.
Testing Effect
Ample evidence in cognitive psychology (Butler & Roediger, 2007; Jason C. K.
Chan, McDermott, & Roediger III, 2006; Hogan & Kintsch, 1971; Roediger & Butler,
most students prefer re-reading to repeated testing (Clark & Svinicki, 2014), testing is a
more effective tool in storing information over long periods of time, also known as
long-term retention (Squire, 1992). This phenomenon is known as the testing effect (Roediger
& Karpicke, 2006a, 2006b) and is currently the most evidence-based learning strategy
(Dunlosky, Rawson, Marsh, Nathan, & Willingham, 2013). Studies on the testing effect
have demonstrated that when students take a test after studying the material it enhances
their memory and learning more than restudying that material alone (Butler, 2010; C. I.
Johnson & Mayer, 2009; Kang, McDermott, & Roediger, 2007; J. D. Karpicke &
Roediger, 2008; Toppino & Cohen, 2009). These results are typically found using the
following design: students in one condition are instructed to study the material twice,
whereas students in the second condition are instructed to study the material only once
and then take a test. Next, students in both conditions take the final test. The results of
these studies have demonstrated that when performance on the final test is compared,
students from the second condition significantly outperform students from the first
condition. Why do testing and additional studying opportunities lead to different learning
results? In his book, William James (1890) explained this difference as follows:
“A curious peculiarity of our memory is that things are impressed better by active
than by passive repetition. I mean that in learning by heart (for example), when
we almost know the piece, it pays better to wait and recollect by an effort from
within, then to look at the book again. If we recover the words in the former way,
we shall probably know them the next time; if in the later way, we shall very
The difference in student test performance as the result of frequent testing or studying is
explained by the idea that each condition involves different cognitive processes. To
successfully learn material, the student’s memory must complete three steps: (1) encode,
or register the material, (2) store it, and (3) find and retrieve it (Baddeley, 2009). While
testing requires student to engage in effortful retrieval (i.e., final step), studying or
re-studying the material involves encoding (i.e., initial step) (J. D. Karpicke & Roediger,
2008). For example, if a student is studying some material and learning occurs due to
reading, the material that is read is encoded and then stored in an individual’s long-term
memory. As the student rereads that material, he or she marginally enhances the memory
storage. However, when the student is presented with a test after initial learning, he or she
is required to search and retrieve the information from his or her long-term memory, thus
engaging his or her memory in all three steps. Evidence from studies on the testing effect
suggest that this effortful information retrieval tends to strengthen the capacity to retrieve
this information in the future more than the rereading process. Consequently, practicing
repeated testing as measured by testing produces more learning than re-studying the
material and, therefore, the testing effect can be classified as a beneficial strategy for
studying.
Computer-based Testing
While traditional, paper-and-pencil testing continues to dominate as the main
method of test delivery mode, the interest and need for computer-based testing (CBT) is
growing. A report by Allen, Survey, and Seaman (2014) showed that based on data from
online instruction. The same report indicated that the proportion of higher education
students taking at least one course online considerably increased from about 10% in 2003
to 33.5% in 2012 and according to about two-thirds of academic leaders, this number will
continue to grow (Allen et al., 2014). Another reason behind the drive to switch from
paper-and-pencil testing to CBT is a change in student demographics. According to a
National Center for Education Statistics (NCES) report, postsecondary student enrollment
will become more diverse by 2022; more non-traditional, part-time, and working students
will go to college in the future (Hussar & Bailey, 2014). This change in student
demographics is critically important, because non-traditional students often manage
multiple responsibilities such as family and work and thus are more likely to enroll in
online classes than typical students. Therefore, for many students CBT may become a
more common method of assessment.
The rise in CBT interest can also be explained by a set of unique advantages that
are not available with paper tests. From a teacher’s perspective, online assessments may
decrease grading time and reduce human error associated with grading, which may be
especially important for instructors who teach large-enrollment introductory classes. In
addition, the CBT permits teachers to customize their tests for different students (Wang,
2014) and incorporate dynamic and interactive features such as embedded videos and
online simulations (for a review of CBT in basic science and medicine see Kuo & Wu,
2013). Such features provide an additional opportunity to study the relationship between
the student performance and different format of online testing (DeBoer et al., 2014).
What about the CBT benefits for the test users? When students were asked why they
feedback, display of additional information such as remaining time and built-in
calculator, and flexibility to take a test anytime and anywhere (Engelbrecht & Harding,
2004; Hochlehnert, Brass, Moeltner, & Juenger, 2011; Noyes & Garland, 2008; Steinberg
et al., 2014).
Because of high demand in online courses, the topic of CBT in the educational
environment has gained considerable relevance and attention from teachers (Drasgow,
1999). In particular, this has led to the need to understand not only how CBT is used, but
also how it compares to traditional modes of testing (Alexander, Bartlett, Truell, &
Ouwenga, 2000; Brallier, Schwanz, Palm, & Irwin, 2015; Mead & Drasgow, 1993;
Neuman & Baydoun, 1998; Russell & Haney, 1997).
Statement of the Research Problem
Despite the large body of research on the testing effect, the majority of these
studies have been conducted in laboratory settings, asking participants to recall material
such as word lists (Wheeler et al., 2003; Zaromb & Roediger, 2010) or paired associates
(Carpenter, 2011; Keresztes, Kaiser, Kovács, & Racsmány, 2014; Toppino & Cohen,
2009). However, there are several differences between the laboratory and the classroom
setting. Participants in the laboratory studies often receive a free recall test on material
studied during the experiment session, whereas the tests administered in class may use
different types of questions and assess content studied days, weeks, or even several
months ago. For example, the content of general chemistry first-semester university
course is frequently assessed at the end of semester with a comprehensive exam that
2010). Kingston (2008) reviewed the impact of computer and paper administration mode
on test scores of students in grades 1-12 and found that discipline appeared to affect
differences in student performance between paper-based and computer-based tests. Due
to the differences between laboratory settings and classroom settings and limited
information on chemistry test comparability, no conclusions could be drawn with regard
to whether chemistry students benefit from practice testing before taking a
comprehensive exam with different types of questions such as algorithmic, conceptual,
and definition items.
As technology continues to supplement and enhance teaching practices in
post-secondary education (Kirkwood & Price, 2014), there is still much to be learned about its
role in testing. Specifically, under which circumstances student performance may be
maximized when practice tests for a course’ exam are available in paper and online
versions to students? The research on test mode comparability reports mixed findings.
Whereas some studies posit that a paper-and-pencil test is the more appropriate mode for
testing (Bennett et al., 2008), others show no significant differences between paper and
online test performances (Alexander et al., 2000; Hochlehnert et al., 2011). However,
these studies compared the test mode only between two groups; one group took a test on
paper and one group took the same test online. The design of the previous studies does
not allow investigating the effects of multiple tests such as the mode change or the
learning gains because they used only one test. Therefore, we do not know yet whether a
change in the test mode would lead to higher student learning gains than a one-mode
condition only. Further research needs to explore the outcome of taking practice tests
students gain from taking their first test on paper or online and how it impacts their test
performance on a subsequent test may be beneficial to instructors who teach blended
courses or have access to deliver their tests in both modes.
Overview of the Study
The testing effect has been widely studied in the laboratory, but few studies have
explored the benefits of testing in classroom environments for course-relevant material.
Although the results of the testing effect studies show positive changes in student
performance, additional research that focuses on the test delivery mode in educational
settings is needed. The purpose of this study was to replicate the testing effect, but for
content more consistent with a realistic classroom environment using general chemistry
questions in paper and online test modes.
Based on identified gaps in the literature surrounding this research, the study
focused on the following two research questions:
(1) Is there a difference in the measured performance on general chemistry tests
for students across different test mode groups?
(2) Is there a difference in average student gains for algorithmic, conceptual, and
definition questions based on the mode by which the test was delivered?
To answer these questions, 664 students from four general chemistry courses were
assigned to take two practice tests in one of four conditions: Computer – Computer,
Paper – Paper, Computer – Paper, and Paper – Computer. The four conditions were
defined by the mode of the first practice test (Computer vs. Paper) and the mode of the
algorithmic, conceptual, and definition items and was based on material that students
learned in their general chemistry course. All sessions were conducted near the end of the
first semester after all tested topics were covered in the course. Additionally, the sessions
were proctored and took place in the testing environment similar to course’s final exam.
Significance of the Study
There are many studies that investigated the testing effect and test mode.
However, the current study is the first known study to investigate test delivery mode and
mode change as a contributor to the effects of testing. By integrating several concepts,
this study addresses a gap in both the testing effect and test modality literatures and, thus,
extends the previous work in several ways. First, the testing effect is measured in the
context of general chemistry. So extending the testing effect to general chemistry
materials the findings of this study would have face validity and could prove useful to
chemistry instructors in formatting their current or future tests. Because this study used
students from general chemistry courses as participants and questioned their knowledge
in that subject, it allowed the replication of testing effect studies but in a more applied
setting, thus helping measure the possible role of the testing effect in student learning in a
classroom setting.
Second, and more importantly, the study investigates the effects of test mode on
students’ performance using algorithmic, conceptual, and definition questions within the
content area of chemistry. Computer use in educational assessment continues to rapidly
increase. Exploring the effect of test mode on different question types common to the
about the benefits of tests and how student learning may be enhanced as the result of
testing. Measuring which test mode promotes student test performance can allow
instructors to design and deliver their tests in general chemistry courses more effectively.
This, in turn, will make course assessments more useful for student learning. Thus, by
bridging the concepts of the testing effect, test modality, and question types, this work
extends the understanding of the use and benefit of testing and provides important
evidence-based recommendations for the use of testing to educators.
Overview of the Chapters
This thesis presents the background for this study, the methods used to collect
data, the results, an analysis of the results, and a discussion. The introduction chapter
provides a brief background for the study, problem statement, overview of the study
including its purpose and research questions, and study’s significance. Chapter 2 reviews
the current literature on the testing effect, test modality, and type of material used in
general chemistry testing settings, all topics that are vital to the purpose and design of this
study. After a literature review, Chapter 3 presents the methods used to collect data and
information on participants. Chapter 4 reports the results. Finally, this thesis concludes
with Chapter 5 that presents a summary of the results, followed by implications for
chemistry instructors, a discussion on study’s limitations, and opportunities for future
CHAPTER 2. LITERATURE REVIEW
This chapter summarizes the achievements and limitations of three topics that are
most relevant to this study. These topics are the testing effect, test mode, and chemistry
question types. Specifically, how the testing effect is typically studied in the laboratories
and classroom settings and what benefits it offers to students. Also, it reviews studies that
empirically investigated the comparability of paper and online test modes mode at the
overall and item level test levels. In some studies students received only one test either on
paper or online and then the performances of both tests were compared. In other studies,
students received two tests in different modes, which allowed exploration of the
interaction of test mode and test mode order effect. Finally, it discusses the types of
questions commonly found in the field of general chemistry.
Testing Effect
Learning usually occurs during the study phase and testing is one of the methods
to assess it. In the surveys on study strategies, college students report using rereading as
their primary study method (Carrier, 2003; J. Karpicke, Butler, & Roediger, 2009). The
phenomenon known as the testing effect is generally studied by comparing the student
performance that results from conditions which vary in amount of studying (i.e.,
rereading) and testing. The research on the testing effect has shown that repeated testing
enhances long-term memory development better than only rereading (Roediger &
Karpicke, 2006b). Karpicke and Roediger (2007) asked 60 undergraduate students to
learn 40 unrelated words in one of three ways. In the standard learning condition, subjects
repeated-study condition, subjects studied the item three times and recalled it once (i.e.,
SSST). Finally, in the repeated-test condition, subjects studied the item once and recalled
it three times consecutively (i.e., STTT). A final free-recall test was conducted one week
later to examine the testing effect on long-term retention. The results showed that during
the learning phase students under the standard condition (STST) outperformed students
subjected to the other two conditions. However, when performance was tested one week
later, standard and repeated test conditions outperformed the repeated study condition
(i.e., 68%, 64%, and 57% of the words were recalled, respectively). These findings tend
to suggest that repeated studying and repeated testing influence long-term learning in
different ways. More importantly, the frequent testing slows down forgetting (Spitzer,
1939).
Multiple studies have replicated the findings of Karpicke and Roediger's (2007)
study using a wide variety of learning materials, including word lists (Carpenter, 2009,
2011; Halamish & Bjork, 2011; Kornell, Bjork, & Garcia, 2011; D. J. Peterson &
Mulligan, 2013; Zaromb & Roediger, 2010), foreign language vocabulary (Carpenter,
Pashler, Wixted, & Vul, 2008; Finn & Roediger, 2011; Kang & Pashler, 2014; Pyc &
Rawson, 2010; Vaughn, Rawson, & Pyc, 2013), text passages (Agarwal, Karpicke, Kang,
Roediger, & McDermott, 2008; Butler, 2010; Clark & Svinicki, 2014; Einstein, Mullet, &
Harrison, 2012; Little & McDaniel, 2015), narratives (Jason C K Chan, Thomas, &
Bulevich, 2009), pictures (Pastötter, Weber, & Bäuml, 2013), symbol-word pairs
(Coppens et al., 2011) and video-recorded lectures (Butler & Roediger, 2007; Szpunar,
Khan, & Schacter, 2013). Therefore, the testing effect appears to be a very robust and
Most of the studies on the testing effect focus on the benefits of repeated testing
of the material that was learned shortly before the test. However, it is commonplace to
test college students on the material that they have learned several weeks or months ago
(e.g., cumulative test). Instead of asking participants to study the material during the
session and before the first practice test, participants in this study were recruited from a
general chemistry course where they studied the material for several weeks prior to their
session. Thus, the study phase occurred during the regular course period and not during
the experiment’ session. This difference in the testing effect design allowed to study the
benefits of testing under conditions characteristic of college settings.
How and why the testing effect works
Given that frequent testing improves long-term retention, how can the benefits of
the testing effect may be explained? Research points out that a transfer appropriate
processing (TAP) concept may be a mechanism to account for the testing effect. TAP
suggests that performance on the final test is enhanced when type of processing during
encoding (i.e., learning) and retrieval (i.e., testing) stages match (Morris, Bransford, &
Franks, 1977). For example, students can retrieve course information easier when
teachers provide similar cues to students during homework, quizzes, and a final test.
McDaniel (2007) illustrated this idea with a simple example: a teacher who actively
engages students in discussion on concepts and their relationship to each other, but who
tests students’ knowledge with a set of specific definitions in multiple-choice format
creates a mismatch between encoding and retrieval processing, thus leading to students’
Veltre, Cho, and Neely (2014) furthered this idea by testing test-based TAP and
using the procedures common in the testing effect experiments. First, authors assigned 48
students to the Restudy Review group and 48 students to the Test Review group. Second,
subjects learned 50 English words. After a 5-minute filler task, subjects in the Restudy
Review group restudied all items one more time while students in the Test Review group
recalled the material with half items cued semantically and half items cued
orthographically. For example, if the target word were “ABOVE”, its semantic cue was
“BEYOND” and its orthographic cue was “AB_V_”. Next, all students reviewed the
items with different cues. For students in the Restudy Review group, items were recalled
with half semantic and half orthographic cues. However, for students in the Test Review
group, in addition to half semantic and half orthographic cues, cues were either the same
or new. Finally, after two days, all students were invited to take the final test during
which they were asked to recall all items as they did in the review session. These
manipulations allowed researchers to not only study the testing effect (i.e., comparing the
performance of two groups), but also measure the level of the testing effect relative to cue
similarity. A comparison of the correctly recalled items on the final test showed that
students from the Test Review group recalled more items than students from the Restudy
Review group, indicating a positive testing effect. Evidence for test-based TAP was
strong, also. Students recalled more items correctly as cues from the review and the final
test became more similar. This finding suggests that students’ performance on the final
test may be linked to presence and similarity of cues. In other words, student performance
can improve when conditions during the final test resemble the conditions that were
Testing effect in the classroom
Although some experiments have investigated the testing effect using
educationally relevant materials (e.g., prose material), only a few studies have been
carried out in the classroom settings using material from participants’ classes. In
laboratory experiments variables such as student’ study time are usually well controlled
whereas in an actual classroom these variables may greatly vary. Therefore, it is
important to review empirical evidence from the testing effect studies that were
conducted in the classroom settings to generalize the testing effect to the classroom.
To investigate the testing effect experimentally in school, the majority of the
studies examined whether frequent testing (i.e., quizzing) enhanced the retention of the
material students had to learn in their class relative to non-tested material. The measure
was performance on a criterial test (e.g., unit test, cumulative test) administered sometime
after the learning phase. In an attempt to replicate the testing effect results in an
educational setting and using class-related material, Carpenter, Pashler, & Cepeda (2009)
found that 36 weeks after the learning session, 8th grade students retained better US
history facts when material was tested (i.e., reading the question and writing down the
answer) than restudied (reading both question and answer). Roediger, Agarwal,
McDaniel, and McDermott (2011) also observed significant benefits of testing on middle
school students’ retention of material from their social studies classes. Students who
answered in-class questions via individualized response units, or “clickers” retained the
material better on their course exams than students who read the questions with the
answers provided. McDaniel, Wildman, and Anderson (2012) also found that completing
an online college course on brain and behavior (see also McDaniel, Anderson, Derbish, &
Morrisette, 2007).
One limitation these classroom studies have is that they used only factual content
as material (e.g., “Who assassinated President Abraham Lincoln?” in Carpenter et al.,
2009). Recently, Dirkx, Kester, and Kirschner (2014) were able to address this limitation
by measuring the testing effect with the factual content and application of principles and
procedures. Authors had 38 high school students either repeatedly study four times (i.e.,
SSSS) text on probability calculations or study, take a test, study again, and take the test a
second time (i.e., STST). The final test was administered one week later and included
five factual and five procedural questions that were previously used in STST condition.
The results of the final test showed that students in STST condition significantly
outperformed students in SSSS condition on both factual and application questions.
The study by Dirkx et al. (2014) is lacking in some important respects. First, the
final performance was measured with questions to which students in STST have been
exposed twice during the learning phase. This design does not mirror well real classroom
setting where students can be exposed to material multiple times through class activities,
quizzes, additional reading, homework, and tests. Second, authors did not include any
information about whether students received any feedback on their tests. Previous studies
report that providing the correct answers particularly after a test enhances the testing
effect (Roediger & Butler, 2011). Butler and Roediger (2008) found that when using
multiple-choice tests delayed feedback is more effective than immediate feedback (e.g.,
answers with students after a test increased the proportion of correct answers and
decreased the proportion of incorrect answers on a later test.
Despite limitations, the implications of studies discussed in this section are worth
noting: the testing effect promotes long-term learning in educational settings using
diverse and authentic classroom material.
Testing effect benefits
In addition to improved learning, previous research has shown that the testing
effect has been found to produce direct and indirect benefits for students. When students
are tested with only two semester tests and one final test they are less likely to study
consistently between the tests, leading to massed studying right before the test
(Mawhinney, Bostow, Laws, Blumenfeld, & Hopkins, 1971). Frequent testing
encourages students to more actively engage in their learning (Szpunar et al., 2013) and
space their studying more equally over time (Mawhinney et al., 1971). This practice of
frequent testing reduces student test anxiety and helps students to practice the material
and identify what they need to study before their next test. Lastly, after experiencing
frequent testing students report greater learning (Leeming, 2002) and satisfaction with the
course (Bangert-Drowns, Kulik, & Kulik, 1991; Leeming, 2002).
Test Mode
The test mode refers to studies that aim to compare student performance on a test
that was administered online or with paper and pencil. The experiments on the test mode
answer which test mode (e.g., traditional paper-and-pencil or web-based) has a greater
effect on student learning by comparing student performance of a test taken on paper to
performance of a test taken online. In their review paper, Mazzeo and Harvey (1988)
analyzed the test mode effect by examining the findings of 27 research articles that
compared paper and online versions of different tests, including Slossen Intelligence
Test, Minnesota Multiphasic Personality Inventory, California algebra test, and others.
Based on their review, authors concluded that performance on paper-and-pencil tests was
not analogous to online performance. For example, out of 27 cited studies, 11 reported no
significant differences between paper-and-pencil and online scores, three studies showed
higher scores for online testing, and 13 showed higher scores for traditional testing (for
another review, also see Bunderson, Inouye, & Olsen, 1988).
Recently, the test mode has been investigated in classroom environments using
different proctoring settings. For example, Spivey and McMillan (2014) compared the
test performance and study efforts of 174 students who took an upper-level finance class
taught by the same instructor. Student performance was measured by the grades on tests
taken on paper or online and study efforts were measured by tracking the number of
times students accessed the course material via Blackboard course management software.
Despite the fact that students who received all tests online were not proctored and
students who took closed-book tests on paper were proctored, results showed that test
mode did not affect study effort or student performance. Students who took the tests
online did not exhibit significantly more or less study effort or score differently than
Other studies have reported similar results of no significant difference between
paper and online test mode versions in different disciplines. Alexander, Bartlett, Truell,
and Ouwenga (2000) found no significant difference between proctored online tests and
proctored paper tests in a computer technology class. Likewise, Tsai and Shin (2012)
demonstrated the comparability of paper-based and computer-based versions of National
Board Dental Hygiene Examination test. Yet, contradictory results have been reported by
Brallier, Schwanz, Palm, and Irwin (2015). In their study, researchers found that students
in upper psychology course who took non-proctored online tests significantly
outperformed students who took the proctored tests on paper. Although proctoring could
be a plausible answer to explain these mixed results, it is yet unclear whether student
performance depends on the test mode for a proctored science test.
Another area of research that lacks empirical evidence is the test mode order
effect. Since student learning is often measured with multiple tests, it would be
appropriate to investigate how the test mode affects performance when students take
several tests.
Test mode order effect
Often, students are exposed to several tests in a class. Yet, relatively few studies
have explored the effect of test mode order. In other words, is there an effect of different
test modes on student learning when several tests are given to a student? The implication
of the test mode order is that teacher might need to consider the mode of his or her first
Johnson and Green (2006) examined the role of test mode using 104 eleven-year
old students as participants and two mathematical tests, Test A and Test B, as the
material. One of the tests was delivered via computer whereas the other was taken on
paper. The items on tests A and B were of equal difficulty and the order of the mode and
the order of the tests were counterbalanced (Goodwin, 2010). This design resulted in four
groups. Group 1 took Test A on paper first and then took Test B online; Group 2 took
Test A first online and then received Test B on paper; Group 3 took Test B on paper first
and then Test A online; and finally, Group 4 had Test B online followed by Test A on
paper. Data analysis showed that the order of test mode, or whether students took a paper
or online test first, did not affect their performance on the second test. Although this
experiment sheds light on the test mode order effect, it has some limitations. Since its
design compared only two groups (computer first and paper mode second and paper first
and computer mode second) other groups in which modes of both tests remain unchanged
should be added for a more complete test mode order effect analysis. Second, this study
used only eight questions per test. These limitations reinforce the need to further
investigate the test mode effect using a more comprehensive design and tests with
number of questions most commonly used in a discipline.
Types of questions
Although the test mode studies report mixed findings, they share an important
limitation that focuses on how the equivalency is analyzed. Often authors use the overall
test scores as their dependent variable and mode as the independent variable when
Reynolds, & Odell, 2011). Even though this is a simple procedure, it does not allow the
identification of some patterns in item characteristics that may reveal new information
about test mode effect. For example, when Johnson and Green (2006) compared the
overall performance of paper and online mathematical tests, no statistically significant
difference was found between the tests, yet some differences were detected for individual
questions. After some in-depth item-by-item analysis, three out of 16 total items were
found to be easier on paper than online and one item was found to be easier online than
on paper.
Jackel (2014) furthered this idea by examining the scores of 1652 students who
took a college entrance test either online or on paper. The test consisted of three types of
questions: critical reasoning (making logical decisions based on scientific, technical, and
business stimuli), verbal reasoning (interpreting context from arts, humanities, and social
sciences), and quantitative reasoning (solving mathematical and scientific problems).
Looking at student performance by question type, the quantitative reasoning items
showed the highest difference in scores. On average, online questions were 5% more
difficult than the same questions delivered on paper. In particular, the highest difference
between online and paper questions was observed for questions for which students had to
use diagrams.
Mixed test mode effects were also reported by Steinberg, Brenneman, Lin,
Carlson, Bridgeman, and Golub-Smith (2014) who examined data of four years of
paper-based and computer-paper-based Praxis test, which was taken in a mode chosen by each
test-taker. This test fulfills the initial teaching licensure and passing it is required in 28 states.
controlling for test takers’ demographics, it was found that most scores of
computer-based tests were higher than the scores of paper and pencil tests for reading items. Four
out five online demographic groups outperformed paper-based groups on reading items
whereas only two online demographic groups outperformed paper-based groups on
writing and mathematics items. The remaining demographics groups showed no
significant difference between two testing modes. Further analysis showed that the level
of education associated with the test mode. That is, undergraduate test-takers are more
likely to choose paper tests and test-takers with at least a bachelor’s degree – online tests.
Student test mode preferences
Several studies have investigated students’ test preferences for computer vs.
paper-based tests. In their study, using a questionnaire Engelbrecht and Harding (2004)
asked 106 first-year calculus students what mode of testing they preferred. The results
showed that students preferred the most online assessment, (56.6%), followed by paper
assessment (21.7%) and no specific preference (21.75%). In addition, students were
asked to give reasons why they preferred one mode of testing to another. Students who
preferred online mode, most frequently mentioned reduction in stress, flexibility of time
and location, and availability of immediate feedback. Students who preferred paper
mode, most frequently mentioned availability of showing their work that could lead to
receiving some partial credit and familiarity of taking the test on paper. In contrast,
Hochlehnert, Brass, Moeltner, and Juenger (2011) reported that 63% of fifth-year medical
students preferred to take their test on paper. However, student explanations for their test
On the basis of the results of these studies, one might conclude that the test mode
comparability in classroom setting has not been fully established and needs more
empirical evidence. Although student test mode preferences have been studied, there is
still relatively little known about students’ current testing mode preferences and
specifically in the field of chemistry where students may be exposed to both modes.
Chemistry Question Types
Although previous studies provide insights into the mode effects on tests for
different disciplines such as biology (D. Kim & Huynh, 2007), English (Emerson &
MacKay, 2011; D. Kim & Huynh, 2008), mathematics (S. Wang, Jiao, Young, Brooks, & Olson, 2007a), and reading (S. Wang, Jiao, Young, Brooks, & Olson, 2007b), none of
them specifically focused on chemistry. There is a major need to address this gap because
large numbers of students take at least one chemistry course in college to fulfill
requirements for their degree (e.g., biology, engineering, medical sciences, physics).
Therefore chemistry test developers (e.g., American Chemical Society), test publishers,
teachers, and students need to know the degree of test mode effect on student learning
and test performance.
Using the previous studies (Nakhleh & Mitchell, 1993; Nakhleh, 1993;
Nurrenbern & Pickering, 1987; Pickering, 1990; Sawrey, 1990), Smith, Nakhleh, and
Bretz (2010) redefined the framework for general chemistry questions by analyzing the
American Chemical Society (ACS) general chemistry tests. These tests were developed
by a group of chemical education experts and included questions on a variety topics that
researchers identified three primary categories for chemistry questions: algorithmic,
conceptual, and definitions. Algorithmic questions imply use of memorized process to
obtain an answer, conceptual questions – non-algorithmic material, and definitions –
recalling or recognizing a definition. The descriptions for each category are summarized
in Figure 1.
Holme and Murphy (2011) explored the differences in student performance on
algorithmic and conceptual chemistry questions by reviewing 40 item pairs of two ACS
Exams Institute’s tests. The first test, the first-term general chemistry exam, included data
from 3073 students and the second test, the second-term general chemistry exam,
included data from 3557 students. An item pair consisted of two different questions that
tested student knowledge on the same topic. One item tested the knowledge
algorithmically and another one conceptually. The results revealed some interesting
patterns; students do not answer algorithmic and conceptual questions in a similar manner
even if the questions are on the same topic. While the performance of some pairs showed
Algorithmic
• Macroscopic-microscopic conversions • Macroscopic-dimensional analysis • Microscopic-symbolic conversions • Multi-stepConceptual
• Explanation of underlying ideas • Analysis of pictorial representations • Analysis/interpretation of data • Prediction of outcomesDefinitions
• Recall, understand, or apply a definition • Recognize a definitionbetter results for algorithmic questions than conceptual questions, other questions are
better answered in a conceptual form. Even though this study did not comprise
definition-type questions, its findings suggest that student performance on a general chemistry test
items may vary by question type.
Summary
Most evidence points to the conclusion that testing generates greater benefits for
long-term learning than re-reading. However, the literature is not totally consistent on the
test mode effect and still lacks empirical evidence on the test mode order effect. Previous
studies lack empirical data on comparisons between groups in which testing modes
changed and remained identical. With this information, a more complete picture of the
test mode effects can be formed, showing when two modes and in what order can be used
to produce greater learning.
Prior reviews of the literature suggest that the test scores (i.e., differences in
student performance on paper-and-pencil vs. online tests) may be attributed to differences
in the characteristics of the test items. Typically, studies that assess mode comparability
of paper-based tests versus computer-based tests conduct their comparisons at the test
level, that is, combining results of the entire paper test and compare them to the overall
online test results. When comparing performances of paper and online tests using
averages, valuable information could be lost. When only aggregated scores of entire tests
are considered, statistically significant results of individual items could cancel out at the
examine the impact of test mode at the overall test score level as well as at the item level
using relevant and useful parameters.
One way to investigate the testing mode at the item level is to consider a
discipline’s types of questions. Several studies have explored the test mode equivalency
using question type as a variable of interest and found that student performance on a
paper-based vs. online-based test was not always similar for each question type. In the
field of general chemistry, students are frequently tested with algorithmic, conceptual,
and definition questions. Little is known about the effects of chemistry question types,
test mode, and test mode order on student test performance so it still remains a hypothesis
CHAPTER 3. METHODS
While previous chapter highlighted limitations of studies on the testing effect and
test mode, this chapter discusses how they were addressed with the methods of the
present study. More specifically, in the studies reported here the testing effect was
investigated using material from a general chemistry course. Within this content area,
students’ algorithmic and conceptual skills were tested in addition to their factual
knowledge, delayed feedback was incorporated, all sessions were proctored, and tests
were delivered using one or two test modes.
To pre-test the effects of test mode, test mode order, and performance of different
general chemistry question types in a classroom setting, a pilot study and an experiment
were conducted in undergraduate general chemistry courses. First, this chapter describes
the pilot study and its impact on the design of the main experiment. Second, the chapter
discusses methodology of the experiment regarding participants, materials, design,
procedure, and test scoring. Participants from all studies gave their informed consent and
all procedures were approved by the Institutional Review Board of the universities where
studies took place (see Appendix A).
Pilot Study
The pilot study was conducted with 102 General Chemistry (Chem 177) students
at Iowa State University in fall 2012. The goal was to study how students’ performance
changes on items on a practice exam as a factor of test mode and test mode order, verify
instructions, inappropriate use of time, etc.), and assess the validity and level of difficulty
of items used on the practice exams.
Participants
Students from a general chemistry (Chem 177) course were recruited for this pilot
study. Out of 168 registered students, 106 participated in the study, in which they were
provided with iterations of practice exams in advance of their final exam for the Chem
177 course. Due to age (i.e., being under 18 years old), four students were excluded from
the data entry and analysis, thus resulting in the final sample of 102 students. The
majority of participants were females (i.e., 67% - female, 33% - male) and the average
age was 18.7. All sessions were conducted in small groups of one to eight students and
were completed within 90 minutes. Upon session completion, each participant received a
complementary access to an online American Chemical Society (ACS) general chemistry
practice exam.
Material and design
The database of general chemistry questions, including some from the out-of-print
ACS Exams General Chemistry Test Bank and newly composed items, was used to
compose practice tests. These tests consisted of 24 question pairs or 48 unique
multiple-choice (MC) questions. Each pair consisted of two different questions that tested student
knowledge on the same topic. To design open-ended (OE) questions, all 48 MC questions
were transformed to OE format by keeping the stem and removing four alternative
discussed in more detail in the methods section of the main experiment. Five test versions
were generated in which the order of items was randomized for each test and participant.
For the experimental section of the study, participants were randomly assigned to
one of the nine conditions that indicated the mode of Test 1 and Test 2. Tests were given
either on paper-and-pencil (abbreviated as PP), computer (abbreviated as Com), or iPads
(designated as iPad) that were provided to students by the researcher. All sessions were
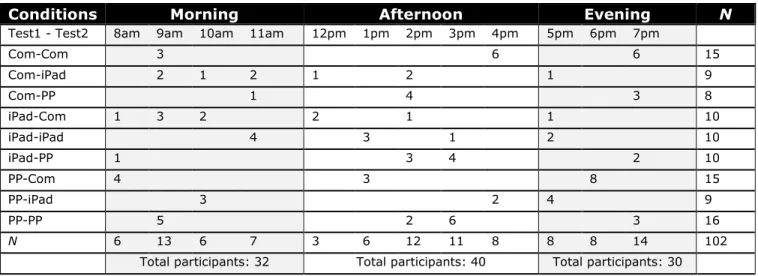
conducted either in the morning, afternoon, or evening. Table 1 depicts the number of
participants by condition and time of the day.
Table 1. Pilot study participant information by the conditions and time of the sessions
(N = 102)
Procedure
All sessions were proctored by a graduate student and occurred 1 – 14 days prior
to the course’s final examination. Students assigned to condition in which at least one
test mode was on the computer took place in a computer laboratory whereas sessions in
the other conditions were proctored in a standard classroom. Therefore, five conditions
Conditions Morning Afternoon Evening N
Test1 - Test2 8am 9am 10am 11am 12pm 1pm 2pm 3pm 4pm 5pm 6pm 7pm
Com-Com 3 6 6 15 Com-iPad 2 1 2 1 2 1 9 Com-PP 1 4 3 8 iPad-Com 1 3 2 2 1 1 10 iPad-iPad 4 3 1 2 10 iPad-PP 1 3 4 2 10 PP-Com 4 3 8 15 PP-iPad 3 2 4 9 PP-PP 5 2 6 3 16 N 6 13 6 7 3 6 12 11 8 8 8 14 102
were held in the computer lab (Com-Com, Com-iPad, Com-PP, iPad-Com, and PP-Com)
and four conditions were held in the classroom (iPad-iPad, iPad-PP, PP-iPad, and PP-PP).
Online tests were delivered via Blackboard software and paper tests were pre-printed
before each session. A 35-minute time limit was imposed for each practice test. During
the test students were permitted to use only a basic calculator, scratch paper, and general
chemistry data sheet provided by the proctor. After each test, students were given a few
minutes to verify their own performance by comparing their answers to the list of correct
answers. Before beginning the second test, students were asked to complete a non-test
related activity for about five minutes. After the second test was complete, subjects
received their code and directions for the online practice exam as compensation and were
dismissed.
Results
To analyze the results, the proportion of correct responses on Test 1 and Test 2
was calculated for each student. Overall, student performance on Test 2 was higher than
performance on Test 1, yet these changes in performance were different for each
condition. While the mean proportion of students in iPad-iPad condition improved by .03
on average, the mean proportion of students in Com-PP condition changed by .15 from
Test 1 to Test 2 (Figure 2). These results tend to suggest that changes in student
performance may vary by the mode in which tests are delivered to students.
An analysis of variance (ANOVA) showed that the mode of Test 1 (computer,
paper, or iPad) had no statistically significant effect on Test 1 performance, F (2, 99) =
Figure 2. Mean proportions of performance on Test 1 and Test 2 by conditions (N = 102)
compared overall student performance of computer-based or paper-based comprehensive
National Board Dental Hygiene Examination test and found no statistically significant
differences between two test versions. There was also a non significant effect of Test 1
mode on Test 2 performance, F (2, 99) = 1.96, p = .1467. However, one-way ANOVA
revealed a significant effect on Test 2 mode on performance of Test 2, F (2, 99) = 8.41, p
= .0004, with a large effect size (η2 = .15). Post hoc analyses using Tukey’s HSD test
indicated that students who took Test 2 on paper (M = .81, SD = .12) performed better on
Test 2 than students who took Test 2 using iPad (M = .66, SD = .15) and students who
took Test 2 on computer (M = .71, SD = 16). There was no significant difference on Test
2 performance between students who took Test 2 on computer (M = .71, SD = .16) and
iPad (M = .66, SD = .15). These results indicated that student performance on Test 1 and 0.6 0.65 0.7 0.75 0.8 0.85 Te s t 1 Te s t 2 M ea n p ro p or ti on
Mean performance by conditions
Com-Com Com-iPad Com-PP iPad-Com iPad-iPad iPad-PP PP-Com PP-iPad PP-PP
Test 2 did not depend on the mode of Test 1, but the performance on Test 2 depended on
the mode of Test 2.
Some observations were noted during the testing sessions. First, not all students
were familiar with the iPad. This caused some students to spend several minutes learning
about iPad’s features and, as the result, having less time to complete the test. Second,
most students completed Test 2 within 20 minutes, so the time limit for Test 2 was
adjusted in subsequent sessions of the pilot study. Students still had 35 minutes for Test
2, but if finished earlier, students were allowed to move to the next step.
Changes to the study
Among many advantages, conducting a pilot study allows researchers to collect
preliminary data and identify potential problems that might occur using the proposed
design (van Teijlingen & Hundley, 2001). Data analysis and personal observations
recorded during the pilot study indicated the need to make several improvements to the
study material, design, and research procedure. Next, this section summarizes the applied
adjustments and their impact on the overall methods of the main study.
Material changes
First, item difficulty was calculated for each item by dividing the number of
correct responses by the number of total students who saw that item. Ding and Beichner
(2009) suggest revising the items with item difficulty values lower than 0.3 or higher than
0.9. Therefore, pairs whose at least one question exhibited either floor effect (1% - 14%
students answered a particular question correctly) where modified by either re-writing the
stem (e.g., stem’s 3D image was replaced with the Lewis structure), replacing at least one
of the alternatives, or substituting the item with a new item (e.g., Redox Chemistry topic
was replaced with Net Ionic Equation).
Second, data analysis suggested the need to reexamine the correct answers.
Changing the question format from MC to OE originally led to all OE questions contain
the same correct answer (e.g., “Question: What is the oxidation number of manganese in
[MnO4]2– ?” Alternatives : “+4”, “+6”, “+8”, “+10” Answer: “+6”); vs. Question: “What
is the oxidation number of manganese in [MnO4]2– ?” Answer: “+6”). However, as the
data analysis showed, the correct answers to OE periodicity questions were inaccurate.
Hence, the answers to these questions were changed and differed from answers of MC
questions (e.g., “Question: Which halogen atom has the largest radius?” Alternatives:
“Br”, “Cl”, “F”, “I” Answer: “I”); vs. Question: “Which halogen atom has the largest
radius?” Original Answer: “I”, Updated Answer: “At”). Even though “At” is larger than
“I”, it could not be the correct answer for the MC version because it was not given as a
choice, which cases the subject to evaluate all options and pick the best answer among
the presented alternatives. Such question designs (i.e., excluding the best answer from
four alternatives) are common to general chemistry MC tests. As the result of these
alterations, 33 changes were made (12 stems rewritten, 11 changes to item alternatives, 8
item replacements with new ones, and 2 answer changes to OE questions). The complete
list of the final 96 questions is reported in Appendix B.
Finally, rather than re-generating several test trials, a technique called
design, researchers frequently use the counterbalancing method (Butler & Roediger,
2008; McDaniel et al., 2012; Zaromb & Roediger, 2010). Counterbalancing helps
researchers to control order and learning effects by spreading out the effects evenly over
all conditions (Goodwin, 2010; Howell, 2002). All counterbalancing steps will be
outlined in the upcoming materials section of the main study.
Design changes
Since computer labs were not always available, the computer mode was changed
from desktop computers to personal laptops so sessions could be conducted in a regular
classroom. Due to no significant difference between iPad and computer modes and the
observation that some students had limited familiarity with using iPads, the number of
modes was reduced from three (e.g., paper, computer, and iPad) to two (paper and
computer). This change also resulted in reducing the number of conditions from nine to
only four (i.e., PP – PP, PP – Com, Com – PP, and Com – Com), thus, simplifying the
design. In addition, these changes in design allowed recruiting more students and
increasing the overall sample size. Due to a limited number of iPads, only five students
could be scheduled for any condition that included iPad as one of its test modes.
Eliminating iPads as the mode and being able to conduct sessions in a regular classroom,
allowed the scheduling of up to 80 students for any session.
Another change in design included adding an extra practice test between Test 1
and Test 2. This additional test contained half of items from Test 1. Observing
improvement in student performance from Test 1 to Test 2 (Figure 1), additional practice
performance on items that were practiced twice relative to the ones that were practiced
once. More detailed information about intermediate test is presented in the design section
under the main study.
Procedure changes
The time for the non-test related activity was increased from five minutes to 20
minutes. This permitted students to take a longer break before completing the final test
and helped to reduce potential item and answer memorization. Next, changes were made
to time instructions for Test 2. Even though equal times (i.e., 35 minutes) were allocated
for Test 1 and Test 2, students were permitted to move to the next phase of the study if
Test 2 was completed earlier. Lastly, due to the limited ability to insert and view
scientific symbols and images in Blackboard, all online tests of the main study were
transferred and delivered using Qualtrics software (Qualtrics, 2015).
Scoring changes
While the calculation and use of proportion of correct responses as a dependent
measure is a frequent practice in testing effect studies where participants take several
tests (Agarwal, Karpicke, Kang, Roediger, & McDermott, 2008; Roediger III, Agarwal,
McDaniel, & McDermott, 2011), it requires additional steps to classify responses into
various equivalent groups so analyses and recommendations could be made for each
group. For example, high-performing students may respond to the test mode differently
than low-achieving students. To address this concern, a normalized gain using Hake's
Calculation of the normalized gain is useful because it considers student’s initial (pre)
and final (post) state of knowledge and then normalizes his or her pre/post gap, thus
accounting for students’ high scores (ceiling effect) and low scores (floor effect).
Main Study
Following the pilot study, the main study was conducted with three undergraduate
first-semester general chemistry courses at two universities.
Participants
A total of 664 students were recruited from general chemistry courses: two taught
at the Iowa State University and one taught at a university in the Pacific Northwest. Both
institutions are four-year public universities with undergraduate enrollment above 20,000
students, offering undergraduate and graduate programs in chemistry, with traditional
general chemistry courses taught by several faculty members. The similarity of three
courses was established based on the material covered in each class. All courses included
in the study covered nomenclature, states of mater, chemical reactions, atomic structure,
chemical bonding, the properties of gases, and thermochemistry. General Chemistry
(Chem 177) at Iowa State University and third quarter general chemistry (3Q GenChem)
course at the university in the Pacific Northwest were designed for science students and
General Chemistry for Engineering Students (Chem 167) at Iowa State University
covered the same content, but with an emphasis on applications in engineering. Table 2