Article Open Access QUANTITATIVE PETROPHYSICAL EVALUATION AND
RESERVOIR CHARACTERIZATION OF WELL LOGS FROM "DATOM" OIL FIELD,
NIGER DELTA
Article in Petroleum and Coal · July 2018
CITATIONS
0
READS
249 2 authors:
Some of the authors of this publication are also working on these related projects: Biomass Briquetting and Utilization View project
Modelling leachate contamination of shallow aquifers from a municipal dumpsite using stoichastic and deterministic approaches View project Lawson-Jack Osaki
Rivers State University of Science and Technology
4PUBLICATIONS 0CITATIONS
SEE PROFILE
Alexander Ifeanyichukwu Opara
Federal University of Technology Owerri
89PUBLICATIONS 143CITATIONS
Article Open Access
Q
UANTITATIVEP
ETROPHYSICALE
VALUATION ANDR
ESERVOIRC
HARACTERIZATION OFW
ELLL
OGS FROM“D
ATOM”
O
ILF
IELD,
N
IGERD
ELTALawson-Jack Osaki1, and Alexander Ifeanyichukwu Opara2*
1 Rivers State University of Science and Technology, Nkporo, Rivers State, Nigeria 2 Department of Geology, Federal University of Technology, Owerri, Nigeria
Received March 31, 2018; Accepted June 20, 2018
Abstract
This paper presents a detailed reservoir characterization of three wells in “Datom” Oil Field, Niger Delta using well logs data. The distributions and thicknesses of sand bodies were determined within each of the wells in the field using interactive petrophysical (IP) software. The quantitative and qualitative ana-lysis were done for the three exploration wells with the depth ranges of 8700-9200ft for Datom North well , 8900-9400ft for Datom West well, and 9000-9500ft for Datom East well. Two distinctive porous sand bodies were identified across the field (A and B), Datom North has it reservoirs as 1A (8815-8903ft) and 1B (9100-9157ft), Datom West has its reservoir as 2A (8996-9095ft) and 2B (9263-9321ft) and Datom East as 3A (9101-9219ft) and 3B (9357-9418ft). Petrophysical evaluation was made from a suite of wire-line logs comprising of gamma ray, resistivity, neutron and density logs of the wells. The average porosity values obtained are in the range of 0.18-0.22 with average net pay permeability values ranging from 322.70mD to 733.20mD. The water saturation obtained for each reservoir unit in combination with the resistivity index was used to prove the presence of hydrocarbon in the sand units. The hydrocarbon saturation of the reservoirs are in the range of 0.6-0.7 across the prospect zones with gas effect of the combination logs of neutron and density indicating the hydrocar-bon accumulation is predominantly gas. The average net to gross ratio across the reservoirs (0.7-0.9)
is defined using an average porosity (∅) and volume of clay (𝑉𝑐𝑙𝑎𝑦) cut offs values of ≥ 0.1 𝑎𝑛𝑑 ≤ 0.5
re-spectively. With a moveable hydrocarbon index (MHI=𝑆𝑊⁄𝑆𝑋𝑂) less than 0.7 across the sand units, it
shows favorable hydrocarbon moveability in the reservoirs. The results clearly revealed that the gas bearing sand units have good reservoir potentials favorable for hydrocarbon production.
Keywords: Petrophysics; Net-to-Gross; Niger delta; well logs; Porosity; Water and Hydrocarbon Saturation. 1. Introduction
The search for hydrocarbons starts with a regional knowledge of the prevailing geology in a geologic basin, where the geologist is in charge of the sedimentary sand deposition. After the geophysicist conducts seismic surveys and data processing, risky wildcat exploration wells may be drilled to test the best geological and seismic structural model. If a hydrocarbon dis-covery is made, data must be collected to evaluate the scale, quality, and quantity of the discovery. The resolution of moving an exploration well to c ompletion is depended on its eco-nomic valiabity. To establish this viability a qualitative and quantitative analysis of all available well data is paramount. This analysis carried out at about the midpoint of a critical financial investment in the field development study will eventually determine whether to proceed with well completion and incur the relative cost or otherwise. Unarguably petrophysics plays a sen-sitive role in the evaluation of well and field potential.
Petrophysics actually converts resistivity, gamma ray and porosity tool measurements into reservoir properties, resistivity and porosity are the single most important measurements made by convectional logging tools and form the foundation on which the entire industry is built. Petrophysics evaluation combines well log, core, mud log, and other disparate data
sources for the purpose of analyzing, predicting, and establishing formation lithology and po-rosity, hydrocarbon saturation, permeability, producibility, and estimating the economic
via-bility of a well. According to Asquith and Krygowski [1], well logs are used to correlate zones
suitable for hydrocarbon accumulation, identify productive zones, determine depth and thick-ness of zones, distinguish between gas, oil and water in a reservoir and to estimate hydrocar-bon reserves.
Qualitatively the petrophysical evaluation is centered on translating geophysical responses to geological parameters, for instance, what natural radioactivity means as regard shale con-tent; how sonic velocity can be interpreted as regard shale compaction; what bulk density means in terms of mineral composition etc. The ambit of this independent study is limited to the use of geophysical well log data to achieve not only the lithology and fluid type of the prospect zones but also the average water saturation and the productive capabilities will be predicted. However, as relevant as log parameters are, they should not be applied without the consultation of other necessary data like drill stem test, mud log evaluation, sample shows, nearby production etc, before taking a decision to drill.
In this study therefore, we carried out petrophysical evaluation and volumetric estimation of the “Datom” Field from a suite of wire-line logs comprising of gamma ray, resistivity, neu-tron and density logs of the wells. The analyses carried out involved the delineation of lithol-ogies, identification of reservoirs and fluid types, wells correlation and determination of petro-physical parameters (porosity, hydrocarbon saturation, volume of shale, formation resistivity, net to gross ratio, water saturation, permeability etc) of the identified reservoirs. The objective of this study therefore was to carry out a detailed hydrocarbon reservoir characterization of the “Datom” Field using well log data.
1.1. Location and geology of the study area
The ‘Datom’ Oil Field is located within the central swamp depobelt of Niger delta basin, Nigeria (Figure 1). Several earlier scholars have presented detailed information on the regional
geology, stratigraphy and structure of the Niger delta basin in several key publications [2-10].
Niger Delta according to Klett et al. [11] is situated within the Gulf of Guinea with extension
throughout the Niger Delta Province. It is located in the southern part of Nigeria between the
longitude 40 –90 E and latitude 40-60 N. It is situated on the West African continental margin
at the apex of the Gulf of Guinea, which formed the site of a triple junction during continental
break-up in the Cretaceous [12].
From the Eocene to the present, the Niger delta has prograded south-westward, forming depobelts that represent the most active portion of the delta at each stage of its development
[12]. These depobelts form one of the largest regressive deltas in the world with an area of
some 300, 000km2 , a sediment volume of 500,000 km3 and a sediment thickness of over 10
km in the basin depocenter [13]. Niger Delta Province contains only one identified petroleum
system referred to as the Tertiary Niger Delta (Akata –Agbada) Petroleum System [13-14].
Extended research by Tuttle et al. [15] confirmed this one petroleum system with the delta,
which was formed at the triple junction related to the opening of the southern Atlantic begin-ning in the late Jurassic and continuing into the Cretaceous. The delta began its development
in the Eocene with the accumulation of sediments that are now about 10 kilometers thick [12-14].
The area is geologically a sedimentary basin, and consists of three basic Formations: Akata, Agbada and the Benin Formations. The Akata is made up of thick shale sequences and it serves as the potential source rock. It is assumed to have been formed as a result of the
transporta-tion of terrestrial organic matter and clays to deep waters at the beginning of Paleocene [12].
According to Doust and Omatsola. [12] the thickness of this formation is estimated to about
7,000 meters thick, and it lies under the entire delta with high overpressure. Agbada For-mation is the major oil and gas reservoir of the delta, It is the transition zone and consist of intercalation of sand and shale (paralic siliciclastics) with over 3700 meter thick and represent
the deltaic portion of the Niger Delta sequence [13,16]. Agbada Formation is overlain by the top
Fig 1. Map of Nigeria Showing the Location of the Niger Delta and the Base map of Datom oil field with
well locations (well 1,2,3) representing Datom North, Datom East and Datom West respectively
(Modi-fied from Whiteman [16])
2. Methodology
Log analysis, or formation evaluation was done with Interactive petrophysics (IP) software. The evaluation requires the synthesis of logging tool response physics, geological knowledge, and auxiliary measurements or information to extract the maximum petrophysical information concerning the subsurface formations. The qualitative and quantitative analyses were carried out on the available petrophysical logs (GR,Resistivity, neutron and Density logs) of the Datom oil field. While qualitative analysis involves the assessment of reservoir properties, fluid type from log pattern, quantitative analysis deals with the numerical estimation of reservoir prop-erties viz; % of gas, oil and water. Empirical formulae were used to estimate the petrophysical properties of the mapped reservoir units delineated on the well logs.
The first task is to identify the zones with a low-volume fraction of shale since such zones (clean zones) are more likely to produce accumulated hydrocarbons. This task has traditionally been accomplished through two measurements: the gamma ray and combine effect of the neutron and density log, In the reservoir units, gamma ray (GR) log which measures natural radioactivity in formations reflects the shale contents while the compensated neutron/density log was use to validate the porosity and the lithology both logs were used for the identification of sand / shale lithology in the Datom field. The resistivity log in combination with the GR logs were used to differentiate between hydrocarbon and non-hydrocarbon bearing zones since hydrocarbon is a nonconductor. The combination of the neutron and density log further vali-dates the sand-shale zones and detection of gas bearing zones. The reservoir units were fur-ther characterized quantitatively to arrive at petrophysical parameters, which includes: vol-ume of shale, formation factor, porosity, water saturation, permeability and so on. Some of these parameters are discussed.
Gamma Ray Index
The gamma ray log is generally used to determine the gamma ray index using the formula
according to Asquith and Gibson [17] as given in equation 1:
where: IGR =gamma ray index; GRLOG=gamma ray reading of formation from log ; GRMIN
=mini-mum gamma ray (clean sand); GRMAX= maximum gamma ray (shale).
Volume of shale
The volume of shale was calculated by applying the gamma ray index in the appropriate
volume of shale equation according to Larionov [18] for tertiary rocks as given in equation 2:
Vsh = 0.083[2(3.7 x IGR) – 1.0]… (2)
where: Vsh=volume of shale ,IGR= gamma ray index.
Porosity
The computation of porosity was done in stages, the first involved the use of the Wyllie
equation to estimate the density derived porosity (фD), and then the neutron-density porosity
(фN-D), was estimated using the neutron (фN) porosity coupled with the density derived
po-rosity. The Wyllie equation for density derived porosity is given as shown in equation 3 [19]:
фD = (ℓmax- ℓb)/(ℓmax- ℓfluid) (3)
where:ℓmax =density of rock matrix = 2.65 g/cc ; ℓb = bulk density from log; ℓfluid = density of
fluid occupying pore spaces (0.74g/cc for gas, 0.9g/cc for oil and 1.1 g/cc for water).
The Neutron – Density porosity could be calculated according to The Neutron-Density porosity
could be calculated using the equation of Hussien et al.[20] as:
фN-D = (фN + фD)/2 for oil and water column (4)
фN-D = (2 фD+ фN)/3 for gas bearing zones… (5)
Formation factor
The estimation of the Formation Factor was achieved using the popular Humble Equation [39]:
F = a/Øm (6)
where, F = formation factor; a = tortuosity factor = 0.62 ; Ø = porosity; m=cementation factor = 2.15
Formation water resistivity (Ωm)
Using the Archie’s equation that related the formation factor (F) to the resistivity of a
for-mation at 100% water saturation (Ro) and the resistivity of formation water (Rw), the
resis-tivity of the formation water was estimated as:
Rw = Ro/F … (7)
Water saturation
Determination of the water saturation for the uninvaded zone was achieved using the Archie [21]
equation given.
Sw2 = (F x Rw)/RT (8)
But, F = Ro/Rw (9)
Thus, Sw2 = Ro/ RT (10)
where: Sw = water saturation of the uninvaded zone; Ro= resistivity of formation at 100%
water saturation; RT= true formation resistivity.
Hydrocarbon saturation
This was obtained directly by subtracting the percentage of water saturation from 100.
Thus Shy = 1 - Sw rr Shy %= 100 - Sw% (11)
where: Shy is the hydrocarbon saturation (expressed as a fraction or as percentage).
Resistivity Index
This was estimated using the ratio of formation true resistivity (Rt) to resistivity of formation
at 100% saturation (Ro) as given in equation 12:
where: I is the resistivity index. When I is equal to unity, it implies that the reservoir is at one hundred percent (100%) water saturation, The higher the value of I, the greater the percentage of hydrocarbon saturation.
Bulk volume water
Bulk volume of water (BVW) was estimated as the product of water saturation (Sw) of the
uninvaded zone and porosity (ØN-D). Thus, the bulk volume of water is shown in equation 13:
BVW = Sw x ØN-D … (13)
where: ØN-D = neutron-density porosity.
Hydrocarbon pore volume
The hydrocarbon pore volume (HCPV) is the fraction of the reservoir volume occupied by hydrocarbon. This was calculated as the product of neutron-density porosity and hydrocarbon saturation as shown in equation 14:
HCPV = ØN-D x (1 - Sw) (14a)
HCPV = ØN-D x (Sh) (14b)
Irreducible water saturation
The irreducible water saturation was calculated using the following relationship in equation 15. However, this theoretical estimate of irreducible water is majorly useful in the estimation of relative permeability.
𝑆 𝑤𝑖𝑟𝑟= (F/2000)1/2 … (15)
where: 𝑆 𝑤𝑖𝑟𝑟= irreducible water saturation; F =formation factor.
Permeability
This was based on the relationship between permeability, porosity, and irreducible water
saturation according to Wyllie and Rose [19]. The relationship is expressed in equation 16 as:
K = [(250 x (ØN-D)3)/Swi]2 … (16)
Shaliness (Vsh Total)
This is the total volume of shale represented as a depth factor within a well. It is calculated by using equation 17:
Average Vsh x Gross thickness … (17)
Net thickness
This is the column of the reservoir that is occupied by reservoir formation (e.g. sand) only and exclusive of non-reservoir formations (e.g. shale). It is calculated by using equation 18:
Gross Thickness – Vsh Total … (18)
Net to Gross ratio (NTG)
This is the ratio between the net reservoir thickness and the gross reservoir thickness. However in terms of hydrocarbon pay, it could be calculated as the ratio between the net pay thickness and the gross pay thickness. The four main steps in the application of a net -pay cut off to a particular reservoir interval are to establish a standard, calibrate one or more logs to the chosen standard, confirm that the calibration step produces results consistent with the
standard, and apply the calibrated model to all wells [22-23]. The primary geological
consider-ations in determining pay and non pay in the reservoir interval are depositional environment and hydrocarbon and structural history. The "net-to-gross ratio" or "net/gross" (N/G) is the total amount of pay footage divided by the total thickness of the reservoir interval (for sim-plicity, the well is assumed here to be vertical). The depositional environment provides a pic-ture of whether the overall reservoir interval is sand rich (high N/G) or shale rich (low N/G) and the nature of the interbedding of high-quality rock with poor-quality rock. If the reservoir interval is quite interbedded with high-quality rock intimately layered with poor-quality rock
on the scale of a few inches to a few feet, the poor-quality rock intervals, if they contain
hydrocarbons, will likely contribute to production [24-26]. However, if the layering is on a much
larger scale with thick high-quality rock intervals separated from thick low-quality rock inter-vals, then the poor-quality rock intervals are much less likely to contribute significantly to
production [22-26]. The NTG is generally estimated using equation 19:
NTG = Net thickness ÷ Gross Thickness (19)
Effective Porosity
This is the porosity of the interconnected pore spaces. It assumes the absence of shale from the reservoir. It can be calculated using the following relationship as shown in equation 20:
Фeffective = (1 – VSHALE) * фN-D (20)
Storage Volume
This is the capacity to store hydrocarbon in the reservoir. The storage volume is always higher than the hydrocarbon pore volume within a well because the net pay zone is inclusive of the grain matrix whereas the grain matrix is absent in the hydrocarbon pore volume com-putation as only the hydrocarbon in the pore spaces is calculated for. The storage volume is generally estimated using the formula given in equation 21.
Storage Volume = фN-D * Net Pay Thickness … (21)
3. Result interpretation
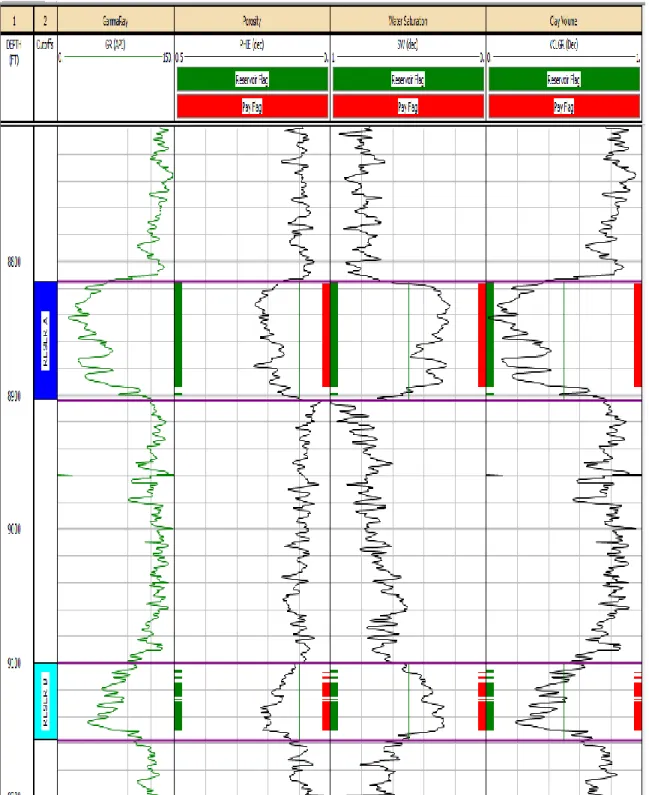
In this study based on the analysis, two hydrocarbon bearing zones (Reser A and B) were identified for further interpretation.The sand units (Reser A and B) were delineated as hydro-carbon bearing sands within the Agbada formation of the field as shown from the correlation of three wells using well logs (Figure 2). The sands were identified to be highly prolific in hydrocarbon yield and were completely analyzed to estimate their petrophysical parameters. Increasing trend of the thickness of the shale units with depth indicate that the sequence is approaching the Akata Formation. The parameters deduced from the analysis include gamma ray index, porosity, net to gross, volume of shale, formation factor, irreducible water satura-tion, hydrocarbon saturasatura-tion, water saturation and hydrocarbon pore volume etc. These pa-rameters help to effectively quantify the reservoirs.
Datom North
The reservoirs (1A and 1B) of the Datom North well have its top and base at a depth interval of 8815.50ft - 8903.50ft and 9100ft - 9157.50ft respectively with a gross thickness of 88ft and 57.50ft, net pay interval of 79.25 and 38ft, N/G are 0.9 and 0.6 .The average neutron-density derived porosity for the reservoirs are 20% and 18%, Average water saturations are 0.32 and 0.33 respectively. The net pay permeability of reservoir 1A and 1B is fair to
good,733mD and 598mD,average water of the flushed zone (𝑆𝑋𝑂) is 0.82 and 0.79 respectively
(table 1.).
Table 1. Summary of the calculated averages of Petrophysical parameters of Datom North Zone
Nam e reserv.MD Top
(ft) Base reserv.MD (ft) Gross interval (ft) Net pay interval MD (ft) N/G
ratio Av.Phie (%) Av Sw (%) Swirr (%)
Av Vcl (%) RESER 1A 8815.50 8903.50 88.00 79.25 0.90 20 32 31 22 RESER 1B 9100.00 9157.50 57.50 38.00 0.66 18 34 32 36 Zone Nam e
Net pay per-m eability
(m d)
𝑆𝑥𝑜 BVW MHI HCPV 𝑆ℎ
RESER 1A 733.20 0.82 0.06 0.39 13.56 0.68
Fig 2. Well-to-well correlation panel of the study area showing hydrocarbon bearing sand units
Fig 3. showing GR log histogram and cross plot of neutron-density log of reservoir 1A and 1B of the Datom north well for shale volume estimation
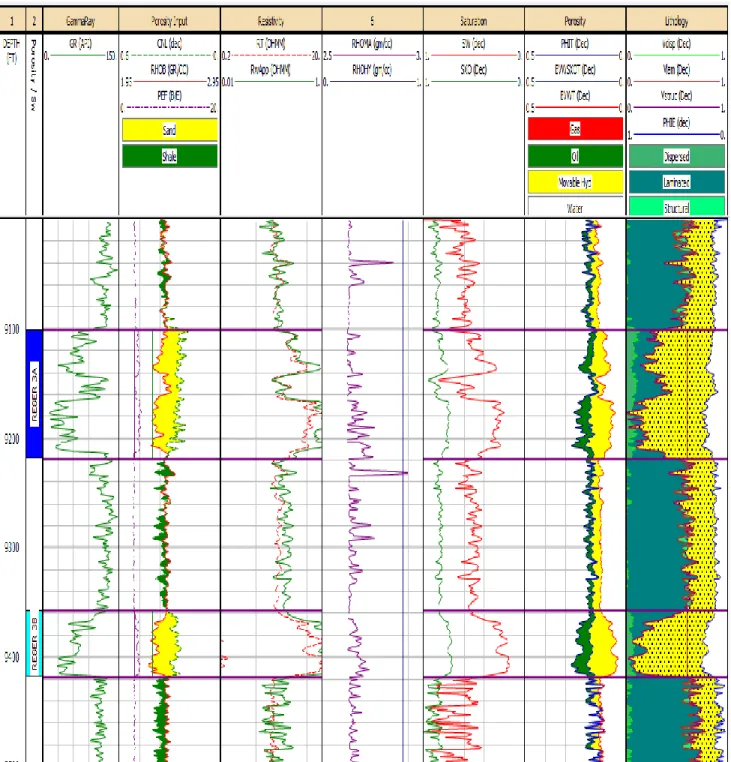
Fig 4. Comparison of petrophysical parameter logs of Datom north to validate lithology, fluid type, hy-drocarbon producibilty
Fig 5. Showing summary of cut off from average porosity, volume of clay, water saturation to estimate net pay zones of Datom north well
Datom West
The average porosity of the reservoirs (2A and 2B) of the Datom West well is approximately 18%, with well top and base at 8996.50ft-9095ft and 9263ft-9321ft respectively. It has a gross thickness of 98ft and 58ft, Net pay thickness of 86.50ft and 48ft with a N/G ratio of 0.878 and 0.828. The water saturation is relatively good at 0.38 and 0.32. The permeability
of the net pay zone and the water saturation of the flushed zone for reservoir 2A and 2B are
640mD and 471mD (permeability) and approximately 0.9 for (𝑆𝑋𝑂) (table 2).
Fig 6. Comparison of petrophysical parameter logs of Datom west to validate lithology, fluid type, hy-drocarbon producibilty
Table 2. Summary of the calculated averages of Petrophysical parameters of Datom west Zone
Nam e Top reserv.MD (ft) reserv. Base
MD(ft) Gross in-terval. MD, (ft) Net pay interval MD(ft) N/G
ra-tio Av.Phie (%) Av Sw (%) Sw irr (%) Av Vcl
RESER 2A 8996.50 9095.00 98.50 86.50 0.88 19 37 35 0.14
RESER 2B 9263.00 9321.00 58.00 48.00 0.83 18 32 31 0.13
Zone
Nam e Net pay permeabil-ity, (m d)
𝑆𝑥𝑜 BVW MHI HCPV 𝑆ℎ
RESER 2A 640.5 0.88 0.07 0.26 11.84 0.62
Fig 7. Comparison of petrophysical parameter logs of Datom east to validate lithology, fluid type, hydro -carbon producibilty
Datom East
The reservoirs in this well have average thicknesses from 9101ft -9219ft in reservoir 3A and 9357.50ft-9418ft in reservoir 3B. The average neutron-density derived porosity for the reser-voirs are between 19% and 22%, which indicates good average porosity. The water saturation of the reservoirs is 0.34 and 0.22 with a gross interval of 118ft and 61ft respectively. The net pay thickness is 88.50ft and 48ft,N/G ratio of approximately 0.8, Average net pay permeability
is 587mD and 322mD with water saturation of flushed zone to be 0.81 and 0.79 respectively (table 3).
Table 3. Summary of the calculated averages of Petrophysical parameters of Datom East Zone
Nam e Top reserv.MD (ft) reserv. Base
MD(ft) Gross in-terval. MD, (ft) Net pay interval MD(ft) N/G
ra-tio Av.Phie (%) Av Sw (%) Sw irr (%) Av Vcl
RESER 2A 9101.00 9219.00 118.00 88.50 0.75 19 34 34 36
RESER 2B 9357.50 9418.50 61.00 48.00 0.79 22 21 20 35
Zone
Nam e Net pay permeabil-ity, (m d)
𝑆𝑥𝑜 BVW MHI HCPV 𝑆ℎ
RESER 2A 587.30 0.81 0.07 0.42 12.50 0.66
RESER 2B 322.70 0.79 0.05 0.27 17.25 0.78
4. Discussion
A careful examination of the logs recorded through the three wells Datom (North, West and East) oil field shows two distinctive porous and permeable sand bodies (fig 3),where the shal-low reservoir is indicated as Reservoirs (1A,2A,3A)and reservoirs (1B,2B and 3B) as the deeper reservoir of the three wells. The average porosity and net pay permeability are hydro-carbon production friendly and also the consistent decrease of these lithological properties with depth is perhaps due to compaction resulting from the weight of the overburden. While the resistivity logs were used to detect the presence of hydrocarbon in the reservoirs, the combination response (gas effect) of the neutron-density log through the sand units (clastic reservoirs) indicates that the hydrocarbons will dominantly be gas inferred from Figures 4, 6
and 7 [26-27].
The bulk water volume (BVW) of the reservoirs was calculated at several depths and are almost constant (0.06-0.07), this indicates homogeneity of the reservoirs and is validated by
the close values of the water saturation (𝑆𝑊) and irreducible water saturation (𝑆𝑤𝑖𝑟𝑟)as shown
in tables 1,2&3.The implication is that hydrocarbon production from the zones at irreducible
water saturation should be water free [28].With a moveable hydrocarbon index (MHI=𝑆
𝑊⁄𝑆𝑋𝑂)
less than 0.7 across the sand units shows favorable hydrocarbon moveability in the reservoirs [29],
this is in agreement with the increase in average water saturation (𝑆𝑋𝑂) of the flushed zones
relative to water saturation (𝑆𝑊) across the entire reservoir (table 1,2,3). The average net to
gross ratio across the reservoirs (0.7-0.9) is defined using an average porosity (∅) and volume
of clay (𝑉𝑐𝑙𝑎𝑦) cut offs values of ≥ 0.1 𝑎𝑛𝑑 ≤ 0.5 respectively (fig 5), validates the high level of
clean sand in the reservoirs, such sand bodies confirm that the permeability and porosity are
prospective [30-32]. An average hydrocarbon saturation (1-𝑆
𝑊) ranging from 0.6-0.7 (table
1,2,3) indicates that hydrocarbon is relatively higher than water in the reservoir, it is important to note that water saturation does not represent the ratio to hydrocarbon that will be produced from the reservoir but a reflection of relative proportion of the fluids contained in the reservoir. Petrophysical analysis of the study area revealed average porosity values of 18-22% while the permeability values ranged from 322.70 – 733.20 md across the reservoirs. Hydrocarbon saturation and reservoir thickness across the reservoirs ranges from 66 - 78% and 48-98.50 ft respectively. The escalator regression sedimentation model of the Niger Delta makes it clear that younger sediments are found in the distal part of the basin with pronounced thickness
greater than that on the proximal part [33]. Compaction was initiated early in the older rocks
of proximal facies of the Depobelts of the Niger Delta and graded down basin ward. Similarly, the net-to- gross across the study area varies from 0.60- 0.9. Since it is well known that the lower the volume of shale the higher the N/G and t he better the reservoir quality, therefore the higher N/G values across the study area is indicative of very good hydrocarbon reservoirs. Since it is generally believed by some authors that the sealing capacity of faults in a reservoir is a function of the shale percentage / shale content or the shale-sand ratio in a reservoir, it therefore means that the faults of the reservoir with more shale content may be more sealing
than the faults of the reservoir with lower shale content [12,34]. There also seem to be a gradual
decrease in sand percentage moving away from the structure building bounding faults towards
the distal flanks [35]. The stacked thicknesses of the reservoirs ranging between 18.20-33.86m
and 31.48-77.47m for reservoirs Sand_A and Sand_B are relatively high.
5. Summary, Conclusion and Recommendation
Gamma ray, neutron, density, resistivity/conductivity logs were employed in the evaluation and examination of three wells, Datom (North, West and East). Two gas rich bearing sand units were delineated across the formation, with porosity ranging from 0.18 to 0.22 indicating a suitable reservoir quality, Favorable net pay permeability values from 322.70mD to 733.20mD derived from logs and hydrocarbon saturation range of 0.62 to 0.78 implied high hydrocarbon production. These results in addition with the hydrocarbon movability index (MHI) values suggest high hydrocarbon potential and a reservoir system whose performance is considered satisfactory for hydrocarbon production.
However, as relevant as log parameters are, they should not be applied without the con-sultation of other necessary data like drill stem test, mud log evaluation, sample shows, nearby production etc before taking a decision to drill. Secondly, the hydrocarbon reserve was not estimated due to unavailability of the area extent of the reservoir therefore I recom-mend that 3-D seismic data should be incorporated to allow for detailed and complimentary study of “Datom” Oilfield, which includes necessary parameters to enable an accurate static and dynamic model of the reservoir to be constructed. This will enhance the geometry of the geologic features, reveal the area extent of prospect zones and reduce inherent uncertainty.
References
[1] Asquith G and Krygowski D. Relationships of Well Log Interpretation in Basic Well Log Analysis
Method in Exploration Series. American Association of Petroleum Geologists; 2004; 16: 140.
[2] Avbovbo. Tertiary lithostratigraphy of Niger Delta. American Association of Petroleum
Geolo-gists Bulletin, 1978; 62: 295-300.
[3] Short KC , and Stäuble AJ. Outline of geology of Niger Delta. Ame. Assoc. of Petrol. Geol. Bull.,
1965; 51:761-779.
[4] Hospers J. 1965. Gravity field and structure of the Niger Delta, Nigeria . West Africa. Geol.
Soc. of Ame. Bull., 1965; 76: 407-422.
[5] Hospers J. The geology of the Niger delta area. In: F.M. Delany (Editor), Continental Margin,
Geol. E. Atlantique, SCOR Conference, Cambridge 1970. HMSQ: 123-142.
[6] Evamy BD, Haremboure J., Kamerling P, Knaap WA, Molloy FA, and Rowlands PH.
Hydrocar-bon habitat of Tertiary Niger Delta. Ame. Assoc. of Petrol. Geol. Bull., 1978; 62:277-298.
[7] Nton ME. and Adesina AD. Aspects of structures and depositional environment of sand bodies
within Tomboy Field, Offshore Western Niger Delta, Nigeria. Mater. & Geo-environ., 2009; 56(3): 284–303.
[8] Ejeh OI. Sedimentary Fill Modelling Relationships to Sequence Stratigraphy and its
implica-tions for Hydrocarbon Exploration in the Niger Delta. Nig. Pacif. Jour. of Scie. & Tech., 2010; 11 (1): 502 – 509.
[9] Olowokere MT and Abe SJ. Structure and Facies Development Resulting from Neogene Gravity
Tectonics and Depositional Processes: Application to Afo Field Niger Delta, Nigeria. Jour. of Emer. Trends in Engi. & Appl. Scie., 2013; 4(3):5-41.
[10] Edigbue PI, ,Komolafe AA, Adesida AA, and Itamuko OJ. Hydrocarbon reservoir
characteriza-tion of “Keke” field, Niger Delta using 3D seismic and petrophysical data. Ame r. Jour. of Sci. & Industr. Resear., 2014; 5(2): 73-80; DOI:10.5251/ajsir.2014.5.2.73.80.
[11] Klett TR, Ahlbrandt TS, Schmoker JW, and Dolton JL. Ranking of the world’s oil and gas
provinces by known petroleum volumes. U.S. Geological Survey Open-file Report-97-463, 1997.
[12] Doust H, and Omatsola E. Niger Delta, in, Edwards, J. D., and Santogrossi, P.A., eds.,
Diver-gent/passive Margin Basins, AAPG Memoir 48, 1990, Tulsa, American Association of Petro-leum Geologists;p 239-248.
[13] Kulke H. Nigeria, in, Kulke, H., ed., Regional Petroleum Geology of the World. Part II: Africa,
[14] Ekweozor CM, and Daukoru EM. 1994. Northern delta depobelt portion of the Akata-Agbada Petroleum System, Niger Delta, Nigeria, in The Petroleum system—from source to trap: AAPG Memoir, 1994; 60: 599-613.
[15] Tuttle MLW, Charpentier RR, and Brownfield ME.The Niger Delta Basin Petroleum System:
Niger Delta Province, Nigeria, Cameroon, and Equatorial Guinea, Africa . Open- File Report 99-50-H, United States Geological Survey, World Energy Report:44, 1999.
[16] Whiteman A. Nigeria: its petroleum geology, resources and potential: Graham & Trotman,
London 1982. 1: 390-394.
[17] Asquith GB, and Gibson CR. 1982. Basic Well Log Analysis for Geologists Methods in
Explora-tion Series),The American AssociaExplora-tion of Petroleum Geologists(AAPG) ; 1982: 216pp
[18] Larionov VV. Radiometry of boreholes (in Russian), NEDRA 1969, Moscow.
[19] Wyllie MRJ, and Rose WD. 1950. Some Theoretical Considerations Related to the Quantitative
Evaluation of the Physical Characteristics of Reservoir Rock from Electric Log Data,” Trans., AIME, 1950; 189: 105.
[20] Hussein S, Hassan S, Klimentos T, Boyd A and Zeid A. Using NMR and Electrical Logs for
Enhanced Evaluation of Producibility and Hydrocarbon Reserves in Gas Reservoirs with Hig h
Irreducible Water Saturation; 40th SPWA Logging Symposium, 30 May-3 June.,1999, Oslo,
Norway;Paper HH.
[21] Archie GE. 1941. The electrical resistivity log as an aid in determining some reservoir
char-acteristics. Transactions of AIME, 1941; 146: 54–62.
[22] Cobb WM, and Marek FJ. Net Pay Determination for Primary and Water flood Depletion
Mech-anisms. Presented at the Socie. Petrol. Engin. (SPE) Annual Technical Conference and Exhi-bition 1998, New Orleans, Louisianna, USA, 27–30 September. 1998; SPE-48952-MS. http://dx.doi.org/10.2118/48952-MS.
[23] Egbele E, Ezuka I and Onyekonwu R. Net-To-Gross Ratios: Implications in Integrated
Reser-voir Management Studies. Nigeria Annual International Conference and Exhibition of the So-cie. of Petrol. Engi (SPE), 1-3 August,2005, Abuja, Nigeria. SPE-98808-MS;
https://Doi.org/10.2118/98808-MS
[24] Inichinbia S, Sule PO, Hamza H, and Ahmed AL. 2014. Estimation of net-to-gross of among
hydrocarbon field using well log and 3D seismic data. IOSR Jour. of Appl. Geol. and Geophys., 2014; 2(2): 18-26.
[25] Maharaja A. Global net-to-gross uncertainty Assessment at reservoir appraisal stage . Doctor
of Philosophy Thesis, Department of Energy Resources Engineering 2007, Stanford Univer-sity, USA: 144.
[26] Doust H. The Niger Delta hydrocarbon potential, a major Tertiary NigerProvince . Proceedings
of KNGMG Symposium 1989, Coastal Lowstands, Geology andGeotechnology, The Hague, Kluiver Acad. Publ., Dordrecht.p22-25.
[26] Zee Ma Y, Moore W, Kaufman P, Luneau B and Gomez E. Identifying Hydrocarbon Zones in
Unconventional Formations by Discerning Simpson’s Paradox . Soc. of Petrol. Engi.(SPE) Western North American and Rocky Mountain Joint Regional Meeting, Denver, Colorado, USA, 16–18 April 2014; SPE 169495-MS:11.
[27] La Vigne J, Herron M, and Hertzog R. Density-Neutron Interpretation in Shaly Sands. In
Trans., Society of Petrophysicists and Well Log Analysts: 35th Annual Logging Symposium. Paper EEE.
[28] Morris RL and Biggs WP. Using log-derived values of water saturation and porosity. Soc.
Professional Well Log Analysts, 8th Ann Logging Symp 1967, p. 13.
[29] Schlumberger Educational Services, Log Interpretation Principles/ Applications . 1989.
[30] Osaki LJ. 3D Seismic Attributes Analysis And Reserve Estimation Of ‘’Guramala Field’’, Coastal
Swamp Depobelt, Niger Delta. (Unpublished M.Sc Dissertation) Federal University Of Tech-nology 2015, Owerri;142p.
[31] Osaki LJ, Opara AI, Adiela UP, Njoku IO, Emberga TT,and Eluwa N. 3D Seismic Interpretation
and Volumetric Estimation of “Osaja Field” Niger Delta, Nigeria. Int. Lett. Nat. Sci., 2016; 59: 14-28.
[32] Opara AI. 2010. Prospectivity Evaluation of “Usso” Field, Onshore Niger Delta Basin, Using
3-D Seismic and Well Log 3-Data. 2010; Pet Coal 52(4): 307-315.
[33] Knox GJ, and Omatsola EM. Development of the Cenozoic Niger Delta in Terms of the
“Esca-lator Regression” Model and Impact on Hydrocarbon Distribution. In: van der Linden, W.J.M., et al., eds., Proceedings of KNGMG Symposium on Coastal Lowlands 1989, Geology, Geotech-nology, Kluwer Academic Publishers, Dordrecht: 181-202.
[34] Weber KJ, and Daukoru EM. Petroleum geology of the Niger Delta. Proceedings of the Ninth World Petroleum Congress, Volume 2, Geology: London, Applied Science Publishers 1975, Ltd: 210-221.
[35] Stacher P. Present understanding of the Niger Delta hydrocarbon habitat. in, Oti, M.N., and
Postma, G., eds., Geology of Deltas: Rotterdam 1995, A.A. Balkema: 257-267.
[36] Dresser. Log interpretation charts, Houston Dresser Industries 1979, Inc. pp. 107.
[37] Bhuyan K, and Passey QR. Clay Estimation from GR and Neutron-Density Porosity Logs. PWLA
35th Annual Logging Symposium, 19-22 June, Tulsa, Paper D.
[38] Nwajide CS. 2013.Geology of Nigeria’s Sedimentary Basins. CSS Bookshops Limited, Lagos,
Nigeria 2013:120; ISBN: 978-978-8401-67-4.
[39] Winsauer WO, Shearin HM, Masson PH, and Williams M. 1952. Resistivity of brine Saturated
Sands in Relation to pore Geometry. AAPG Bulletin, 1952; 36: 253-277.
T o whom correspondence should be addressed: Alexander Ifeanyichukwu Opara, Department of Geology, Federal
![Fig 1. Map of Nigeria Showing the Location of the Niger Delta and the Base map of Datom oil field with well locations (well 1,2,3) representing Datom North, Datom East and Datom West respectively (Modi-fied from Whiteman [16] )](https://thumb-us.123doks.com/thumbv2/123dok_us/10871252.2975992/4.918.114.807.110.496/nigeria-showing-location-niger-locations-representing-respectively-whiteman.webp)