DATA-DRIVEN MODELING OF
ENGAGEMENT ANALYTICS FOR
QUALITY BLENDED LEARNING
Nan Yang
1, Patrizia Ghislandi
2,
Juliana Raffaghelli
3, Giuseppe Ritella
41 Beijing Academy of Educational Sciences, China - yangnanbnu@ foxmail.com
2 University of Trento, Italy - [email protected]
3 The Open University of Catalonia, Spain - [email protected] 4 University of Helsinki, Finland - [email protected]
Keywords: Engagement analytics, data-driven modeling, quality teaching and learning Engagement analytics is a branch of learning analytics (LA) that focuses on student engagement, with most studies conducted by computer scientists. Thus, rather than focusing on learning, research in this field usually treats education as a scenario for algorithms optimization and it rarely concludes with implications for practice. While LA as a research field is reaching ten years, its contribution to our understanding of teaching and learning and its impact on learning enhancement are still underdeveloped. This paper argues that data-driven modeling of engagement analytics is helpful to assess student engagement and to promote reflections on the quality of teaching and learning. In this article, the authors a) introduce four key constructs (student engagement, learning analytics, engagement analytics, modeling and data-driven modeling); b) explain why data-driven modeling is chosen for engagement analytics and the limitations of using a predefined framework; c) discuss how to use engagement analytics to promote pedagogical reflection for citations:
Journal of e-Learning and Knowledge Society
Je-LKS
The Italian e-Learning Association JournalISSN: 1826-6223 | eISSN: 1971-8829
Yang N., Ghislandi P., Raffaghelli J., Ritella G. (2019), Data-Driven Modeling of Engagement Analytics for Quality Blended Learning, Journal of e-Learning and Knowledge Society, v.15, n.3, 211-225. ISSN: 1826-6223, e-ISSN:1971-8829
using a pilot study as a demonstration. As a final remark, the authors see the need of interdisciplinary collaboration on engagement analytics between computer science and educational science. In fact, this collaboration should enhance the use of machine learning and data mining methods to explore big data in education to provide effective insights for quality educational practice.
1 Introduction
The pervasive integration of digital technologies into teaching and learning in Higher Education (HE) generates a large volume of data that can be mined in search for patterns. Learning analytics (LA) emerged in this context with the aim to understand and optimize learning and the environments in which it occurs (Ferguson, 2012). Most studies in LA focus on student engagement as trace data are about students’ behavior in the Virtual Learning Environment (VLE) (Vytasek et al., 2020). Compared to traditional studies on student engagement, engagement analytics has differential characteristics. First, it uses trace data that are automatically archived in the VLEs, while traditional studies use data collected manually and purposely. Second, trace data are large volume, multi-faceted and fine-grained which require complex computational methods such as Decision Tree (Wolff et al., 2013) and Neural Network (Okudo et al., 2017) for analysis, while traditional studies usually adopt qualitative methods (such as thematic analysis) and simple statistics such as descriptive statistics (Fisher & Marshall, 2009) and T-test (De Winter, 2013) for data analysis.
Engagement analytics has the potential to advance the ways of reflecting on student engagement because trace data, as a new type of data, require more advanced methods to analyze. However, engagement analytics’ research currently focuses mainly on techniques for handling data rather than reflecting on how these techniques can contribute to optimize pedagogical practices – the learning analytics’ goal. One possible problem relates to the use of MOOCs rather than blended learning as the context of most empirical studies on LA. Given that MOOCs are still supplementary elements rather than a replacement for university teaching (Li & Yang, 2018), results of engagement analytics on MOOCs fail to provide implications for most common blended learning practice in HE.
This paper explores data-driven modeling of engagement analytics as a helpful approach in promoting teachers and students’ reflections that improve the quality of teaching and learning practice in the most common context of blended learning in HE.
Though trace data are currently generated from online activities, in blended learning the findings of engagement analytics should affect the practice of teaching and learning both online and face-to-face. Furthermore, with more and more “smart classrooms” available (Kim et al., 2018), we can expect
multimodal (such as audio, video, image, text, etc.) trace data in the future (Blikstein et al., 2016).
2 Background
In this section, four main constructs are introduced with the aim of providing a conceptual basis for our claims: student engagement, learning analytics, engagement analytics, modeling and data-driven modeling.
2.1 Student Engagement
Student engagement is defined as the time and effort students devote to educationally purposeful activities (Kahu, 2013). One of the pioneer researchers to emphasize the importance of student engagement is Richard Snow (1980). Although engagement is not the only factor that influences learning outcomes, research shows that it might trigger deeper learning (Dunleavy & Milton, 2008). More recently, Kuh (2004) created instruments to measure student engagement, demonstrating positive correlations of student engagement with retention and academic success (Richards, 2011).
Blumenstein et al. (2018) present three elements of engagement: affective/ emotional engagement (e.g. enjoyment, boredom, anxiety, etc.) regarding students’ social and psychological responses toward their education; cognitive engagement, concerned with how students think about their learning and academic ability, experiences, and environment; behavioral engagement related to actions such as attendance in class, level of participation and time spent on assessment activities. These three elements seem to play a role in defining the quality of educational experience. Furthermore, Chickering and Gamson (1987) indicate seven principles to improve college and universities quality experience which can be deemed as connected with engagement: 1. encourage contact between students and faculty; 2. develop reciprocity and cooperation among students; 3. use active learning techniques; 4. give prompt feedback; 5. emphasize time on task; 6. communicate high expectations; 7. respect diverse talents and ways of learning. Gibbs (2010) states that the more students are engaged in the seven principle activities, the more they learn. Beside this, Gibbs underlines that the crucial variable for educational quality is student engagement, which is facilitated by the level of academic challenge, the extent of active and collaborative learning and the extent and quality of student-faculty interaction.
An initiative that gave momentum to the interest towards student engagement is the National Survey of Student Engagement (NSSE), first launched in 1999 by Indiana University. It focused on the extent to which students participate
in the educational processes that contribute to the outcomes (NSSE, 2018). However, while NSSE focuses on macro level (such as institutions, regions, countries, etc.), current engagement analytics mainly focuses on micro level (such as learning activities, courses, etc.).
2.2 Learning Analytics
Learning analytics (LA) is defined as the measurement, collection, analysis and reporting of data about learners and their contexts, for purposes of understanding and optimizing learning and the environments in which it occurs (Ferguson, 2012). Sharples et al. (2013) argue that “LA enables visualization and recommendations to influence student behavior while a course is in process”.
Log data about learners and their activities (log to the courses’ sites, assignments delivery, participation in forums, drop-out, etc.) can be dealt with through big data techniques (Daniel, 2015). However, the real challenge is generating the right pedagogical questions to interrogate big data in a way that teaching and learning quality can be effectively supported, also considering ethical concerns (Prinsloo & Slade, 2017). It has been claimed that LA can help the teachers to find early indicators of student problems, learning material inadequacy, unclear interfaces, etc. This could also support teachers’ more focused intervention, improving educational quality (Viberg et al., 2018). LA can also help students’ self-regulation along the learning process as an essential soft skill for workers of the future society.
2.3 Engagement Analytics
Engagement analytics refers to studies in the field of learning analytics that focus on student engagement (Vytasek et al., 2020). Student engagement, deemed highly relevant in quality teaching and learning, is still hard to define in operational terms, a fact that has crucial impact on data mining techniques “It is important to recall that engagement is a theoretical concept and it cannot be measured directly. When online learners interact in an electronic environment, they leave a data trail of when and where they have been, what documents they have accessed, who they talked to, and how well they are doing on web quizzes. LA is a growing field that analyzes this transactional data either looking for specific information for a single learner, or for more general patterns of interaction from which one might measure progress, infer engagement and possibly predict outcomes” (Richards, 2011).
Engagement (and its effects) have been measured in several forms. Hung
frequency of login, modules accessed, clicks, and discussion board posts) tend to have higher final grades. In a model that accounted for student demographics and the number of teacher comments throughout the course, Liu and Cavanaugh (2012) showed that the total number of minutes a student spent logged in to an online biology course, was the strongest predictor of final scores.
The Social Networks Adapting Pedagogical Practice (SNAPP) tool for extracting student online network data and visualizing them as social graph structure (Dawson et al., 2010), was claimed to support teacher interpretations about the quality of learning activities. However, though the graph illuminates the most active participants as well as the messages and connections among students and teachers, it does not provide information about the quality of the engagement.
2.4 Modeling and Data-Driven Modeling
A mathematical model embodies a set of statistical assumptions concerning the generation of some sample data and similar data from a larger population. To create the model, relevant data is selected; hence the model is repeatedly tested, with the available data (Kennedy & Bancroft, 1971).
Data-driven modeling is an approach to build models that is based on the data analysis about a system (input, internal and output variables) without explicit knowledge (Solomatine et al., 2008). One example to explain data-driven modeling and non-data-data-driven modeling can be demonstrated with reference to two approaches to qualitative data analysis: grounded theory and thematic analysis. Grounded theory has three stages in coding: initial coding, focused coding and theoretical coding (Charmaz, 2014) while thematic analysis has only one step, which is to analyze the corpus with a predefined list of themes (Mohammed et al., 2016). Non-data-driven modeling is similar to thematic analysis, and both are a process of deductive reasoning. Data-driven modeling is similar to grounded theory, and both are mainly a process of inductive reasoning, that brackets the previous knowledge for avoiding potential influences in the analysis.
3 Connecting Engagement Analytics to the Practice of Blended Learning
This section will argue that data-driven modeling of engagement analytics is helpful to assess student engagement and to improve the quality of teaching and learning. The first part explains why data-driven modeling is chosen for engagement analytics (instead of predefined framework, normally used before the era of big data). The second and third part explain how engagement analytics can improve the teaching and learning practice using our pilot study
as a demonstration. Our assumption is that engagement analytics can show learners’ patterns and they are potentially useful to enact better teaching and learning.
3.1 Data-driven modeling of engagement analytics
There are two approaches for engagement analytics: top-down and bottom-up. In the former, we have a predefined framework to model student engagement while, in the latter ⎯also called data-driven modeling of engagement analytics⎯, we do not have any predefined framework. We are familiar with the top-down approach as it is the dominant approach to study student engagement in traditional studies, where we collect data from surveys, interviews, observations, quasi-experiments and so on. In these cases, we usually have a predefined framework because we need a specific perspective to look at the data. For example, we design the questions in the survey or the protocol for the classroom observation. An exception is grounded theory, which we mentioned before as an example to explain the data-driven modeling.
Such predefined framework has several limits. First, since engagement analytics use big data, it is easy to find things statistically significant but unfortunately many of them are pedagogically meaningless (Shaffer, 2017). Second, most trace data used currently in engagement analytics present only behavioral engagement, even though student engagement is a complex concept composed of behavioral, emotional and cognitive aspect (Fredricks et al., 2004). Third, trace data are only recordings of quantitative students’ behavior in the VLEs, and fails to account for the content of student engagement and its quality. For instance, how can we explain the data which suggests that students with low engagement (e.g. in forum posts and writing) obtain the best final grade, without analyzing the content of their posts?
It is vital to remember that data-driven modeling of engagement analytics is more difficult to conduct given that it requires several interventions from the analysts that facilitate the emerging of patterns from data. Thus, the work of analysts will directly affect the quality of research. Specifically, trace data are the raw data in the engagement analytics. It is the analyst who selects the data that are relevant to engagement based on the dataset to be explored. The analyst’s background knowledge on student engagement and education in general will influence in a decisive way which data will have to be selected, which has a fundamental impact on the engagement analytics’ analysis itself. Machine learning and data mining methods such as Decision Tree (DT) and Neural Network (NN) can be used as data-driven modeling methods for engagement analytics. Specifically, DT can use students’ forum views in the first 15 days, second 15 days, third 15 days (several input variables) to create a
model that predicts if they will pass or fail the final exam (the value of a target variable). NN can use students’ forum views and their academic performance (as inputs and outputs of the NN) in the previous academic year to train the model for predicting students’ academic performance this academic year (outputs of the NN) by using their forum views (inputs of the NN). Both DT and NN require analysts to adjust the model’s parameters, thus, the quality of the model will depend on the quality of the parameter adjustment. Once we design the model on student engagement, analysts are responsible to explain the model, which also requires extensive knowledge on student engagement and education in general. As explained earlier in this paper, educational researchers usually use available educational theories (a predefined framework) to model data on student engagement (Yang et al., 2018) while computer scientists usually use machine learning and data mining methods (data-driven approach) to do it. The former loses the opportunities to conduct engagement analytics due to the lack of knowledge in machine learning and data mining while the latter, who can conduct engagement analytics, may concludes things that add little value to the field of educational sciences (Wen at al., 2014; Al-Shabandar et al., 2018) due to the lack of relevant knowledge. Educational researchers and computer scientists complement each other in terms of their knowledge on engagement analytics.
3.2 Engagement analytics promotes reflections and quality of teaching/learning
practice
Effective engagement analytics should be timely and specific, in order to promote reflection and innovative practice (Shute, 2008). We argue that visualization on student engagement over time is an efficient way to present patterns emerging from the data. It promotes reflection for both the teacher and the student. For teachers, it can present the average of student engagement for the whole class and individual engagement levels. This information provides an easier way to detect disengaged students, not only to provide timely feedback to students but also to assist teachers on contrasting cheating and plagiarism. For students, it can present their activities in the online environment throughout the duration of the course, which encourages them to reflect on their learning styles, meta-cognitive skills, time management, etc. In this respect an important reminder is to use the peer comparison and class averages carefully with regard to the visualization offered to students because it could discourage students who are struggling and result in maladaptive learning (Urdan & Midgley, 2001).
Likewise, effective engagement analytics also promotes the improvement of quality teaching. For example, visualization of student analytics might bring implications on the learning design for quality teaching (Ghislandi, 2015;
Ghislandi & Raffaghelli, 2015), such as when to post a question in the forum (check the most active time for students’ participation online) and what kind of learning activities are attractive for students (check the number of views and contributions by students).
Most current studies on engagement analytics focus on embracing the data mining and machine learning method to explore student engagement but fail to make informed decisions about how to improve engagement in learning.
With no doubt, we should embrace the cutting-edge methods for engagement analytics to facilitate the positive change in practice. Since the dominant method is still to model engagement for predicting academic performance (Vytasek et al., 2020), the feasibility of including cognitive and emotional engagement for the data-driven modeling should be explored. However, the lack of interdisciplinary thinking, mixing the search of optimal algorithms in computer science with the pedagogical reflection, is a clear issue. This leads us to recommend interdisciplinary research in learning analytics.
3.3 An example of data-driven modeling for engagement analytics’ visualization:
Group-Based Trajectory Modeling
Based upon the prior debate we built two visualizations on engagement analytics in an undergraduate course at a university in the North of Italy. Both use the course’s log data from online forums. The first visualization was created in Tableau (Fig. 1a, Fig. 1b), it respectively presents two students’ forum views during the course from late February to the middle of May. The horizontal axis shows the date while the vertical axis shows “number of records” that present the number of forum views per day. Fig.1 shows a significant difference between two students’ trajectory of forum views, which is hardly discovered by traditional forum analysis such as the mean of forum views per students in the course. Student A in Fig. 1a is a student that got the maximum grade in the final exam while student B in Fig. 1b is a student who was absent for the final exam. Though Tableau is only a tool for visualization rather than modeling data, this type of data-driven approach of real-time visualizing in the teaching and learning process will not only assist the teacher to understand individual students’ engagement in the learning activities but also make students aware of their efforts and time to study in a course, which impacts student learning and assessment (Viberg et al., 2018).
Fig. 1 (a) - Summary on student engagement in the online forum (Student A)
Fig. 1 (b) - Summary on student engagement in the online forum (Student B)
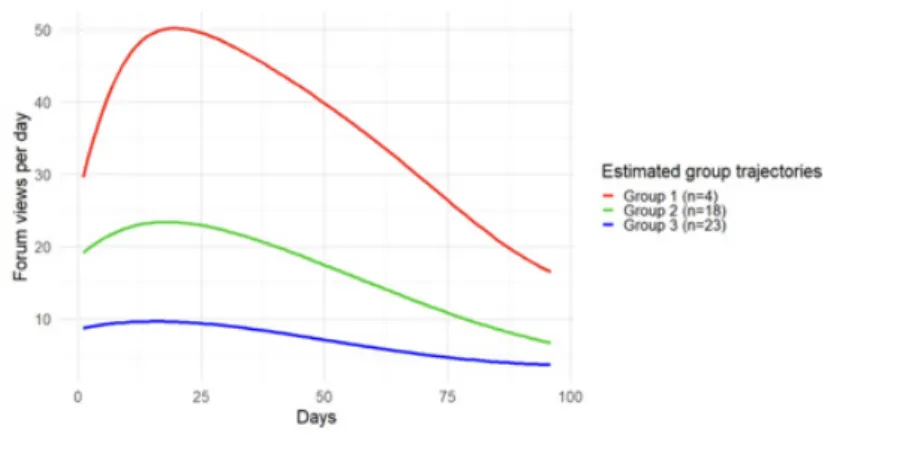
In the large class setting, for instance, with 300 students, it will be difficult for the teacher to first check individual student engagement in the teaching and learning process. Thus, it is necessary to have a data-driven modeling method to categorize students into several groups, so the teacher can understand who belongs to the low-engagement group and provide helps for their learning. Group-Based Trajectory Modeling (GBTM) is used as an example to show how to group students without a predefined framework. GBTM is a statistical method that aims to identify the distinct trajectories or patterns of change that exist within a population (Nagin, 2005). In the context of student engagement, it will identify groups of students in terms of their trajectory of engagement in the online forum. GBTM is conducted in R 3.6.1 with the package crimCV. Fig. 2 shows the result of applying GBTM on students’ learning trajectory. The number of groups shown in Fig.2 is set as three based on the result of model fits methods – Akaike Information Criterion, Bayesian Information Criterion
and Cross Validation (Burnham & Anderson, 2004; Arlot & Celisse, 2010).
Fig. 2 - Data-driven modeling method to categorize student engagement
Colored lines in Fig.2 shows the mean value of three groups about student engagement in the online forums of the course. Group 1 was composed of 4 students, who participated actively in the online forums. The peak of engagement for Group 1 was 50 forum views per day. Group 2 was composed of 18 students, and it had a similar shape of trajectory compared to Group 1. In fact, both Group 1 and Group 2 experienced an increase in engagement at the beginning of the course and a decline after the peak value. This increase was due to the design of the course that requires students to access the online forums more frequently. The peak of engagement for Group 2 was less than 25 forum views per day. Group 3 was composed of 23 students that did not participate in the online forum actively. There is not a remarkable peak value in the trajectory of Group 3 and the maximum of forum views per day is less than 10. With this kind of visualization, the teacher can easily identify, in the early phase of the course, which student belongs to which group of engagement level (Vuorikari
et al., 2016). In case, most students belong to the “low-engagement” group, the teacher can adjust the activities in time to improve student engagement in the teaching and learning process. Furthermore, the teacher can have a general understanding on different patterns of student engagement emerging from the data. This is hardly to discover with the traditional methods on student engagement as it can’t identify subgroups of trajectory without a predefined framework.
Conclusion
This paper argues that data-driven modeling of engagement analytics is helpful to analyze student engagement and to promote reflections that improve the quality of teaching and learning practice.
We considered two approaches to engagement analytics: one is to use a predefined framework and the other is data-driven modeling. There exist at least three major limitations of the first approach, which we have discussed extensively in this paper, First, while working over big data, it is easy to find statistically significant patterns, however many of them are educationally meaningless (Shaffer, 2017). Second, student engagement is a complex concept, composed of several elements discussed in the paper, which are difficult to include in a predefined framework given that most trace data focus solely on behavioral engagement. Third, trace data record students’ quantitative behavior in the VLEs and rarely addresses the qualitative side of behavioral engagement. As discussed here, current studies have shown shortcomings in addressing pedagogical reflection and classroom practice. For these reasons data-driven modeling could reveal more robust evidence in pedagogical practices as it avoids an improper predefined framework which can lead to misleading interpretations. Moreover, data-driven modeling of engagement analytics has the potential to promote reflections supporting teaching and learning quality.
Our pilot study attempted to support the rationale above by providing two visualizations. Fig. 1 shows the possibility of detecting at-risk students in the early phase of the course when the teacher adopts a data-driven approach of visualization on individual student. However, it is difficult for the teacher to check individual students in the large class setting. Thus, we introduced a data-driven modeling method (GBTM), a statistical method that can identify the distinct trajectories or patterns of change that exist within a population. Therefore, the teacher can understand several patterns of student engagement and who belongs to which patterns in the course. It will trigger a continuous improvement of tailored student support and design for learning activities.
Another contribution of this paper is highlighted in the adoption of the Group-Based Trajectory Modeling to analyze student engagement, as we are one of the first users to implement this method most commonly used in the clinical and medicinal fields in educational studies.
As for the study limitations, it is possible that there are ongoing studies being carried out which address different claims and perspectives related to the importance of data-driven modelling for student engagement that we fail to explore. Moreover, the study focuses on testing a theoretical idea about what approach is suitable for engagement analytics and proposes two ways to explore student engagement rather than an empirical study that could be directly
generalized for others to adopt.
In terms of future research, interdisciplinary teams of educational researchers and computer scientists should collaborate on engagement analytics. The algorithms dealing with Big Data are conceptual and need to be carefully discussed and refined through the lens of these two disciplines (education and computer science), to make sure that big data insights promote the improvement of educational practice.
Acknowledgements
1. We would like to sincerely thank Derek Clougher (The Open University of Catalonia) as English proofreader.
2. Funding:
• This study is partially funded by the Interdisciplinary Laboratory for the Quality and Innovation of Didactics (LIQuID) of the University of Trento, as part of the 2017-2021 University Strategic Plan.
• This study is a phased result of “Evaluating the Quality of MOOCs in the Era of Big Data” (No. CCHA17146) funded by Beijing Office for Educational Sciences Planning.
REFERENCES
Al-Shabandar, R., Hussain, A. J., Liatsis, P., & Keight, R. (2018). Analyzing Learners Behavior in MOOCs: An Examination of Performance and Motivation Using a Data-Driven Approach. IEEE Access, 6, 73669-73685.
Arlot, S., & Celisse, A. (2010). A survey of cross-validation procedures for model selection. Statistics surveys, 4, 40-79.
Blikstein, P., Worsley, M., & Worsley, M. (2016). Multimodal Learning Analytics and Education Data Mining: Using Computational Technologies to Measure Complex Learning Tasks. Journal of Learning Analytics, 3(2), 220–238.
Blumenstein, M., Liu, D. Y., Richards, D., Leichtweis, S., & Stephens, J. (2018). Data-informed nudges for student engagement and success. PsyArXiv. March, 27. https:// doi.org/https://doi.org/10.31234/osf.io/qjmpn
Burnham, K. P., & Anderson, D. R. (2004). Multimodel inference: understanding AIC and BIC in model selection. Sociological methods & research, 33(2), 261-304. Charmaz, K. (2014). Constructing grounded theory. Sage.
Chickering, A. W., & Gamson, Z. F. (1987). Seven principles for good practice in undergraduate education. AAHE bulletin (Mar), 3-7.
challenges. British Journal of Educational Technology, 46(5), 904–920. https:// doi.org/10.1111/bjet.12230
De Winter, J. C. (2013). Using the Student’s t-test with extremely small sample sizes. Practical Assessment, Research & Evaluation, 18(10),1-10.
Dunleavy, J., & Milton, P. (2008). Student engagement for effective teaching and deep learning. Education Canada, 48(5), 4-8.
Ferguson, R. The state of learning analytics in 2012: A review and future challenges [M]. Technical Report KMI-12-01, Knowledge Media Institute, The Open University, 2012.
Ferguson, R., Barzilai, S., Ben-Zvi, D., Chinn, C. A., Herodotou, C., Hod, Y.,... & Rienties, B. (2017). Innovating Pedagogy 2017: Exploring new forms of teaching, learning and assessment, to guide educators and policy makers. Open University innovation Report 6. Retrieved from www.open.ac.uk/innovating
Fredricks, J. A., Blumenfeld, P. C., & Paris, A. H. (2004). School engagement: Potential of the concept, state of the evidence. Review of educational research, 74(1), 59-109. Fisher, M. J., & Marshall, A. P. (2009). Understanding descriptive statistics. Australian
Critical Care, 22(2), 93-97.
Ghislandi, P. (2005). Didattiche per l’università (Vol. 1). Università degli Studi di Trento. Dipartimento di Scienze della Cognizione e della Formazione.
Ghislandi, P., & Raffaghelli, J. (2015). Forward-oriented designing for learning as a means to achieve educational quality. British Journal of Educational Technology, 46(2), 280-299.Gibbs, G. (2010). Dimensions of quality. York: Higher Education Academy. Retrieved from http://support.webb.uu.se/digitalAssets/91/a_91639-f_ Dimensions-of-Quality.pdf
Goleman, D. (1984). Rethinking I.Q. Tests and Their Value. The New York Times. Retrieved from https://www.nytimes.com/1984/07/22/weekinreview/rethinking-iq-tests-and-their-value.html
Gombrich, E. H. (1973). Research in the humanities: Ideals and idols. Daedalus, 1-10. Hung, J. L., Hsu, Y. C., & Rice, K. (2012). Integrating data mining in program
evaluation of K-12 online education. Journal of Educational Technology & Society, 15(3), 27-41.
Hussain, M., Zhu, W., Zhang, W., & Abidi, S. M. R. (2018). Student Engagement Predictions in an e-Learning System and Their Impact on Student Course Assessment Scores. Computational intelligence and neuroscience, 2018.
Jo, Y., Maki, K., & Tomar, G. (2018). Time Series Analysis of Clickstream Logs from Online Courses. arXiv preprint arXiv:1809.04177.
Kahu, E. R. (2013). Framing student engagement in higher education. Studies in higher education, 38(5), 758-773.
Kennedy, W. J., & Bancroft, T. A. (1971). Model building for prediction in regression based upon repeated significance tests. The Annals of Mathematical Statistics, 42(4), 1273-1284.
Kim, Y., Soyata, T., & Behnagh, R. F. (2018). Towards emotionally aware AI smart classroom: Current issues and directions for engineering and education. IEEE
Access, 6, 5308-5331.
Kuh, G. (2004). The national survey of student engagement: Conceptual framework and overview of psychometric properties. Retrieved from http://nsse.iub.edu/2004_ annual_report/pdf/2004_conceptual_framework.pdf
Li, T., & Yang, N. (2018 June). Comparing MOOCs with Traditional Courses for Quality Teaching in Higher Education. In Proceedings of the 2nd International Conference on Modern Education and Information Technology, Xiamen, China (pp.122-127). Lancaster, PA: DEStech Publications.Liu, F., & Cavanaugh, C. (2012). Factors influencing student academic performance in online high school algebra. Open Learning: The Journal of Open, Distance and e-Learning, 27(2), 149-167.
Liu, D., Richards, D., Froissard, C., & Atif, A. (2015). Validating the effectiveness of the moodle engagement analytics plugin to predict student academic performance. In 21st Americas Conference on Information Systems, AMCIS 2015 (pp. 1-10). Americas Conference on Information Systems.
Mohammed, M. A., Moles, R. J., & Chen, T. F. (2016). Meta-synthesis of qualitative research: the challenges and opportunities. International journal of clinical pharmacy, 38(3), 695-704.
Nagin, D. S. (2005). Group-based modeling of development. Harvard University Press. National Survey of Student Engagement. (2018). NSSE 2018 overview. Bloomington, IN: Indiana University Center for Postsecondary Research. Retrieved from http://nsse.
indiana.edu/html/Nsse_overview_2018.cfm
O’Neil, C. (2017). Armi di distruzione matematica. Giunti.
Okubo, F., Yamashita, T., Shimada, A., & Ogata, H. (2017, March). A neural network approach for students’ performance prediction. In In Proceedings of the third international conference on learning analytics and knowledge (pp. 598-599). ACM. Prinsloo, P., & Slade, S. (2017). An elephant in the learning analytics room. In
Proceedings of the Seventh International Learning Analytics & Knowledge Conference on - LAK ’17 (pp. 46–55). New York, New York, USA: ACM Press. https://doi.org/10.1145/3027385.3027406.
Ramesh, A., Goldwasser, D., Huang, B., Daume, H., & Getoor, L. (2014). Uncovering Hidden Engagement Patterns for Predicting Learner Performance in MOOCs. In L@S 2014. Atlanta, Georgia, USA: ACM. https://doi.org/http://dx.doi. org/10.1145/2556325.2567857
Richards, G. (2011). Measuring Engagement: Learning Analytics in Online Learning. Retrieved from https://www.academia.edu/779650/Measuring_Engagement_ Learning_Analytics_in_Online_Learning
Shaffer, D. W. (2017). Quantitative Ethnography. Madison, Wisconsin: Cathcart Press Shute, V. J. (2008). Focus on formative feedback. Review of educational research,
78(1), 153-189.
Snow, R. E. (1980). Aptitude, learner control, and adaptive instruction. Educational Psychologist, 15(3), 151-158.
approaches and experiences. In Practical hydroinformatics (pp. 17-30). Springer, Berlin, Heidelberg.
Urdan, T., & Midgley, C. (2001). Academic self-handicapping: What we know, what more there is to learn. Educational Psychology Review, 13(2), 115-138.
Viberg, O., Hatakka, M., Bälter, O., & Mavroudi, A. (2018, December 1). The current landscape of learning analytics in higher education. Computers in Human Behavior. Pergamon. https://doi.org/10.1016/j.chb.2018.07.027
Vytasek, J. M., Patzak, A., & Winne, P. H. (2020). Analytics for Student Engagement. In Virou, M., Alepis, E., Tsihrintzis, G. A., Jain, L. C. (eds.) Machine Learning Paradigms (pp. 23-48). Switzerland: Springer Nature.
Wen, M., Yang, D., & Rosé, C. P. (2014, May). Linguistic reflections of student engagement in massive open online courses. In Eighth International AAAI Conference on Weblogs and Social Media.
Wolff, A., Zdrahal, Z., Nikolov, A., & Pantucek, M. (2013, April). Improving retention: predicting at-risk students by analysing clicking behaviour in a virtual learning environment. In Proceedings of the third international conference on learning analytics and knowledge (pp. 145-149). ACM.
Yang, N., Ghislandi, P., & Dellantonio, S. (2018). Online collaboration in a large university class supports quality teaching. Educational Technology Research and Development, 66(3), 671-691.
Ye, C., & Biswas, G. (2014). Early prediction of student dropout and performance in MOOCs using higher granularity temporal information. Journal of Learning Analytics, 1(3), 169-172.