EVALUATION OF AN ADAPTIVE LEARNING TECHNOLOGY AS A PREDICTOR OF STUDENT PERFORMANCE IN UNDERGRADUATE BIOLOGY
A Thesis by
LAUREN ALEXANDRA JAMES
Submitted to the Graduate School Appalachian State University
in partial fulfillment of the requirement for the degree of MASTER OF SCIENCE
May 2012 Department of Biology
EVALUATION OF AN ADAPTIVE LEARNING TECHNOLOGY AS A PREDICTOR OF STUDENT PERFORMANCE IN UNDERGRADUATE BIOLOGY
A Thesis by
LAUREN ALEXANDRA JAMES May 2012
APPROVED BY:
__________________________________________ Michael Windelspecht
Co-Chairperson, Thesis Committee
___________________________________________ Jennifer Geib
Co-Chairperson, Thesis Committee
___________________________________________ Ted Zerucha
Member, Thesis Committee
___________________________________________ Steven Seagle
Chairperson, Department of Biology
___________________________________________ Edelma D. Huntley
Copyright by Lauren Alexandra James 2012 All Rights Reserved
iv ABSTRACT
EVALUATION OF AN ADAPTIVE LEARNING TECHNOLOGY AS A PREDICTOR OF STUDENT PERFORMANCE IN UNDERGRADUATE BIOLOGY
Lauren Alexandra James, B.A., Appalachian State University M.S., Appalachian State University
Co-chairpersons: Michael Windelspecht; Jennifer Geib
With increased use of educational technologies comes the need to not only evaluate whether or not these technologies are effective, but also how instructors can utilize these technologies to adapt teaching practices for maximized student performance on formal assessments. This study examines four specific aspects (time, completion, metacognitive data, and a program-generated student score) of LearnSmart, an adaptive learning technology developed by McGraw-Hill Higher Education, and the potential effects these aspects might have on student assessment performance. With a focus on data from a module on cellular respiration, this study examines relationships between LearnSmart use and student quiz and exam scores. The results indicate statistically significant relationships when the module student score, module completion, total time spent on all LearnSmart™ exercises, and total average percent completion are used as predictors for exam score. Though other trends existed, most LearnSmart™ data is not a statistically significant predictor of assessment performance on a group level (p< 0.05). Overall, however, all LearnSmart™ data can provide a very useful tool for student self-reflection and for one-on-one interactions between instructor and student, including advising. Finally, in conjunction with data gathered from an optional LearnSmart™ student usage survey, and experience teaching and learning with LearnSmart™, the study concludes with best practices for instructors with regard to adaptive learning technology.
v
TABLE OF CONTENTS
Abstract ... iv
Acknowledgements ... vi
Introduction ... 1
Materials and Methods ... 20
Results ... 26 Discussion ... 53 References ... 68 Appendix A ... 70 Appendix B... 72 Vita ... 83
vi
ACKNOWLEDGEMENTS
First, I would like to thank the Cratis D. Williams Graduate School, particularly the faculty and my peers in the Biology Department. I would also like to thank my advisor and committee co-chair, Dr. Michael Windelspecht, for his constant encouragement, without which I probably would not have returned to Appalachian in pursuit of my graduate degree. Michael has been supportive in my educational, professional, and personal life since I was an undergraduate at Appalachian. I attribute much of my success to his assistance. I would like to thank committee co-chair Dr. Jenni Geib and committee member Dr. Ted Zerucha, for their endless patience, flexibility, and advice. Thank you all for taking a journey on a bit of a different thesis project for the sciences. In addition, I would like to thank Dr. Jim Barbee for his assistance, particularly for being patient and flexible as well.
I would also like to thank my colleagues at McGraw-Hill Higher Education for the
opportunities they have provided me, for allowing me to use their adaptive learning platform as the subject of my research, and for being professionally and personally supportive of me throughout the development and execution of my thesis research.
I would like to extend a special thank you to my family, my friends, my employers and co-workers, and especially to Rob Tallant for being supportive and tolerant of my near-constant pre-occupation with my computer and my work.
1
INTRODUCTION
The ultimate goal of education is to facilitate the learning process. From young children to students of higher education, effective instruction is the basis of quality learning. Unfortunately, in our current environment, education is struggling at all levels to provide truly effective instruction, resulting in poor student performance, low student retention, and an overall dissatisfaction with the education system. In response, a nearly constant effort has been devoted to reforming, and thus improving, education. At the classroom level, these efforts focus primarily upon instructional tools and strategies that aim to enhance student engagement and increase student performance. However, despite continuous efforts made to make instruction more effective, classrooms become increasingly crowded and instructor workloads grow to match.
The major challenge that results from rapidly increasing class size is a lack of personalized instruction, which is a problem considering that individualized instruction is associated with the highest levels of student performance. Proponents for individualized instruction include Benjamin Bloom, well-known for his educational theories and Bloom’s Taxonomy, who reported in a 1984 study that one-on-one instruction improves student achievement by two standard deviations over group instruction (Bloom, 1984; Kidd, 2010; Vandewaetere et al., 2011). Though the challenges are many and are not necessarily specific to subject matter, the focus herein will be on the
individualization of instruction in the undergraduate biology classroom.
Universities and colleges alike are seeing poor student performance while also losing students from the sciences, both as non-majors and intended majors. The reasons for this are undoubtedly numerous, but the solutions are simple, in theory: good teaching results from personalized, one-on-one interaction between an instructor and a student. The challenge in achieving good teaching, especially on college campuses, lies in the variation in science background among college students, the increasing number of students per course section, the short time an instructor has to get to know his students, the near impossibility of tailoring a course to each individual’s needs, and the high
2
probability that a poor first-semester introductory biology experience will discourage a student from continuing in the sciences (Paramythis & Loidl-Resiinger, 2003).
In many cases, these challenges are simply ignored. For example, sometimes instructors do not attempt to tailor a course at all, instead continuing to teach the same material in the same manner as they did not only the previous semester, but every semester before. In other cases, standardization of course content suffers: At institutions with multiple instructors, a failure to establish a
standardized curriculum, which addresses the same set of specific learning outcomes, often results in a lack of consistency between courses, frequently leaving some students less prepared than others to progress to higher level science courses (Cheeseman et al., 2007). Still, another challenge exists in addressing the ever-increasing volume of content in an introductory biology course (Cheeseman et al., 2007; O'Toole & Schefter, 2008; Windelspecht, 2001).
Frequently, when an instructor does attempt to address these educational challenges, a diagnostic exam might be administered. Subsequently, the instructor would attempt to tailor the course content, focusing on areas of weakness and de-emphasizing or skipping areas that have been mastered by most of the group, based upon the diagnostic results. The potential issues with this method include the design and execution of the exam itself, and the level of student investment in the exercise. Under circumstances with poorly designed or administered exams, and/or low student investment in the diagnostic, the exam (usually an in-class ungraded assessment) can be a waste of class time, and may fail to effectively portray a student’s background knowledge and areas of strength and weakness. Thus, sometimes even when an effort is made to make student-centered teaching adjustments, the challenges can remain in most classrooms.
As the volume of content to disperse and the student enrollment grow, other important changes are taking place in education. Established instructional standards are constantly being evaluated and changed, many coming to include digital learning tools. As education becomes geared more towards digital learning, the fields of education and technology find themselves coming
3
promising, and it is in demand, though it brings with it a unique set of challenges. It requires instructors to rethink in-class and online teaching methods, and to decide how they will go about engaging the online student (Salazar, 2010; Windelspecht, 2001). However, because current in-class instructional approaches are unable to deliver the appropriate level of individualized learning (differentiation), integration of technology seems the best candidate for providing the ideal of
personalized learning. Technology can offer educational experiences tailored to student “needs, goals, talent and interests” (Klasnja-Milicevic et al., 2011). And, in conjunction with the added option to deliver coursework partially or entirely online, the burden of a specified time and place for learning is also being eliminated. Though its official definition varies, the concept of computer-assisted
personalized learning is termed adaptive learning, or adaptive learning technology. Development of Adaptive Learning Technology
Like any good teaching tool, adaptive learning technology (ALT) has been developed with the characteristics of its audience in mind. Thus, effective virtual learning technology has been created based on what we know about real learners and learning. Multiple adaptive learning platforms have been designed based on premises of how learning happens. Though many learning theories exist, none is especially formulated to support learning through ALT (Pange & Pange, 2011). The underlying premises about learners and learning upon which adaptive technologies are based include cognitive development, knowledge construction, and theories of knowledge representation.
Cognitive Development. The Swiss psychologist Jean Piaget is perhaps the best-known investigator of cognitive development. As a result of his studies of young children, Piaget came to many conclusions surrounding the stages of thinking ability that progress from infancy to adulthood (Byrnes, 2007). Piaget studied language, thinking, perception, attention, and memory, and examined the integration of these functions for learning and problem solving, or cognitive processes. Cognitive development, a change in these functions and processes over time, became a widely studied
4
In his third edition of “Cognitive Development and Learning in Instructional Contexts”, James P. Byrnes (2007) explores six theories of cognitive development and learning. Through the ideas of Edward Thorndike, information processing theorists, connectionists, Jean Piaget, schema theorists and Lev Vygotsky, the text explains that despite the existence of multiple theories, a few overarching themes surround cognitive development and learning. These themes include: 1) repetition and practice; 2) meaningful, goal-directed learning; and 3) the role a student’s previous experiences and knowledge play in their learning style.
Practice. Repetition and practice are thought to serve to strengthen or modify associative bonds formed during learning, aiding in the internalization of skills and formation of meaningful abstractions (Byrnes, 2007). Practice is an important aspect that must be built into any ALT. Virtual flashcards and other repetitive practice exercises are used to provide practice in ALT. These exercises might cover anything from important vocabulary to concepts central to the chapter or unit of study, and frequently utilize fill-in-the blank and/or matching formats.
Meaningful, Goal-Directed Learning. As students are learning new material, partly through repetition and practice, they must integrate their new knowledge into their current knowledge, since the learning process is more successful when it is meaningful to the student. Meaning can be built into learning when the interests of the student are considered and included in scenarios or other examples used for instruction.
In attempts to achieve meaningful, goal-directed learning using ALT, many platforms include some form of a “learning plan”. This plan may be based upon a diagnostic exercise, or could be an established lesson set up by an instructor. The purpose of the learning plan is to provide the student with a visual representation of where they will start and end, and what steps they will take in their learning. It might also provide built-in deadlines or other time-related goals.
Learning Style. A plethora of teaching strategies exist, in part because different students learn in different ways. Examples of learning styles are visual, auditory, and hands-on (also termed tactile or kinetic). That is to say, some people learn primarily from what they see, some from what
5
they hear, and others from what they do. In most cases, learners use one or more of these styles to learn best. ALT addresses different types of learners by incorporating a mixture of visual, auditory and virtually tactile activities. The visual element might incorporate anything from text formatting to figures, videos, tutorials, or other art used to teach. An auditory element can be included in ALT through spoken definitions of vocabulary words, videos, or other animations with recorded
information. To incorporate elements useful for tactile learning, figures and other art can be designed such that the learner can manipulate their parts. This could include physically clicking and dragging words to fill in blanks or match definitions, moving events in a process into a logical sequence, or building a structure from its subsequent parts. Potentially, virtual labs may also meet the needs of tactile learners by allowing them to virtually carry out any activity one might perform in a lab (dissection, mixing chemicals, etc.).
Learning style must be considered when designing instruction. With regard to learning, Byrnes (2007) defines cognitive development as an increase in cognitive ability with age. The acquisition of knowledge, thus, happens slowly over time. And because learners slowly change as they get older, instruction must also change, resulting in different teaching techniques at different grade levels. Even within grade levels, however, all learners do not change in the same ways at the same time. Thus, there is not a single instructional technique that works well for all students. Cognitive development creates a need for a multitude of instructional techniques within and among grade levels. The instructional approach used in an attempt to meet the cognitive, and motivational, needs of individual learners is termed differentiated instruction. Differentiation in instruction requires a functional understanding of the learner, to include educational experience or background and current levels of understanding, along with where the learner is headed.
Essentially, if an instructor knows what a student already knows and can do, and what they would like the student to know and be able to do by the end of a given instructional period, the next steps in the learning process can be tailored to be appropriately challenging. Instruction at the appropriate level or rigor prevents wasting instructional time on material that is below or above a
6
student’s ability level, which subsequently helps to keep the learner engaged. In experimenting with different designs for ALT, building in the ideas of learning style and automatically differentiated instruction has been an important goal.
Knowledge Construction: Constructivism. The constructive nature of learning, emphasized by Jean Piaget, schema theorists, and Lev Vygotsky, is based upon how a learner constructs
knowledge (Byrnes, 2007). Constructivism denies that knowledge can exist outside a person and simply be transferred to them, as an objectivist, or a traditional lecture-giving instructor, might believe. Instead, constructivist theory describes how learners interpret reality and instruction (Byrnes, 2007). In this way, constructivism incorporates some of the ideas previously discussed with regard to meaningful learning. Piaget described processes, called accommodation and assimilation, through which individuals incorporate new experiences into an existing mental framework. As defined by Piaget, accommodation occurs when an individual must reframe their current understanding of the world to incorporate new ideas and experiences, whereas assimilation takes place when new ideas and experiences fit into an individual’s existing framework, or when an individual fails to make changes to an existing, faulty, understanding. Because accommodation involves reevaluation of current understanding, it is thought to be one of the mechanisms by which failure leads to learning (Polycarpou & Vemuri, 1995).
As such, constructivism is often associated with active learning, or learning by doing. The role of an instructor in active learning is that of a facilitator instead of a traditional instructor
(Bauersfeld, 1995). Instead of lecture, or other forms of instruction that involve a teacher “imparting knowledge”, a facilitator asks questions and supports the learning process from the sidelines.
In his study of web-based learning, Zangyuan Own (2010) reports on a similar study
conducted by F. Lin (2001), explaining that Lin’s study (published only in Chinese) investigated web-based learning using the constructivist approach, finding that achievement was higher for college students in the sciences when compared with other students. The adaptive learning platforms explored in Lin’s investigation, and others described as background in Own’s 2010 study, use ALTs that
7
change the learning process based upon a course’s relevance to a student’s field. “Story-telling” teaching is used for field-dependent courses, employing simulations and other tactics to help students learn by doing (Own, 2010).
Essentially, ALT that incorporates virtual forms of hands on activities, or situational learning that allows students to make choices that may lead them down one of several paths during the
learning experience, are examples of constructivism in ALT. Virtual labs are examples of “hands on” activities. Situational learning might include virtual Emergency Medical Technician (EMT) training that provides hypothetical emergencies for student practice; the activity might include hypothetical patient descriptions, vital signs and symptoms, or other details that the student must evaluate and respond to. Depending on the response, the activity would adapt. For instance, if the student makes correct evaluations and chooses appropriate “treatments”, the patient would “live”; if the student makes incorrect evaluations, the patient would “die”. Constructivism in ALT can be very useful since it serves to put learning into context, to make learning a structured discovery process, and to engage and challenge the learner.
Knowledge Representation. Knowledge representation (KR) is an area of artificial intelligence (AI) research that explores the challenges of accurate and effective use of symbols to represent facts in a knowledge domain (Thomson, 2005; Martin, 2002). Knowledge is the term given to our mental representations of the world (Wilson & Keil, 2006). Outside the mind, this knowledge is represented physically through symbols, or meaningful patterns that can be manipulated. In creating ALT, thought is given to the roots of AI and intelligent tutoring systems (ITS), which first took on the challenges of representing knowledge with computers, based upon existing theories surrounding KR. These theories find their foundation in cognitive psychology and neuroscience, and include ideas like concepts and categories, semantic networks, and consideration for how information is stored and handled in the brain (Poole & Mackworth, 2010).
8
Organization is a key concept in KR. Concepts and categories, which help the human brain store information in an organized manner, include mental representations like memory and groupings of similar ideas. Just like they do in the human brain, concepts and categories help computers to more efficiently navigate the environment. Thus, in representing knowledge with computers, organization that mimics that of the brain is important. By creating categories of knowledge, the computer
becomes “informed” and more capable of intelligent action. The challenges of training the computer, however, are clear if we consider the way the human mind forms generalized definitions when forming categories.
An example explored by Poole and Mackworth (2010) surrounds the category of “cars”. The human brain does not define cars as all objects that run on gasoline, or all objects with four wheels, though these definitions do describe many members of this category. Instead, we have a generalized definition of “cars” from our experience that allows us to include more members in the category. It is due to categories, at least in part, that we recognize an object we’ve never seen before. Otherwise, every car we saw that was not of the same make, model, color, (etc) would appear unique. Thus, though we can attempt to include all examples that fit into a category into a group for a computer to use as a resource, that computer will usually end up with a more limited category than the human brain.
The human brain goes a step further in organizing information. It is theorized that the brain structures categories in a hierarchy while also creating relationships between the categories. In this manner, all-encompassing larger categories can be split into smaller, more detail-oriented categories. These levels differ based upon criteria like expertise and culture, since an expert more closely examines the details of items in their field than a non-expert might. The “basic” level in a given area of interest is lower for an expert than for a layperson. The relationships we create are explained by the semantic network approach, which proposes that concepts of the mind are arranged in networks, or that we create meaningful connections between categories to create a functional storage system (Poole & Mackworth, 2010).
9
The human brain serves as an inspiration for computer science and development of computational systems, a process called knowledge engineering. In representing knowledge on computers, some think it best to represent it in the same way that it is represented in the mind, using human language. However, artificial languages and notations, based on logic and mathematics, have also been proposed. Many current adaptive learning platforms are built to represent knowledge in plain human language though they are built on websites that are coded. Despite the language, the challenge of KR is primarily how to store and manipulate knowledge in an information system in a formal way such that it may be used to accomplish a given task. This, of course, would be the goal of KR in ALT: using representations of knowledge in the pursuit of learning tasks which, in turn, might lead to new knowledge to be represented (Martin, 2002).
In designing ALT, one important goal is to create reusable learning objects; the more context-specific a learning object is, the less reusable it becomes. This is important when considering how specifically to symbolically represent knowledge with computers. Certain subject matter, for example a major subject at a high level, is better-suited to be designed such that KR is highly precise and detailed, while more general subject matter can use KR at a more generalized level. For example, take the visual symbols that might be used to represent a car: a car might be represented as a simple symbol if the structure of the car is not important to the subject matter. However, if the ALT is teaching mechanics, the details of the car are of much more importance. This same idea can be carried over to simpler symbols, like words and sentences. The levels of vocabulary and sentence structure built into a computer’s KR are important aspects, which should be adjustable, when designing ALT.
Another example of KR in ALT comes back to the idea of semantic networks, and the organization of categories based on relationships between them. This idea can be applied to functions such as facilitating learner-created concept maps. Network-based KR can also assist in developing learning through many connections between knowledge, rather than a student reaching a solution only through single, linear methods. This network design might be employed, for example, in a
10
constructivist (active learning) activity that gives students many possible paths from original question(s) to solution(s).
Designing ALT has been, and will continue to be, a challenging field that necessitates an understanding of technology, education, and ideas from a wide range of subject matter from cognitive psychology to neuroscience. The ultimate goal, however, remains; ALT seeks to virtually produce what can best be accomplished by one-on-one tutoring: personal, individualized instruction that takes the learner into account at every level. As such, the development of ALT has incorporated many of the underlying premises about learners and learning, including cognitive development,
constructivism, and knowledge representation. With continued efforts to consider the needs of the learner, goals of high levels of achievement and constant reevaluation of current technology, ALT can continue to grow. This growth must rely in large part on best practices learned from classroom
instruction, specifically that which incorporates ALT, as instructors discover what is most effective in practice for positively influencing student outcomes. The better instructors can come to understand how adaptive learning is influencing student learning, the more effectively they can fully exploit adaptive learning resources and technologies.
Defining Adaptive Learning Today
The literature currently defines adaptive learning in a variety of ways. Some definitions do not include the technological aspect at all, calling adaptive learning “the use of what is known about learners…through interactions, to alter how a learning experience unfolds” (Howard et al., 2006). Most definitions, however, have come to incorporate the role of technology in the alteration of the learning experience (Vandewaetere et al., 2011). Despite its definition, the goal of adaptive learning is consistently expressed throughout the literature: be more responsive to learners as individuals (Howard et al., 2006).
In defining adaptive learning, the literature also presents the necessity of understanding blended learning, which has essentially coevolved with technology in the classroom. Blended learning, as defined by the distance learning community, acknowledges the complementary nature of
11
synchronous (in class) learning activities combined with asynchronous (outside of class) learning activities. As of late, blended learning refers to the combination of in class lecture and other activities combined with online activities. Courses that are taught partially online and partially via face-to-face lecture are, thus, blended learning courses. This type of course, which is growing increasingly common (Wu et al., 2010), is also referred to as a “hybrid” course. This type of course is the focus of the research presented in this thesis.
Examples of adaptive learning also cover a wide range and can include anything from an alteration in text size and color, to the incorporation of an audio dictionary, to the alteration of the actual content of learning materials, depending on the needs of the learner (Howard et al., 2006). These needs can be determined automatically as information is being gathered about the learner, to include characteristics like prior knowledge, learning style, and cognitive style. This may occur through surveys, pre-tests, and sample practice exercises. Later, a learner “profile” can be applied to future assignments. An adaptive learning system can be exclusively controlled by the instructor, share control between the student and the instructor, or take on an “open learner model” that allows for self-assessment by making the learner profile explicit to the learner. In the latter, the student may even alter their profile if they think it inaccurately represents one or more of his learning
characteristics.
The instructor can alter aspects like whether or not questions incorporate hints, include instructor feedback for incorrect (or all) responses, offer remediation/review instructions for incorrect responses, or include or exclude time limits, for example. Using instructor modifications, an
instructor can build scaffolding into an online activity by organizing exercises such that they progress from “easy” to “difficult”, whilst incorporating fewer support settings like hints and delivering more challenging content. Students can alter things like volume levels, text size and color, or add their own (personally perceived) learning characteristics if the system has not included them in the learner profile (Vandewaetere et al., 2011). Student controlled systems, however, must avoid becoming pools of questions organized by topic or chapter. This is because, in systems that operate in this manner,
12
students often select exercises that are too simple or too complicated and they either become disengaged due to boredom or discouragement. A student-controlled system should aim to allow a level of student control that also provides optimal student learning.
Based on learner profiles, for instance, a large pool of questions could be automatically filtered to suit the level of the learner. The student is still able to exert control by selecting an exercise out of a pool, but the pool only includes questions at the appropriate level for the learner (Hsiao et al., 2010). Programs that operate in this manner can ensure that lower level students focus on remediation and introductory exercise, while higher-level students progress through exercises to demonstrate their understanding of and ability to apply a concept (Own, 2010).
The benefits of incorporating technology into the classroom are plentiful. The use of this technology to facilitate adaptive learning magnifies its benefits. Some classroom technology is capable of providing an adaptive learning experience within the online learning environment by altering the pace of instruction, the level of materials assigned, and the types of questions asked, for example. The results of student interaction with the technology, in the form of quiz scores or individual item success rates, for instance, can then be used by instructors to further adapt the learning environment in the physical classroom.
Online learning can provide immediate correction and/or feedback to students when working on homework or other out of class activities, which has been shown to be beneficial to the learning process (Howard et al., 2006; Own, 2010). It also prevents students from spending too much time on an inappropriate level of material outside of class, while allowing an instructor to tailor lectures to the demonstrated specific needs of a specific group or groups of students.
Because of built-in scaffolding, students and instructors can examine the results of the student interaction with the online material to see where learning breaks down. As a result, a student can be made aware of topics to focus on in studying on their own, and when instructors are able to help students one-on-one, during office hours for instance, they have an online record that provides them a working knowledge of what a student did not understand or perform well on. The research presented
13
here has its foundations in the adaptations that teachers and students can make in the learning process based on the tools available.
Adaptive Learning in Practice
The current literature offers, if only a few, applications of adaptive learning in practice in the form of case studies. Two of the strongest examples are summarized herein.
At the University of Taiwan, Zngyuan Own conducted a study of online exercises versus adaptive online exercises on oxidation and reduction reactions (Own, 2010). The authors sought to design and create an adaptive learning environment, gather quantitative evidence to compare the adaptive to the traditional web-based learning environment (with regards to a unit in life chemistry), correlate results with learning profile characteristics, and examine student satisfaction with the learning environment.
By examining two types of online learning environments, the study found that adaptive online learning outperforms non-adaptive online learning, that higher level students enjoy greater achievements in adaptive online learning, that male performance exceeds that of females, that science departments perform better than other departments, and that students who study longer in adaptive online learning environments have greater achievements.
Own’s study draws attention to the need to fully exploit the characteristics of a learning medium to get the best results. In other words, adopting any web-based learning system and not using it correctly will not benefit the instructor or students. It encourages instructors to actually use the results of the medium to adapt their teaching habits.
In a project that looks at improving undergraduate biology courses by making them hybrid courses, Riffell and Sibley compare their hybrid course to a simultaneously offered traditional course (Riffell & Sibley, 2005). The study makes suggestions to identify the students that are best-suited for online learning, based on the results of multiple regression analyses of the relationship between a number of predictor variables (gender, freshman-senior status, major/non-major, commuter status, attendance, and experience with online courses) and student performance on a course post-test. Based
14
on these results, the authors recommended hybrid learning to upper classmen seeking general science credit. The results find the hybrid course to be superior (by a letter grade, or 10% higher performance on the course post-test). It states that the best-suited student is the on-campus (residing on or near campus), non-majors upperclassmen. They also find that online assignments are equally if not more effective than classroom assignments, and that classroom-based exercises are more effective when coupled with online assignments.
Though the concept of adaptive learning is still relatively new, the literature is lacking in several ways. The majority seeks to define, redefine, or add to the definition of the term itself. Firm definitions of terms, including the term adaptive learning, are missing, as are standards for the implementation of adaptive learning technology. The largest gap in the literature is in the lack of publications regarding the application of adaptive learning strategies to a specific field of study or a specific course, or examining the application of adaptive learning to specific instructional units or learning outcomes. Thus, colleges and universities have very little empirical data on the differences in student outcomes in traditional, hybrid, and online courses.
Development of the Study
LearnSmart is an ALT platform created by Area9, and currently licensed to McGraw-Hill Higher Education (MHHE). The LearnSmart platform in embedded with MHHE’s Connect platform, a next-generation content management system.
The premise behind the LearnSmart system is relatively simple. Almost all textbooks in higher education contain learning outcomes (or objectives) that define the core content knowledge that is expected of the student after completing a specific amount of material. LearnSmart expands on these learning outcomes through the use of “probes”, which break the learning outcomes down into individual pieces of information a student must understand. For instance, a learning outcome for cellular respiration might read “Identify the inputs and outputs of cellular respiration.” Probes for this learning outcome might include questions such as:
15 • What are the inputs and outputs of glycolysis?
• What are the inputs and outputs of the citric acid cycle?, or • What are the inputs and outputs of the electron transport chain?
Whereas a single section in a non-majors introductory biology text may have 2-3 learning outcomes, the same section may possess dozens of specific probes. Each probe is, in turn, tied to a series of questions. The questions are tagged on a scale of 1-4, with category 1 representing
important core knowledge and category 4 representing application-based or less-critical information. A category 1 probe for cellular respiration might read: “Identify the location of glycolysis”, while a level 4 probe might be something like “What happens if no oxygen is available for cellular
respiration?”.
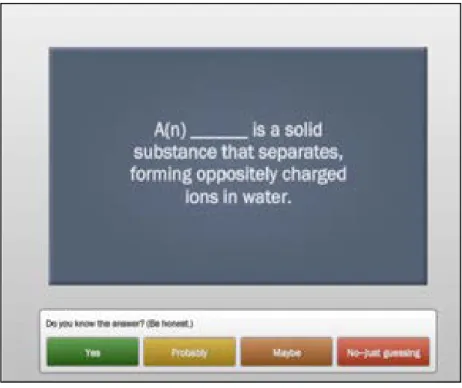
Figure 1 demonstrates a typical question within LearnSmart. The key to LearnSmart is integrated into student self-assessment of their knowledge of the content. This assessment is performed using the four buttons directly under the card, which the student must respond to prior to attempting the question.
Figure 1. Screen shot of a typical LearnSmart question. The student must select a response to “Do you know the answer? (Be honest.)” before attempting to answer the question.
16
The student responses dictate the learning path through the material. For example, if a student answers a question correctly there are two possibilities: 1) the student knew the content, or 2) the student guessed correctly. Likewise, an incorrect response may be associated with a misunderstanding of the wording associated with the question, and not the subject content directly.
The artificial intelligence within LearnSmart recognizes these possibilities, and will return to core concepts (category 1 probes) from multiple perspectives to assess student comprehension. These perspectives might include asking a question first as a multiple choice item, and subsequently as a fill-in-the-blank/free response item. If a student consistently demonstrates a deficiency with a concept, the system will generate a brief “timeout” and direct the student to the location of this content in the textbook (either electronic or print versions).
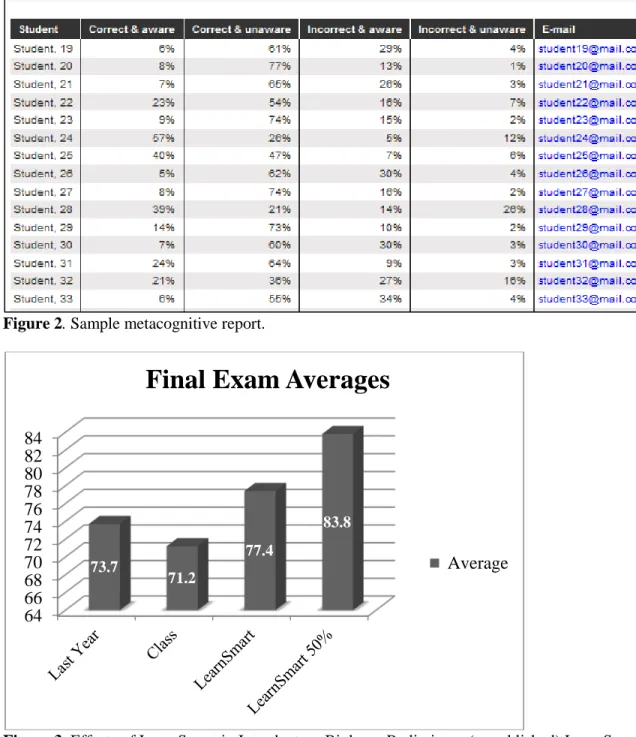
It is important to note that students are not graded on a percent correct basis. Instead, the system focuses on percent completion. However, perhaps the most useful function of LearnSmart is the generation of metacognitive data, that is, data that reflect the student’s perception of their
understanding (Figure 2). Both the students and the instructors have access to these data, which can be used for self- or class-based assessment of content comprehension.
As instructors began to use LearnSmart , they also sought to evaluate its effectiveness. To do so, some performed rough analyses of average exam grades with and without the use of
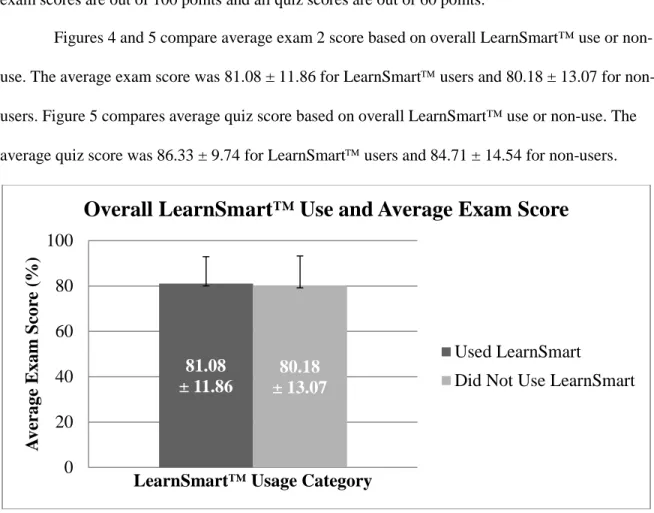
LearnSmart. These studies (Windelspecht, unpublished), indicated a relationship between use of LearnSmart and an increase in student performance on formal assessments, namely mid-terms and final exams (Figure 3).
Case studies have also been conducted at a number of other institutions that use LearnSmart. These studies, which can be found online at The Connect Community website (theconnectcommunity.com), show outcomes including increased student retention rates and higher average exam scores.
17 Figure 2. Sample metacognitive report.
Figure 3. Effects of LearnSmart in Introductory Biology: Preliminary (unpublished) LearnSmart data demonstrating the relationship between LearnSmart usage and final exam grades. Last Year = final exam average for previous year’s class; Class = final exam average for current semester; LearnSmart = student who used LearnSmart at all; LearnSmart 50% = students who used half (or more) of all LearnSmart activities
64
66
68
70
72
74
76
78
80
82
84
73.7 71.2 77.4 83.8Final Exam Averages
18
Though the results of Windelspecht (unpublished) and the case studies found on Connect Community seem to suggest that LearnSmart is making an impact in the classroom, none of these studies provide quantitative data regarding specific usage patterns or highly influential components of LearnSmart that impact student retention, student performance, etc. Recognizing that LearnSmart appears to be positively influencing science education, this study sought to look more specifically at how LearnSmart might be causing the outcomes reported by the Connect Community case studies and Windelspecht (unpublished).
One of the virtues of LearnSmart is a wealth of automatically-generated data as a result of student interaction with the activities. These data are available in the form of several LearnSmart reports, which include information about the amount of time a student spends on an exercise, what percentage of questions are answered correctly, what percentage of the exercise is completed, metacognitive data , and a student “score” which is essentially used in a competitive or “gaming” capacity within LearnSmart.
Instead of simply exploring the relationship between using LearnSmart and student exam scores, this study seeks to exploit the detailed data generated by the program. From looking more closely at LearnSmart reports, central research questions were formed surrounding how specific aspects of LearnSmart might be influencing student grades.
First hypothesizing that the clearest relationships might be observed through the examination of student usage and performance on one of the major units in introductory biology, this study focuses on student LearnSmart data and formal assessment results for a unit on Cellular Respiration.
Through statistical analysis of formal assessment scores and LearnSmart data, this study aims to examine:
• Relationships between time spent using LearnSmart and assessment results.
• Relationships between percent completion of LearnSmart activities and assessment results. • Relationship between LearnSmart Metacognitive data and assessment results.
19
• Relationships between the gaming-style student score generated by LearnSmart and assessment results.
Examining relationships between assessment scores and LearnSmart use may serve to benefit instructors and, as a result, students as well. Instructors can present their students with
statistical evidence that LearnSmart is effective and specific information about how to maximize its use. If we found, for instance, a clear relationship between completing a certain percentage of the activities and earning assessment scores of 85% or better, instructors could pass this information along to encourage the use of LearnSmart.
Instructors could also learn which LearnSmart reports will give them accurate representations of overall class performance, and which are better-suited for use in one-on-one meetings with students. The goal of this study is to know more about the effects of the features of LearnSmart in order to maximize these features to produce the best student outcomes. As such, based on the results herein, my own teaching and learning experiences, and those of my faculty advisor (Windelspecht, personal communication) this study includes best practices designed to provide helpful advice for the implementation and continued use of adaptive learning technology in the classroom.
20
MATERIALS AND METHODS Research Involving Human Subjects
This study was reviewed by Appalachian State University’s Office of Student Research Institutional Review Board (IRB) via exemption application under the following exemption category: “Research conducted in established or commonly accepted educational settings, involving normal education practices, such as (a) research on regular and special education instructional strategies, or (b) research on the effectiveness of or the comparison among instructional techniques, curricula, or classroom management methods.” On February 28, 2012, the IRB determined the study to be exempt from further review according to the regulatory category cited above under 45 CFR 46.101(b). Any questions regarding this exemption status can be addressed to the IRB via email at [email protected]. A copy of the IRB exemption notice is included with this document (Appendix A).
Selection of Students and Instructors
In order to minimize issues like consistency of instruction and course content, instead of examining several different courses of introductory biology taught by several different instructors, this study sought out a large section (roughly 200 students) or sections of students in the same course taught by the same, seasoned instructor. As such, a section of an introductory non-majors biology course at a mid-sized southeastern university, which included 193 students, was chosen for this study. The use of LearnSmart was available to all students, though it was not a requirement for this course.
Data Collection
Performance data were obtained from the LearnSmart system and the ASULearn learning management system used by Appalachian State University. In accordance with the IRB
requirements, data provided by the instructor were coded in order to remove all student identifiers prior to analysis. Student names were replaced with research identification numbers, which in no way related to the students’ identities.
21
The following reports were generated from the ASULearn and LearnSmart systems. Unless otherwise noted, all data are associated with Chapter 6: How Cells Release Energy, from the course text book, Biology: Concepts and Investigations, 3rd edition (Hoefnagels, 2013). All reports were downloaded as .csv files and then converted to Microsoft Excel for organization.
LearnSmart Reports
• Performance reports that included: time spent on the Chapter 6 module, the percent of the activity that was completed, and a student score value.
• Metacognitive Analysis. These reports are only generated across all of the content of the course, and were not specific to the Chapter 6 module on cellular respiration. The
metacognitive data summarizes students’ awareness of their knowledge when completing exercises, broken down into the following four categories:
o Correct and aware, o Correct and unaware, o Incorrect and aware, and o Incorrect and unaware. ASULearn Reports
• Performance on an in-class exam (“exam 2”)for the course, which included the topic of cellular respiration.
• Performance on an open-book cellular respiration quiz administered online through ASULearn.
• Student responses to a voluntary online “Student LearnSmart™ Usage Survey”. The survey questions and student responses can be found in Appendix B.
The raw data were organized from several files into one all-inclusive excel file in order to include all of the aforementioned LearnSmart and assessment data onto a single spreadsheet. Data involving time spent on LearnSmart activities was converted from hours and minutes (hh:mm) to
22
minutes. Blank entries were left blank. Some records included multiple entries for the same student. In these cases, which resulted from students registering multiple times for the LearnSmart material, the data were used from the attempt during which the student spent no less than 1 minute on the material to avoid including data that may have resulted from accidental logout from the program. Complete raw data are available upon request.
Data Analysis
All analyses were performed using JMP 10.0 (SAS Institute Inc.). The vast majority of the data were analyzed using simple linear regression, where assessment scores were treated as the dependent variable, x, and LearnSmart data were treated as the explanatory variable, y. Simple linear regression was chosen because the focus of this study was to determine the best practices methods of utilizing LearnSmart™ in a classroom, and therefore a regression analysis would allow me to assess the amount of variation in assessment scores that is attributed to specific aspects of LearnSmart™.
Statistical Analyses. To determine statistical significance when comparing average assessment scores, t-tests were performed.
In order to interpret how well future outcomes (assessment scores) are likely to be predicted by our experimental linear models, I calculated the coefficient of determination, R2, which, for the simple linear regression performed in this study, had a possible range from 0 to 1.
In order to determine the statistical significance of the linear relationships observed, I also calculated p-values for each of the data sets analyzed via linear regression.
Comparing Average Assessment Scores. Average exam score with standard deviation and average Chapter 6 quiz score with standard deviation was calculated separately for:
1. All records indicating any LearnSmart™ use, 2. All records indicating no LearnSmart™ use,
23
4. All records indicating no LearnSmart™ use for the Chapter 6 module. Average exam score with standard deviation was calculated for:
1. All records indicating average use of less than 50% of all LearnSmart™ exercises, and 2. All records indicting average use of 50% or more of all LearnSmart™ exercises. Average quiz score with standard deviation was calculated for:
1. All records indicating use of less than 50% of the Chapter 6 module, and 2. All records indicating use of 50% or more of the Chapter 6 module.
The results were displayed as column graphs in order to compare average assessment scores based upon:
1. Average assessment scores and overall use or non-use of LearnSmart,
2. Average assessment scores and use or non-use of LearnSmart™ for the Chapter 6 module, and
3. Two categories of LearnSmart™ percent completion:
a. Average exam score with average use of less than 50% of all LearnSmart™ exercises or use of 50% or more of all LearnSmart™ exercises, and
b. Average quiz score and use of less than 50% of Chapter 6 module exercises or use of 50% or more of Chapter 6 module exercises.
Then, t-tests were performed for each column graph.
Linear Regression Analyses. One of the following aspects of LearnSmart was plotted against assessment score (exam 2 score and Chapter 6 quiz score separately)
• Time spent on the LearnSmart Chapter 6 module: To assess whether there is a relationship between the time students invested in the Chapter 6 module exercises and student
24
• Percent complete on the LearnSmart Chapter 6 module: To assess whether there is a relationship between the amount of the Chapter 6 module material completed and student performance.
• LearnSmartstudent standing “score” for the Chapter 6 module: To assess whether the gaming aspect of the LearnSmart system has any relation to student performance.
• The four metacognitive categories: overall percent correct and aware, overall percent correct an unaware, overall percent incorrect and aware, overall percent incorrect and unaware, for all LearnSmart™ exercises: To assess whether there is a relationship between student awareness of knowledge of material and overall performance.
• Average time spent on all LearnSmart activities: To assess whether there is a relationship between the total time students invested in all of the LearnSmart activities and student performance on exam 2 and the Chapter 6 quiz.
• Average percent completion of all LearnSmart activities: To assess whether there is a relationship between the total percentage of activities students completed in LearnSmart and student performance on exam 2 and the Chapter 6 quiz.
Then, p-values were calculated for each of the linear regression models. In total, four sets of data were analyzed:
• Data set one compared average exam 2 score and average Chapter 6 quiz score based upon use or non-use of LearnSmart(n=193), average exam 2 score and average Chapter 6 quiz score based upon use or non-use of LearnSmart for the Chapter 6 module (n=193), and average assessment scores based upon an average percent completion threshold of 50(n=193), yielding 6 column graphs.
• Data set two plotted each of the categories of LearnSmart data against exam 2 score, and then against Chapter 6 quiz score, yielding 18 linear regressions (n=193).
25
• Data set three plotted each of the categories of LearnSmart ™ against exam 2 score, except that these analyses were performed on a revised data set, excluding students that did not use LearnSmart at all, yielding 9 linear regressions (n = 60). This analysis was performed in order to exclude some of the “0” data points seen in Data Set 2.
• Data set four plotted each of the categories of LearnSmart ™ against Chapter 6 quiz score, except that these analyses were performed on a revised data set, excluding students that did not use LearnSmart™ for the Chapter 6 module (n = 28), yielding 9 linear regressions. This analysis was performed in order to exclude some of the “0” data points seen in Data Set 2.
• Data set five plotted time spent on LearnSmart activities against each of the assessment scores for the revised data sets after removing the sample outliers (sample minimum and maximum), resulting in four linear regressions. Total time spent on all LearnSmart™ activities was plotted versus exam 2 score (n = 58). Time spend on the Chapter 6 module was plotted versus Chapter 5 quiz score (n = 26).
Outliers were removed for time data only due to a few suspicious time values. The maximum total time value was 1278 minutes, while the next highest value was less than half this, at 637 minutes. As such, I decided to remove outliers to see if the data was skewed.
26 RESULTS Comparing Average Assessment Scores
Data Set One (n = 193). The following figures compare average assessment score based on overall use or non-use of LearnSmart, use or non-use of LearnSmart™ for the Chapter 6 module, and overall use of LearnSmart™ for less than 50% of exercises or 50% or more of exercises. All exam scores are out of 100 points and all quiz scores are out of 60 points.
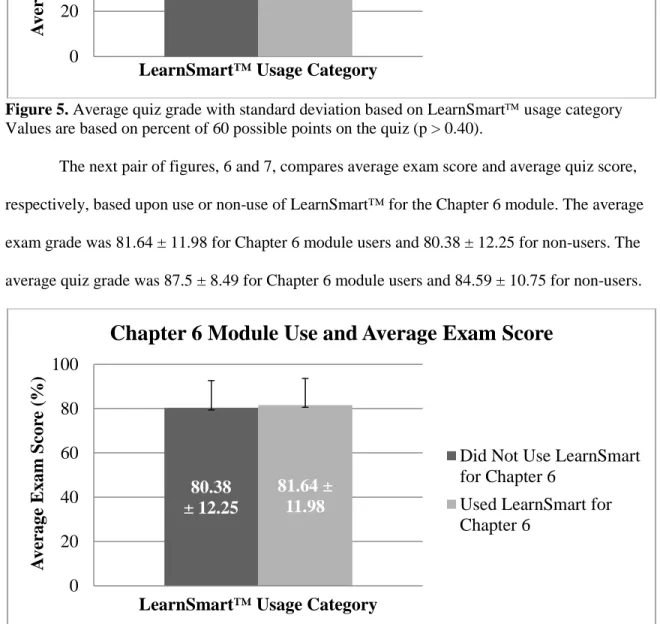
Figures 4 and 5 compare average exam 2 score based on overall LearnSmart™ use or non-use. The average exam score was 81.08 ± 11.86 for LearnSmart users and 80.18 ± 13.07 for non-users. Figure 5 compares average quiz score based on overall LearnSmart™ use or non-use. The average quiz score was 86.33 ± 9.74 for LearnSmart users and 84.71 ± 14.54 for non-users.
Figure 4. Average exam grade with standard deviation based on LearnSmart usage category. Values are based on 100 points (p > 0.50).
81.08
± 11.86
80.18
± 13.07
0
20
40
60
80
100
A
ve
rage
E
xam
S
cor
e (
%
)
LearnSmart™ Usage Category
Overall LearnSmart™ Use and Average Exam Score
Used LearnSmart
27
Figure 5. Average quiz grade with standard deviation based on LearnSmart usage category Values are based on percent of 60 possible points on the quiz (p > 0.40).
The next pair of figures, 6 and 7, compares average exam score and average quiz score, respectively, based upon use or non-use of LearnSmart™ for the Chapter 6 module. The average exam grade was 81.64 ± 11.98 for Chapter 6 module users and 80.38 ± 12.25 for non-users. The average quiz grade was 87.5 ± 8.49 for Chapter 6 module users and 84.59 ± 10.75 for non-users.
Figure 6. Average exam score with standard deviation based on Chapter 6 LearnSmart usage category. Values are based on 100 possible points (p > 0.50).
86.33
± 9.74
84.71
± 14.54
0
20
40
60
80
100
A
v
era
g
e Q
u
iz
S
co
re (
%
)
LearnSmart™ Usage Category
Overall LearnSmart™ Use and Average Quiz Score
Used LearnSmart
Did Not Use LearnSmart
80.38
± 12.25
81.64 ±
11.98
0
20
40
60
80
100
A
ve
rage
E
xam
S
cor
e (
%
)
LearnSmart™ Usage Category
Chapter 6 Module Use and Average Exam Score
Did Not Use LearnSmart
for Chapter 6
Used LearnSmart for
Chapter 6
28
Figure 7. Average quiz score with standard deviation based on Chapter 6 LearnSmart usage category. Values are based on percent of 60 possible points on the quiz (p > 0.20).
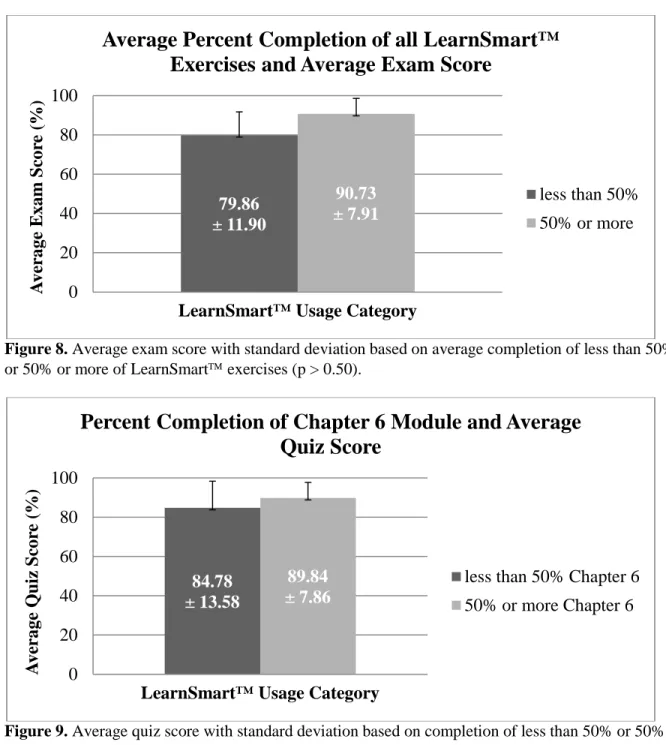
Figures 8 and 9 compare average exam score based on average percent completion of all LearnSmart exercises and average Chapter 6 quiz score based on percent completion of the Chapter 6 module. The average exam score was79.86 ± 11.90 for students who completed an average of less than 50% of all LearnSmart exercises before the exam, compared to average exam score of 90.73 ± 7.91 for students who completed an average of 50% or more of all LearnSmart exercises before the exam. Figure 9 compares average Chapter 6 quiz score based on percent completion of the Chapter 6 LearnSmart module. The average quiz score was 84.78 ± 13.58 for students who used less than 50% of the Chapter 6 LearnSmart module, compared to an average quiz score of 89.84± 7.86 for students who used 50% or more of the Chapter 6 LearnSmart module.
84.59
± 10.75
87.5
± 8.49
0
20
40
60
80
100
LearnSmart™ Usage Category
Chapter 6 Module Use and Average Quiz Score
Did Not Use LearnSmart
for Chapter 6
Used LearnSmart for
Chapter 6
29
Figure 8. Average exam score with standard deviation based on average completion of less than 50% or 50% or more of LearnSmart exercises (p > 0.50).
Figure 9. Average quiz score with standard deviation based on completion of less than 50% or 50% or more of LearnSmart exercises (p > 0.50).
79.86
± 11.90
90.73
± 7.91
0
20
40
60
80
100
A
ve
rage
E
xam
S
cor
e (
%
)
LearnSmart™ Usage Category
Average Percent Completion of all LearnSmart™
Exercises and Average Exam Score
less than 50%
50% or more
84.78
± 13.58
89.84
± 7.86
0
20
40
60
80
100
A
v
era
g
e Q
u
iz
S
co
re (
%
)
LearnSmart™ Usage Category
Percent Completion of Chapter 6 Module and Average
Quiz Score
less than 50% Chapter 6
50% or more Chapter 6
30 Linear Regression Analyses
Data Set 2 (n=193). The following figures are linear regression analyses of LearnSmart data versus student exam scores. All exam scores are out of 100 points.
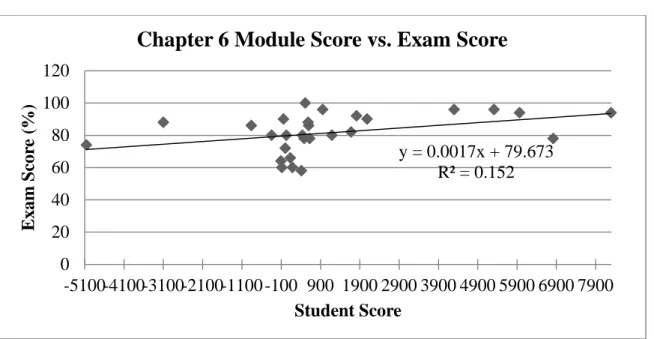
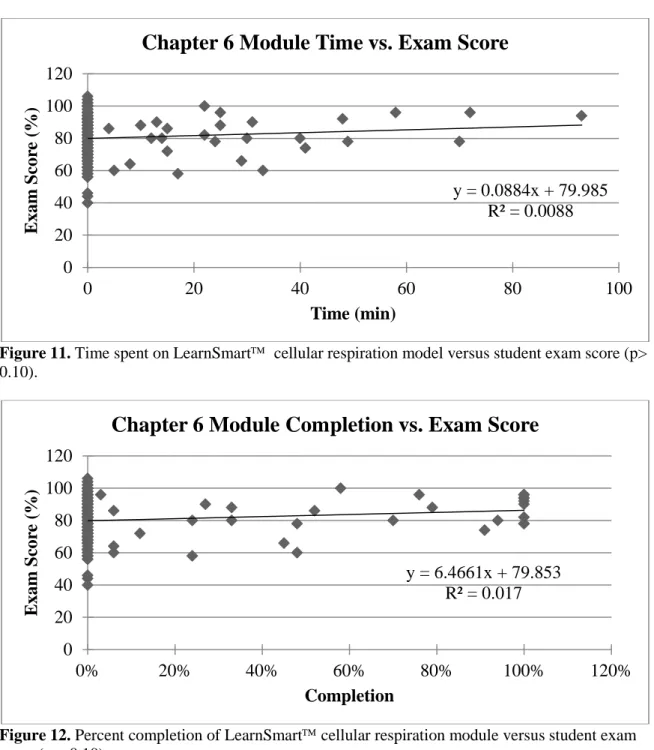
Figures 10- 12 explore possible linear relationships between LearnSmart Chapter 6 module student score and student exam score, Chapter 6 module time and student exam score, and Chapter 6 module percent completion and student exam score, respectively.
The R2 value was 0.152 for the linear model of Chapter 6 module student score versus exam score is, 0.0088 for the linear model of Chapter 6 module time versus exam score, and 0.017 for the linear model of Chapter 6 module percent completion versus exam score.
Figure 10. LearnSmart-generated Chapter 6 module student score versus student exam score (p< 0.05).
y = 0.0017x + 79.673
R² = 0.152
0
20
40
60
80
100
120
-5100-4100-3100-2100-1100 -100 900 1900 2900 3900 4900 5900 6900 7900
E
xam
S
cor
e (
%
)
Student Score
31
Figure 11. Time spent on LearnSmart cellular respiration model versus student exam score (p> 0.10).
Figure 12. Percent completion of LearnSmart cellular respiration module versus student exam score (p < 0.10).
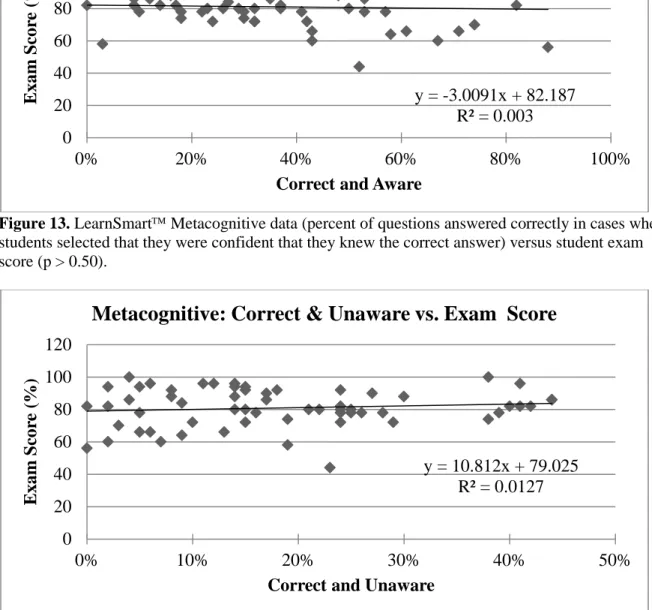
Figures 13-15 explore linear relationships between the four categories of metacognitive data and student exam score. The R2 value was 0.003 for the linear model of metacognitive: correct and aware versus exam score, 0.0127 for the linear model of metacognitive: correct and unaware versus exam score, 3e-8 for the linear model of metacognitive: incorrect and aware versus exam score, and 0.002 for the linear model of metacognitive: incorrect and unaware versus exam score.
y = 0.0884x + 79.985
R² = 0.0088
0
20
40
60
80
100
120
0
20
40
60
80
100
E
xam
S
cor
e (
%
)
Time (min)
Chapter 6 Module Time vs. Exam Score
y = 6.4661x + 79.853
R² = 0.017
0
20
40
60
80
100
120
0%
20%
40%
60%
80%
100%
120%
E
xam
S
cor
e (
%
)
Completion
32
Figure 13. LearnSmart Metacognitive data (percent of questions answered correctly in cases where students selected that they were confident that they knew the correct answer) versus student exam score (p > 0.50).
Figure 14. LearnSmart Metacognitive data (percent of questions answered correctly in cases where students selected that they were not confident that they knew the correct answer) versus student exam score (p > 0.20).
y = -3.0091x + 82.187
R² = 0.003
0
20
40
60
80
100
120
0%
20%
40%
60%
80%
100%
E
xam
S
cor
e (
%
)
Correct and Aware
Metacognitive: Correct & Aware vs. Exam Score
y = 10.812x + 79.025
R² = 0.0127
0
20
40
60
80
100
120
0%
10%
20%
30%
40%
50%
E
xam
S
cor
e (
%
)
Correct and Unaware
33
Figure 15. LearnSmart Metacognitive data (percent of questions answered incorrectly in cases where students selected that they were guessing -were confident that they did not know the correct answer) versus student exam score (p > 0.50).
Figure 16. LearnSmart Metacognitive data (percent of questions answered incorrectly in cases where students thought that they knew the correct answer) versus student exam score (p >0.50).
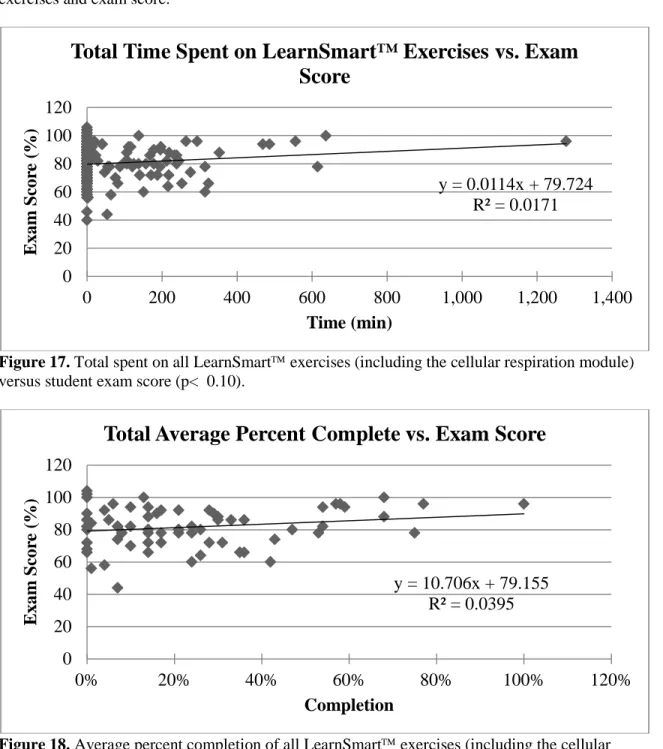
Figure 17 examines the linear relationship between total time spent using LearnSmart and student exam score. Figure 18 explores a possible linear relationship between total percent
completion of all LearnSmart exercises and student exam score.
y = 0.0115x + 80.997
R² = 3E-08
0
20
40
60
80
100
120
0%
20%
40%
60%
80%
100%
E
xam
S
cor
e (
%
)
Incorrect and Aware
Metacognitive: Incorrect & Aware vs. Exam Score
y = -6.2132x + 81.926
R² = 0.002
0
20
40
60
80
100
120
0%
5%
10%
15%
20%
25%
30%
35%
40%
E
xam
S
cor
e (
%
)
Incorrect and Unaware
34
The R2 value was 0.0171for the linear model of total time spent on LearnSmart™ exercises versus exam score and 0.0395 for the linear model of total percent completion of all LearnSmart™ exercises and exam score.
Figure 17. Total spent on all LearnSmart exercises (including the cellular respiration module) versus student exam score (p< 0.10).
Figure 18. Average percent completion of all LearnSmart exercises (including the cellular respiration module) versus student exam score (p< 0.10).
The following figures are linear regression analyses of LearnSmart data versus student Chapter 6 quiz scores. All quiz scores are out of 60 points.
y = 0.0114x + 79.724
R² = 0.0171
0
20
40
60
80
100
120
0
200
400
600
800
1,000
1,200
1,400
E
xam
S
cor
e (
%
)
Time (min)
Total Time Spent on LearnSmart™ Exercises vs. Exam
Score
y = 10.706x + 79.155
R² = 0.0395
0
20
40
60
80
100
120
0%
20%
40%
60%
80%
100%
120%
E
xam
S
cor
e (
%
)
Completion
35
Figures 19-21 explore linear relationships between LearnSmart Chapter 6 module student score and Chapter 6 quiz score, Chapter 6 module time and Chapter 6 quiz score, and Chapter 6 module percent completion and Chapter 6 quiz score, respectively. The R2 value was 0.025 for the linear model of Chapter 6 module score and Chapter 6 quiz score, 0.0068 for the linear model of Chapter 6 module time and Chapter 6 quiz score, and 0.0055 for Chapter 6 module completion and Chapter 6 quiz score.
Figure 19. LearnSmart-generated student score versus student Chapter 6 quiz score (p > 0.20).
Figure 20. Time spent on LearnSmart cellular respiration module versus student Chapter 6 quiz score (p< 0.20).
y = 0.0011x + 83.796
R² = 0.025
0
20
40
60
80
100
120
-5100
-100
4900
9900
Q
u
iz S
co
re
(%
)
Student Score
Chapter 6 Module Score vs. Quiz Score
y = 0.0915x + 83.875
R² = 0.0068
0
20
40
60
80
100
120
0
20
40
60
80
100
Q
u
iz S
co
re
(%
)
Time (min)
36
Figure 21. Percent completion of LearnSmart cellular respiration module versus student Chapter 6 quiz score (p < 0.20).
Figures 22-25 explore linear relationships between the four categories of metacognitive data and student Chapter 6 quiz score. The R2 value was 0.0009 for the linear model of metacognitive: correct and aware versus quiz score, 0.0007 for the linear model of metacognitive: correct and unaware versus quiz score, 0.0007 for the linear model of metacognitive: incorrect and aware, and 0.0005 for the linear model of metacognitive: incorrect and unaware.
y = 4.5332x + 83.89
R² = 0.0055
0
20
40
60
80
100
120
0%
20%
40%
60%
80%
100%
120%
Q
u
iz S
co
re
(%
)
Completion
37
Figure 22. LearnSmart Metacognitive data (percent of questions answered correctly in cases where students selected that they were confident that they knew the correct answer) versus student Chapter 6 quiz score (p> 0.50).
Figure 23. LearnSmart Metacognitive data (percent of questions answered correctly in cases where students selected that they were not confident that they knew the correct answer) versus student Chapter 6 quiz score (p> 0.50).