Application of nanostructured Ca doped CeO
2
for ultraviolet filtration
Laurianne Truffault
a,*
, Minh-Tri Ta
a, Thierry Devers
a, Konstantin Konstantinov
b,
Vale´rie Harel
a, Cyriaque Simmonard
a, Caroline Andreazza
c, Ivan P. Nevirkovets
b,
Alain Pineau
c, Olivier Veron
a, Jean-Philippe Blondeau
aaInstitute PRISME, site de Chartres, EA 4229 Universite´ d’Orle´ans, 21 rue de Loigny la Bataille, 28000 Chartres, France b
Institute for Superconducting & Electronic Materials, University of Wollongong, NSW 2522, Australia
c
Centre de Recherche sur la Matie`re Divise´e, UMR 6619-CNRS, 1b rue de la Fe´rollerie, 45071 Orle´ans Cedex 2, France
1. Introduction
Recently, CeO2has been the subject of many studies regarding
its use as a catalyst[1], polishing agent[2], or potential material for ultraviolet (UV) filtration[3,4]. In the UV radiation range reaching the Earth’s atmosphere, the ultraviolet type B sub-range (UVB, 290–320 nm) is already well filtered by nanostructured TiO2 in
sunscreen cosmetic products. The ultraviolet type A (UVA) radiation is divided into two domains. The first one, called ‘‘short UVA’’, comprises the most energetic and thus the most harmful type of UVA radiation, whose wavelengths are between 320 and 340 nm. These wavelengths are implicated in skin cancers[5]. The second domain, called ‘‘long UVA’’, comprises the less energetic radiation, whose wavelengths are between 340 and 400 nm. This domain of UVA radiation is responsible for early skin aging. The need for new materials able to filter the ‘‘short UVA’’ radiation has increased in the field of cosmetic products. With a band-gap of 3.2 eV, good transparency in the visible range, and no known toxicity, nanostructured CeO2appears to be a promising inorganic
material for use as a UV filter in sunscreen cosmetic products. In several previous studies[6,7], the doping of CeO2 with different
elements such as Zn and Mg has been successfully used to shift the
material’s band-gap value because of their effects on electronic transitions.
Another significant problem for the pure CeO2 is its
photo-catalytic activity. As a result, it could oxidise under light and degrade the other compounds present in the cream. This characteristic makes the pure material incompatible with use in cosmetic products. In fact, the CeO2fluorite type structure is not
stable, because the Ce4+ionic radius is not large enough to reach
the ideal value of 0.732 for the ionic radius ratio,r(Mn+)/r(O2), of a metallic element (M) in an MO8coordination oxide. Thus, Ce4+has
the tendency to be easily transformed into Ce3+, which has a larger
ionic radius. This reaction is accompanied by release of oxygen to equilibrate the charges, which leads to the above-mentioned negative effect.
A number of papers [8–10] have reported that doping with divalent elements can reduce the photocatalytic activity of CeO2,
and that the most efficient of these is Ca. The replacement of Ce4+
by a cation with a lower valence and a larger ionic radius, such as Ca2+, stabilises the fluorite structure[10]. Although several results have been already published regarding the effects of Ca doping, there are few studies that are devoted to the effects of doping over a large concentration range.
Different chemical methods can be used for the synthesis of pure or doped CeO2. Among them, the electrochemical deposition
method [11], hydrothermal synthesis [12–14], the pyrrolidone solution route[15,16], the sol–gel method[17,18], the soft solution method[8–10], and the co-precipitation technique[7,19]can all be
A R T I C L E I N F O
Article history:
Received 11 September 2009
Received in revised form 20 January 2010 Accepted 4 February 2010
Available online 12 February 2010
Keywords: A. Nanostructures B. Chemical synthesis C. X-ray diffraction C. Electron microscopy D. Optical properties A B S T R A C T
Calcium doped CeO2 nanoparticles with doping concentrations between 0 and 50 mol% were
synthesized by a co-precipitation method for ultraviolet filtration application. Below 20 mol% doping concentration, the samples were single-phase. From 30 mol%, CaCO3appears as a secondary phase. The
calculated CeO2mean crystallite size was 9.3 nm for the pure and 5.7 nm for the 50 mol% Ca-doped
sample. Between 250 and 330 nm, the absorbance increased for the 10, 30, and 40 mol% Ca-doped samples compared to the pure one. The band-gap was found to be 3.20 eV for the undoped, and between 3.36 and 3.51 eV for the doped samples. The blue shifts are attributed to the quantum confinement effect. X-ray photoelectron spectroscopy showed that the Ce3+atomic concentration in the pure sample was
higher than that of the 20 mol% Ca-doped sample.
ß2010 Elsevier Ltd. All rights reserved.
* Corresponding author.
E-mail address:[email protected](L. Truffault).
Contents lists available atScienceDirect
Materials Research Bulletin
j o u r n a l h o m e p a g e : w w w . e l s e v i e r . c o m / l o c a t e / m a t r e s b u
0025-5408/$ – see front matterß2010 Elsevier Ltd. All rights reserved. doi:10.1016/j.materresbull.2010.02.008
listed. The co-precipitation method has several advantages: it is simple, cost-efficient, and gives reproducible results.
In this study, we have used the co-precipitation method to synthesise calcium-doped CeO2powders with doping
concentra-tions in the range of 0–50 mol%. We have studied systematically the effects of doping on the structural and optical properties of CeO2.
2. Experimental procedures
2.1. Synthesis of pure and Ca-doped CeO2
Pure and calcium-doped CeO2powders were synthesized by the
co-precipitation method. For the synthesis of the pure material, a 1.15 mol L1cerium nitrate solution (Ce(NO
3)36H2O, Alfa Aesar,
99.5%) was mixed with 5 mol L1sodium hydroxide (NaOH, Alfa
Aesar, 98%) at ambient temperature. The resulting precipitate was recovered by centrifugation and washed three times with deionised water. A 27% (w/w) hydrogen peroxide solution was then added at a temperature of 508C. The oxidised precipitate was centrifuged and washed with deionised water before filtration with a folded filter and calcination at 5008C for 6 h in a porcelain crucible (VWR) under air. The calcium doped CeO2powders were
synthesized by adding a calcium chloride solution (CaCl2, Alfa
Aesar, 97%) to the initial solution with a varying concentration, depending on the expected calcium doping molar concentration. Beige powders were obtained at the end of the experimental procedure.
2.2. Analyses used 2.2.1. TGA–DTA
Before calcination, the pure sample was characterized by thermogravimetric analysis (TGA) and differential thermal analy-sis (DTA) with a TG–DTA 92-18 Setaram instrument. The sample was heated from 20 to 10008C at a rate of 108C/min under argon. 2.2.2. FTIR
Fourier transform infrared (FTIR) spectra of the pure sample before and after calcination (mid-infrared source) were collected using a Vertex 70 Fourier transform infrared spectrometer from Bruker in attenuated total reflection (ATR) mode in the range of 400–4000 cm1with a resolution of 4 cm1.
2.2.3. XRD
The crystalline structure of the pure and doped samples was identified by X-ray diffraction (XRD) using the Cu K
a
wavelength (l
= 1.5418740 A˚) of an X’Pert Pro X-ray diffractometer from PANalitycal in the Bragg-Brentano configuration. The samples were analysed in the range of 20–1008with a step of 0.0048and a time per step of 90 s. X’Pert HighScore + software was used to analyse the data. The Scherrer formula presented below was used for the most intense peak, which was fitted by a pseudo-Voigt function, to determine the mean crystallite size:Tc¼ k
l
Bcos
u
; withB¼BobsBstd; (1)whereTcis the mean crystallite size,kis a constant shape factor (set at 0.9 in our experiments; a value suitable for a cubic crystal),
l
is the wavelength of the incident X-rays,Bobsis the observedfull-width at half-maximum (FWHM) of the considered peak,Bstdis the
instrumental contribution to the FWHM, and
u
is the value of the diffracted angle. Rietveld type refinement was used to determine the lattice constants.2.2.4. TEM
The morphology and the particle sizes were characterized using a CM 20 transmission electron microscope (TEM) from Philips. The samples were dispersed in methanol by ultrasonication. A drop of the suspension was then laid on a carbon-coated grid and dried under a lamp to let the methanol evaporate. The accelerating voltage used in TEM was 200 kV. A statistical grain size analysis was realised from the TEM images by measuring the diameter, or the biggest dimension for non-spherical particles, of at least 200 particles per sample. Selected area electron diffraction (SAED) was performed to determine the crystallinity of the structure. The interplanar spacings were evaluated from the SAED patterns using the following formula:
l
L¼Rd; (2) wherel
Lis a constant of the microscope,Ris the ring radius, andd is the interplanar spacing. The constant of the microscope was calculated by measuring the radius of a gold standard pattern whose interplanar spacings are well known.2.2.5. UV–vis absorption spectroscopy
The absorption spectra of the samples were recorded with a V 530 ultraviolet–visible spectrophotometer from Jasco in the range of 200–1000 nm using quartz cells 1 cm in length. The samples were dispersed in ethanol at a concentration of 7104mol L1
(3 mg in 25 mL) by ultrasonication for 30 min. Some pure ethanol was taken as a reference. The absorption coefficient,
a
, was calculated from the absorption spectra using the following equation:a
¼2303103
A
r
lc ; (3)
whereAis the absorbance,
r
is the real density of CeO2(set at7.28 g cm3for our calculations),lis the length of the curve, andc
is the concentration of the CeO2suspension. The band-gap values
were calculated by plotting (
a
hn
)2as a function ofhn
, wherehn
isthe photon energy. The intersection of the extrapolated linear portions with the abscissa axis gives the band-gap value. 2.2.6. XPS
X-ray photoelectron spectra (XPS) of the pure and 20 mol% calcium-doped samples were collected using a SPECS system installed in a high-vacuum chamber with the base pressure below 108mbar; the X-ray excitation was provided by Al K
a
radiationwith the photon energyh
n
= 1486.6 eV at a high voltage of 12 kV and a power of 120 W. The spectra were collected at the pass energy of 20 eV in the fixed analyser transmission mode.The powder under analysis was dusted onto an adhesive carbon tape. An identical carbon tape with a reference Cu sample on it was used to determine the charge shift. The peak positions for Ce3+and
Ce4+ obtained in this way are in good agreement with those
reported in the literature[20].
It is known that the XPS spectrum of pure CeO2has six peaks for
the 3d line due to strong hybridization of the oxygen 2p valence band with the Ce 4f orbital, which makes quantitative analysis of the reduction of Ce atoms from the 4+ to the 3+ state extremely complicated [21,22]. We have chosen the following method to determine relative concentrations of the Ce3+ and Ce4+ cations
from the Ce 3d5/2line. First, the background was subtracted using
the Shirley approximation, and then the 3d5/2peak structure was
fitted by five components (i.e., three peaks originating from the 4+ state, and two peaks originating from the 3+ state) using the commercial CasaXPS2.3.15 software package. The relative atomic concentrations of the cations under question were determined as the ratio of the respective peak areas (i.e., the total area of the three
peaks assigned to the Ce4+component and the total area of the two
peaks assigned to the Ce3+component).
The XPS spectra of the samples were measured before and after bombardment of the samples using an Ar ion source with ion energy of 5 keV.
3. Results and discussion
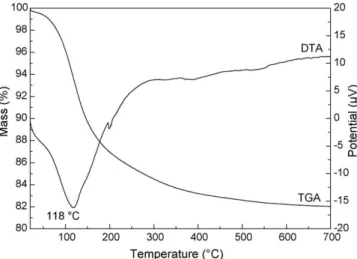
Fig. 1shows the TGA/DTA curves of the pure sample before calcination. The total mass loss was 18.1%. According to the
following thermal decomposition formula: CeO22H2O!
CeO2þ2H2OðvaporÞ, the mass loss associated with the structural water loss was 17.3%. The additional loss of mass of 0.8% obtained from the TGA curve can be attributed to a loss of moisture. The presence of a large endothermic peak whose maximum is located at 1188C confirms the dehydration reaction. From a temperature of 6508C, the remaining mass is stable. This indicates that the thermal decomposition is over.
Fig. 2shows the FTIR spectra of the pure sample before and after calcination. Both spectra present a large absorption band located at around 500 cm1, which cannot be completely observed on the
graph. This absorption band can be attributed to the Ce–O stretching vibration [11,23,24], and corresponds to the F1u IR active mode of the CeO2fluorite structure. Both spectra contain a
large band whose maximum is located at 3300 cm1. This band can
be attributed to the O–H stretching vibration[11], and indicates the presence of water. This confirms the presence of moisture and structural water in the sample before calcination. This band is attenuated in the spectrum collected after calcination. Its presence in the spectrum after calcination indicates the presence of moisture absorbed after the calcination process. The band located at around 1640 cm1is attributed to the H–O–H bending vibration
[16], and also indicates the presence of water. In previous studies, the bands located at around 725, 840, and 1063 cm1have been
attributed to the CO2 asymmetric stretching vibration, CO32
bending vibration, and C–O stretching vibration, respectively[25]. These bands are linked to the presence of atmospheric CO2on the
metallic cations[16]and the formation of ‘‘carbonate-like’’ species on the particle surfaces[23]as a consequence of the reaction of atmospheric CO2 with water and sodium hydroxide during the
synthesis. The bands located at 1340 and 1500 cm1are attributed
to carbonate species vibrations[23,25]and are clearly attenuated after calcination, indicating that the carbonate species have been decomposed by heat treatment.
The XRD patterns of the pure and the doped CeO2nanoparticles
are shown in Fig. 3. Below 20 mol% doping concentration, the samples are single-phase. They only contain the CeO2phase, which
has a fluorite type cubic structure. At a doping concentration of 30 mol% and above, the samples contain a CaCO3phase, in addition
to the CeO2 phase. Rietveld type refinement has been used to
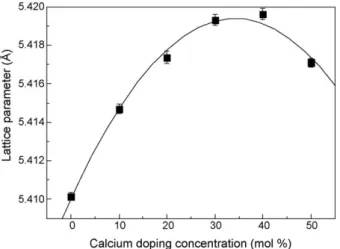
determine the lattice constants. The lattice parameter for the pure sample is 5.4101(2) A˚. This value is close to that reported in the standard data:a= 5.41134 A˚ (JCPDS 34-0394). The dependence of the CeO2lattice parameter on the calcium doping concentration is
presented inFig. 4. This indicates that the CeO2lattice parameter
increases linearly with the calcium doping until the concentration is 30 mol%. This increase shows that the volume of the CeO2cell has
increased due to the Ca2+effective ionic radius (1.12 A˚), which is larger than that of Ce4+(0.97 A˚)[26]. The fact that the samples
contain only the CeO2phase below 30 mol% doping concentration,
and the increase of the CeO2lattice parameter with the calcium
doping concentration to 30 mol%, indicate the formation of a substitution solid solution between the CeO2cell and the calcium,
where Ca2+ions take the place of Ce4+ions.
Calculations made with the Scherrer formula show that the CeO2 crystallites have nanoscale dimensions. Their sizes are
between 9.3 nm for the pure sample and 5.7 nm for the 50 mol%
Fig. 1.TGA/DTA curves of pure sample before calcination.
Fig. 2.FTIR spectra of pure sample before and after calcination.
Fig. 3.X-ray diffraction patterns of pure (a), and 10 mol% (b), 20 mol% (c), 30 mol% (d), 40 mol% (e), and 50 mol% (f) Ca-doped CeO2nanoparticles.
calcium-doped sample. The dependence of the CeO2 mean
crystallite size as measured by XRD on the calcium doping concentration is presented inFig. 5. The graph shows that the CeO2
mean crystallite size decreases with increasing doping concentra-tion. Nevertheless, the decrease seems to reach a threshold from a doping concentration of 30 mol%. Basically, the addition of a dopant into a crystalline structure affects the crystallite growth
kinetics. Before inserting itself into the CeO2structure, the calcium
is first located between the CeO2 grain boundaries and thus
disturbs the normal growth of the CeO2 crystallites. We can
distinguish two domains inFig. 5, corresponding to two modes of the CeO2crystal size change. The first domain corresponds to a
calcium doping concentration between 0 and 30 mol%. In this domain, the CeO2mean crystallite size decreases sharply with the
calcium doping concentration. Above 30 mol%, the beginning of the second domain, the decreasing of the CeO2crystallite size becomes
less pronounced because of the secondary phase formation. In Fig. 6, we present TEM images of the pure CeO2 and the
50 mol% calcium-doped CeO2 nanoparticles. Despite the
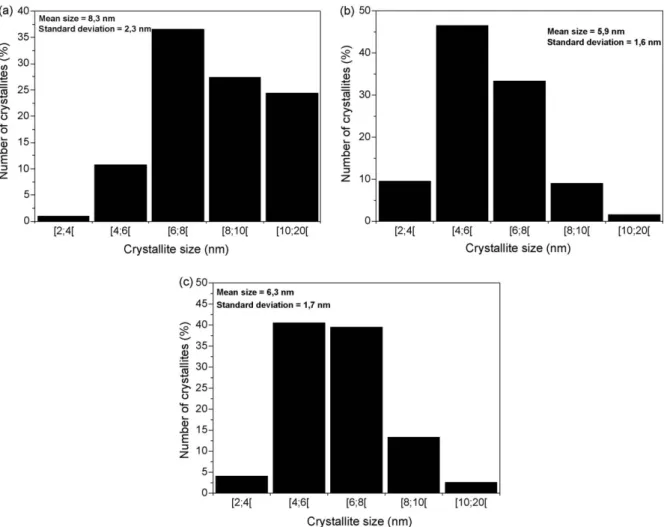
ultra-sonication, both images show that the crystallites tend to agglomerate and form aggregates. This tendency has already been reported by Phoka et al. [16]. Basically, nanoparticles have a natural tendency to agglomerate for two main reasons. First, the agglomeration is a more stable configuration from an energetic point of view. Then, nanoparticles tend to agglomerate to allow for crystallite growth. The results presented inTable 1indicate that the mean crystallite sizes measured from the TEM images differ at most by 1 nm from those obtained by XRD. This means that the TEM results are consistent with those obtained by XRD. The crystallite size histograms of pure CeO2, 20 mol% calcium-doped,
and 50 mol% calcium-doped nanoparticles are shown inFig. 7. For the three samples, the crystallite size is between 2 and 20 nm. The calcium doping causes a reduction in the number of crystallites belonging to the size range from 10 to 20 nm. It is noteworthy that the mean crystallite size for the 50 mol% Ca-doped sample obtained from the TEM images is bigger than that for the 20 mol% Ca-doped sample. This result seems at first to be inconsistent with the XRD results. However, the 50 mol% Ca-doped sample contains the CaCO3phase, whose crystallite size is
on average bigger than that of CeO2. Since it is hardly possible to
distinguish the CeO2crystallites from the CaCO3crystallites on a
TEM image, we suggest that our measurements involve CaCO3
crystallites, which thus explains the bigger mean crystallite size
Fig. 4. Dependence of the CeO2 lattice parameter on the calcium doping concentration.
Fig. 5.Dependence of the CeO2mean crystallite size as measured by XRD on the calcium doping concentration.
Fig. 6.TEM images of pure CeO2(a) and 50 mol% Ca-doped CeO2(b) nanoparticles. Table 1
Comparison of mean crystallite size measured by XRD to mean particle size measured by TEM for pure CeO2, 20 mol% Ca-doped CeO2, and 50 mol% Ca-doped CeO2.
Sample Mean crystallite size measured by XRD (nm) Mean particle size measured by TEM (nm) Standard deviation for TEM results
CeO2–0 mol% Ca 9.3 8.3 2.3 CeO2–20 mol% Ca 6.8 5.9 1.6 CeO2–50 mol% Ca 5.7 6.3 1.7
obtained for the 50 mol% Ca-doped sample. The SAED pattern of pure CeO2 nanoparticles is presented in Fig. 8. The interplanar
spacings measured from this pattern correspond to the CeO2
structure, and confirm the purity of the CeO2pure sample.
Next, we consider the absorbance curves of the pure and calcium-doped samples (seeFig. 9). The absorbance curve of the CeO2pure sample is composed of one large band, whose maximum
is located at around 315 nm. For CeO2, the fundamental absorption
is due to a charge transfer between the full 2p (O) orbital and the empty 4f (Ce) orbital[3,6,15], which corresponds to an experi-mental band-gap value of 3.19 eV for the bulk[6]. For nanomater-ials with particle sizes down to a few nanometers, the band-gap value is modified because of the quantum confinement effect. For spherical nanoparticles with an infinitely high potential energy
Fig. 7.Crystallite size histograms of (a) pure CeO2, (b) 20 mol% Ca-doped, and (c) 50 mol% Ca-doped nanoparticles.
Fig. 8.SAED pattern of pure CeO2nanoparticles.
Fig. 9.Absorbance curves of 20 mol% (a), 50 mol% (b), 0 mol% (c), 30 mol% (d), 40 mol% (e) and 10 mol% (f) calcium doped CeO2nanoparticles.
outside the sphere, the band-gap value is dependent on the particle radiusR, and can be determined from the following formula[27]:
E¼Egþ h2 8R2 1 meþ 1 mh 1:8e 2 4
p
ee
0R (4) whereEgis the bulk band-gap,Ris the radius of the nanoparticles,meandmhare the effective masses of the electron and hole, respectively,
and
e
is the relative dielectric constant of CeO2. The above equationindicates that the band-gap value increases with decreasing particle radius R. This phenomenon can be observed on the absorbance curves of the calcium-doped samples. These curves are composed of one large band, but the maximum absorption is located at a lower wavelength (around 300 nm) than for the pure sample. This means that the doping causes a blue shift of the maximum absorption. This blue shift can be quantified by calculating both the theoretical band-gap values from the above equation and the experimental band-band-gap
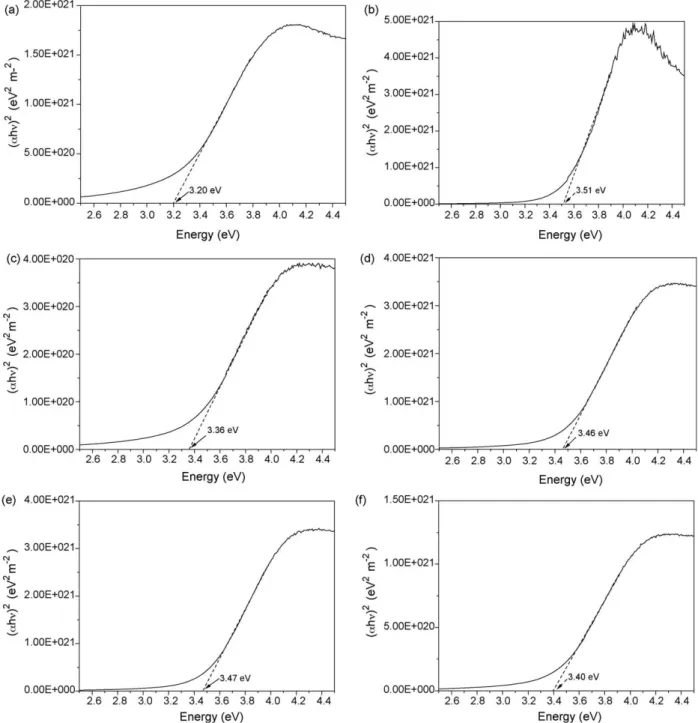
values from the absorbance curves.Fig. 10(a)–(e) shows the band-gap value extraction for the 0, 10, 20, 30, 40, and 50 mol% calcium-doped samples, respectively. We have calculated the theoretical
band-gap values for each sample by taking Eg= 3.15 eV,
me=mh= 0.4 m, where m is the mass of a free electron, and
e
= 24.5[28], and by replacingRby the mean crystallite size obtained from the XRD results.Fig. 11presents the calculated band-gap as a function of the calcium doping concentration, andFig. 12presents the experimental band-gap as a function of the calcium doping concentration.The calculated band-gap value of pure CeO2 with a mean
crystallite size of 9.3 nm is 3.160 eV. FromFig. 13one can see that this value increases with decreasing mean crystallite size, as expected according to Eq.(4). The experimental band-gap values are always higher than the theoretical ones, indicating that the mean crystallite size may have been over-valued for all the samples. The observed difference between the theoretical and the
Fig. 10.Plot of (ahn)2
experimental values can thus be explained by the fact that the crystallite size chosen for the calculations is an average. As shown by the crystallite size histograms obtained from the TEM images, the crystallite size is in reality between 2 and 20 nm.
The experimental band-gap value of the pure CeO2is 3.20 eV
(369 nm), and is higher than the bulk experimental value. This blue shift of the band-gap value for CeO2 nanoparticles (which has
already been reported [3,15,16]) results in a change in the electronic band structure due to the quantum confinement effect [16]. For the calcium-doped CeO2nanoparticles, all the values are
higher than 3.20 eV. This means that the calcium doping has increased the blue shift that already exists for pure CeO2
nanoparticles compared to CeO2bulk.
As one can infer from Fig. 9, there is no indication of any dependence of the absorbance intensity on the calcium doping concentration. Indeed, between 250 and 330 nm, the 10, 30, and 40 mol% Ca-doped samples absorb more UV radiation than the pure sample. The most harmful UVA radiation, i.e., the short-wavelength UVA radiation, is thus better filtered below 330 nm with these doping concentrations. Among the three samples cited above, the 10 mol% one is the most efficient between 265 and 325 nm. In fact, several factors affect the absorption properties of the doped sample in opposite directions. First, the doping with calcium should make the ceria unit cell more stable by tending to the value of 0.732 for ideal ionic radius ratio,r(Mn+)/r(O2), of a MO8coordination oxide. We could thus expect that the absorption
properties of the calcium-doped samples are decreased. As a result, the calcium-doped samples should be less sensitive to the UV radiation. Thus, the more calcium the sample contains, the more the absorbance should decrease. The crystallite size should affect the absorption capacities of the samples as well.
The XPS spectra of the pure and the 20 mol% calcium-doped samples were measured before ion bombardment [cf. Fig. 14(a) and (c)], and after ion bombardment [cf.Fig. 14(b) and (d)]. The peaks in the energy interval between approximately 877 and 903 eV belong to the Ce 3d5/2level. There are three peaks (situated
at 882–883, 889–890, and 898–899 eV) that may be attributed to the cerium (IV) oxidation state, whereas the other two peaks (situated at 881–882 and 885–886 eV) may be attributed to the cerium (III) state[20]. The peaks from the different oxidation states overlap, making analysis of the structure extremely complicated. As is mentioned above, we performed deconvolution of the peak structure using the CasaXPS2.3.15 software package. InFig. 14, the experimental spectra are shown as ‘‘noisy’’ curves, whereas the ‘‘smooth’’ dashed and solid peaks, obtained by fitting the experimental peak structure, characterize the Ce3+and Ce4+ions,
respectively. The white line that fits the experimental curve corresponds to the sum of all the components.
Using the components that belong to a definite oxidation state, one can quantify the relative concentrations of the Ce3+and Ce4+
ions according to the relations: %Ce3þ¼ ACe3þ
ACe3þþACe4þ
100; %Ce4þ¼ ACe4þ
ACe3þþACe4þ
100; (5)
whereACe3þandACe4þdenote the total area of the Ce 3d5/2peaks for
the (III) and (IV) oxidation states, respectively.
The calculation shows that the concentration of Ce3+ions in the
pure sample (37%) is higher than that in the doped sample (21%) before ion bombardment. This means that the Ce4+ relative
concentration in the calcium-doped sample (79%) is higher than that in the pure one (63%). The oxygen concentration is higher in the calcium-doped sample than in the pure one, too. We can conclude that the doped sample better approaches the CeO2ideal
stoichiometry because it contains more Ce4+ions and more oxygen,
and that the calcium doping has successfully made the CeO2
structure more stable. Also, since the pure sample is not as stable as
the doped sample due to its higher Ce3+ relative atomic
concentration, we can suppose that this material will be more easily excited by the UV radiation and react more strongly to this excitation.
After the ion bombardment, the relative concentration of Ce3+
has increased in both the pure (up to 51%) and in the doped (up to
Fig. 11.Plot of the calculated band-gap as a function of the calcium doping concentration.
Fig. 12.Plot of the experimental band-gap as a function of the calcium doping concentration.
39%) samples. Nevertheless, the Ce3+relative ionic concentration
remains higher after the bombardment in the pure sample than in the doped one. Possibly, the ion bombardment caused the observed reduction by changing Ce4+ions into Ce3+ions. In this
case, the energy provided by the Ar beam could have broken the Ce-O bonds, leading to the formation of Ce3+ions.
4. Conclusions
Pure and calcium doped CeO2 nanoparticles with a calcium
doping concentration between 0 and 50 mol% have been success-fully synthesized by the co-precipitation method. The calcium doping modifies the structural and optical properties of pure CeO2.
Above a 30 mol% calcium doping concentration, the samples contain a CaCO3secondary phase and are not suitable for a use as a
cosmetic product. The calcium doping causes a decrease in the mean crystallite size and increases the absorbance for the 10, 30, and 40 mol% Ca-doped samples between 250 and 335 nm. The 10 mol% Ca-doped sample is the most efficient between 265 and 325 nm. A blue shift of the absorption is observed first for the pure CeO2nanoparticle sample compared to the bulk CeO2, and then for
the doped samples compared to the pure sample. This blue shift allows for better screening of short UVA, the most harmful UVA wavelengths which are involved in skin cancers. Since the Ce3+ relative atomic concentration has been found to be higher in the pure sample than in the doped samples, we can also conclude that the calcium doping successfully made the structure more stable.
Another advantage of the calcium doping is the cost. Indeed, since cerium (III) nitrate hexahydrate is around five times more expensive than calcium chloride, doping CeO2with calcium allows
one to decrease the final cost of the nanoparticle product. References
[1] J. Kaspar, P. Fornasiero, M. Graziani, Catal. Today 50 (1999) 285–298. [2] V.D. Kosynkin, A.A. Arzgatkina, E.N. Ivanov, M.G. Chtousta, A.I. Grabko, A.V.
Kardapolov, N.A. Sysina, J. Alloys Compd. 303–304 (2000) 421–425. [3] S. Tnunekawa, T. Fukuda, A. Kasuya, J. Appl. Phys. 87 (2000) 1318–1321. [4] S. Tnunekawa, J.-T. Wang, Y. Kawazoe, A. Kasuya, J. Appl. Phys. 94 (2003) 3654–
3656.
[5] A. Stary, C. Robert, A. Sarasin, Mutat. Res., DNA Repair 383 (1997) 1–8. [6] F. Chevire, F. Munoz, C.F. Baker, F. Tessier, O. Larcher, S. Boujday, C. Colbeau-Justin,
R. Marchand, J. Solid State Chem. 179 (2006) 3184–3190. [7] L. Yue, X.-M. Zhang, J. Alloys Compd. 475 (2008) 702–705.
[8] S. Yabe, M. Yamashita, S. Momose, K. Tahira, S. Yoshida, R. Li, S. Yin, T. Sato, Int. J. Inorg. Mater. 3 (2001) 1003–1008.
[9] R. Li, S. Yabe, M. Yamashita, S. Momose, S. Yoshida, S. Yin, T. Sato, Solid State Ionics 151 (2002) 235–241.
[10] S. Yabe, S. Tsugio, J. Solid State Chem. 171 (2002) 7–11. [11] T. Wang, D.-C. Sun, Mater. Res. Bull. 43 (2008) 1754–1760.
[12] A.I.Y. Tock, F.Y.C. Boey, Z. Dong, X.L. Sun, J. Mater. Process. Technol. 190 (2007) 217–222.
[13] X. Lu, X. Li, F. Chen, C. Ni, Z. Chen, J. Alloys Compd. 476 (2009) 958–962. [14] F. Zhou, X. Ni, Y. Zhang, H. Zheng, J. Colloid Interface Sci. 307 (2007) 135–138. [15] C. Ho, J.C. Yu, T. Kwong, A.C. Mak, S. Lai, Chem. Mater. 17 (2005) 4514–4522. [16] S. Phoka, P. Laokul, E. Swatsitang, V. Promarack, Mater. Chem. Phys. 115 (2009)
423–428.
[17] I. Skofic, S. Sturm, M. Ceh, N. Bukovec, Thin Solid Films 422 (2002) 170–175. [18] Z.L. Liu, H.M. Yue, Y. Wang, K.L. Yao, Q. Liu, Solid State Commun. 124 (2002) 171–
176.
Fig. 14.XPS spectra of pure powder [panels (a), (b)], and 20 mol% calcium-doped powder [panels (c), (d)]. Spectra (a) and (c) are taken for the samples before ion bombardment; spectra (b) and (d) are taken after the bombardment. The black dashed and solid lines represent fitted peaks for the oxidation states (III) and (IV), respectively; the white line represents the sum of all the components. Dotted lines are for the Ce 3d3/2components (not considered here).
[19] M.J. Godinho, R.F. Goncalvez, L.P.S. Santos, J.A. Varela, E. Longo, E.R. Leite, Mater. Lett. 61 (2007) 1904–1907.
[20] E.G. Heckert, A.S. Karakoti, S. Seal, W.T. Self, Biomaterials 29 (2009) 2705–2709. [21] H. Ohno, A. Iwase, D. Matsumura, Y. Nishihata, J. Mizuki, N. Ishikawa, Y. Baba, N.
Hirao, T. Sonoda, M. Kinoshita, Nucl. Instr. Meth. B 266 (2008) 3013–3017. [22] J.P. Holgado, R. Alvarez, G. Munuera, Appl. Surf. Sci. 161 (2000) 301–315. [23] D. Andreescu, E. Matijevic, D.V. Goia, Colloids Surf. A 291 (2006) 93–100.
[24] J. Liu, Z. Zhao, J. Wang, C. Xu, A. Duan, G. Jiang, Q. Yang, Appl. Catal. B 84 (2008) 185–195.
[25] S. Wang, F. Gu, C. Li, H. Cao, J. Cryst. Growth 307 (2007) 386–394. [26] V. Thangadurai, P. Kopp, J. Power Sources 168 (2007) 178–183. [27] J. Schoonman, Solid State Ionics 157 (2003) 319–326. [28] F. Zhang, Q. Jin, S.-W. Chan, J. Appl. Phys. 95 (2004) 4319–4326.

![Fig. 14. XPS spectra of pure powder [panels (a), (b)], and 20 mol% calcium-doped powder [panels (c), (d)]](https://thumb-us.123doks.com/thumbv2/123dok_us/9784645.2862768/8.892.112.772.77.601/fig-spectra-powder-panels-calcium-doped-powder-panels.webp)
