Oracle® Enterprise Manager
System Monitoring Plug-in Metric Reference Manual for
Non-Oracle Database Management
Release 12 (12.0)
B28748-11
Oracle Enterprise Manager System Monitoring Plug-in Metric Reference Manual for Non-Oracle Database Management, Release 12 (12.0)
B28748-11
Copyright © 2010, Oracle and/or its affiliates. All rights reserved.
This software and related documentation are provided under a license agreement containing restrictions on use and disclosure and are protected by intellectual property laws. Except as expressly permitted in your license agreement or allowed by law, you may not use, copy, reproduce, translate, broadcast, modify, license, transmit, distribute, exhibit, perform, publish, or display any part, in any form, or by any means. Reverse engineering, disassembly, or decompilation of this software, unless required by law for interoperability, is prohibited.
The information contained herein is subject to change without notice and is not warranted to be error-free. If you find any errors, please report them to us in writing.
If this software or related documentation is delivered to the U.S. Government or anyone licensing it on behalf of the U.S. Government, the following notice is applicable:
U.S. GOVERNMENT RIGHTS Programs, software, databases, and related documentation and technical data delivered to U.S. Government customers are "commercial computer software" or "commercial technical data" pursuant to the applicable Federal Acquisition Regulation and agency-specific supplemental regulations. As such, the use, duplication, disclosure, modification, and adaptation shall be subject to the restrictions and license terms set forth in the applicable Government contract, and, to the extent applicable by the terms of the Government contract, the additional rights set forth in FAR 52.227-19, Commercial Computer Software License (December 2007). Oracle USA, Inc., 500 Oracle Parkway, Redwood City, CA 94065.
This software is developed for general use in a variety of information management applications. It is not developed or intended for use in any inherently dangerous applications, including applications which may create a risk of personal injury. If you use this software in dangerous applications, then you shall be responsible to take all appropriate fail-safe, backup, redundancy, and other measures to ensure the safe use of this software. Oracle Corporation and its affiliates disclaim any liability for any damages caused by use of this software in dangerous applications.
Oracle is a registered trademark of Oracle Corporation and/or its affiliates. Other names may be trademarks of their respective owners.
This software and documentation may provide access to or information on content, products, and services from third parties. Oracle Corporation and its affiliates are not responsible for and expressly disclaim all warranties of any kind with respect to third-party content, products, and services. Oracle Corporation and its affiliates will not be responsible for any loss, costs, or damages incurred due to your access to or use of third-party content, products, or services.
Contents
Preface
... xiAudience... xi
Documentation Accessibility ... xi
Related Documents ... xii
Conventions ... xii
How to Use This Manual
... xiiiStructure of the Metric Reference Manual... xiii
Background Information on Metrics, Thresholds, and Alerts ... xiv
1
Microsoft SQL Server Metrics
Configuration Metrics... 1-1 SQL Server Configuration Metrics ... 1-1 Registry Setting Configuration Metrics ... 1-2 Database Setting Configuration Metrics... 1-2
Access Methods Metrics... 1-3 For Microsoft SQL Server 2000/2005/2008... 1-4
Agent Status Metrics... 1-5
Buffer Manager Metrics... 1-5 For Microsoft SQL Server 2000/2005/2008... 1-5
Cache Manager Metrics... 1-6 For Microsoft SQL Server 2000/2005/2008... 1-6
Database Metrics... 1-7
Database Backup Metrics... 1-8
Database Job Metrics... 1-9
Database Lock Metrics... 1-10
Database Parameter Metrics... 1-11
Database Performance Metrics... 1-13 For Microsoft SQL Server 2000/2005/2008... 1-13
Event Log Entry Metrics... 1-14
General Statistics Metrics... 1-15 For Microsoft SQL Server 2000/2005/2008... 1-15
Integrated Security Setting Metrics... 1-17
MSSQL Database File Metrics... 1-18
MSSQL File Group Metrics... 1-19
MSSQL Transaction Log Metrics... 1-19
Memory Manager Metrics... 1-20 For Microsoft SQL Server 2000/2005/2008... 1-20
Memory Statistics Metrics... 1-21
Processor Metrics... 1-22
Response Metrics... 1-22
SQL Server Locks Metrics... 1-23 For Microsoft SQL Server 2000/2005/2008... 1-23
SQL Server Process Metrics... 1-24
SQL Server Role Metrics... 1-24
SQL Statistics Metrics... 1-25 For Microsoft SQL Server 2000/2005/2008... 1-25
Server Statistics Metrics... 1-26
User Metrics... 1-26
Windows Cluster Name Metrics... 1-26 For Microsoft SQL Server 2005... 1-27
Windows Cluster Nodes Metrics... 1-27 For Microsoft SQL Server 2005... 1-27
Windows Cluster Resources Metrics... 1-27 For Microsoft SQL Server 2005... 1-27
Cluster Name and Network Metrics... 1-27 For Microsoft SQL Server 2005... 1-27
Cluster Resource and Type Metrics... 1-28 For Microsoft SQL Server 2005... 1-28
Cluster Resource and Group Metrics... 1-28 For Microsoft SQL Server 2005... 1-28
Cluster Active Group and Node Metrics... 1-28 For Microsoft SQL Server 2005... 1-28
Cluster Resource Group and Cluster Name Metrics... 1-29 For Microsoft SQL Server 2005... 1-29
Cluster Active Resource and Node Metrics... 1-29 For Microsoft SQL Server 2005... 1-29
Cluster Quorom Resource and Cluster Name Metrics... 1-29 For Microsoft SQL Server 2005... 1-29
Cluster Resource and Owner Node Name Metrics... 1-30 For Microsoft SQL Server 2005... 1-30
Cluster Resource and Cluster Name Metrics... 1-30 For Microsoft SQL Server 2005... 1-30
Cluster Resource Group and Preferred Node Metrics... 1-30 For Microsoft SQL Server 2005... 1-30
Index/Table Fragmentation Metrics... 1-31
2
IBM DB2 Database Metrics
Connections... 2-1 Agent Connection Statistics Metrics... 2-1
Connected Applications Statistics Metrics ... 2-2
Database Manager Configuration Information... 2-2 Capacity Metrics... 2-3 Connection Metrics ... 2-3 Database Instance Metrics... 2-4 Logging and Recovery Metrics ... 2-4 Partitioned Database Environment Metrics ... 2-5
Health Indicators/Alarms... 2-5 Container Health Indicator Metrics... 2-6 Container Health Information Metrics ... 2-6 Database Collection Health Indicator Metrics ... 2-7 Database Health Indicator Metrics ... 2-7 Database Health Information Metrics ... 2-8 DBM Health Indicator Metrics ... 2-9 DBM Health Information Metrics... 2-9 Tablespaces Health Indicator ... 2-10 Tablespaces Health Indicator History... 2-10
Monitoring Information... 2-11 Agent Monitoring Metrics ... 2-11 Database Monitoring Metrics ... 2-13 Database Backup Metrics ... 2-16 General Information Metrics ... 2-16
Performance... 2-16 Agent Performance Metrics ... 2-17 Bufferpool Database Performance Metrics... 2-17 Bufferpool Performance Metrics ... 2-19 Cache Statistics Metrics ... 2-20 Log I/O Performance Metrics ... 2-20 Memory Manager Metrics ... 2-21 Sort Heap Metrics... 2-21 Non-Buffered I/O Activity Metrics... 2-23
Response Metrics... 2-23
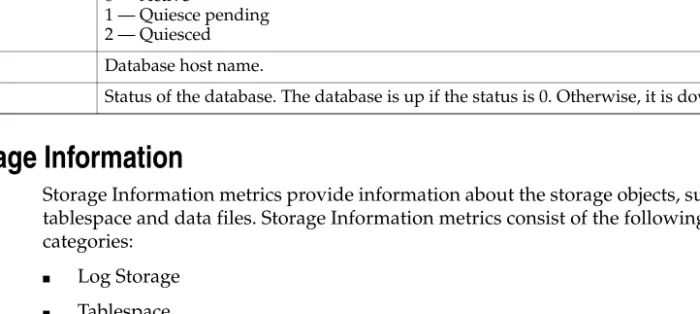
Storage Information... 2-24 Data Files Storage Metrics... 2-24 Log Storage Metrics ... 2-24 Tablespace Storage Metrics... 2-25
System Configuration Information... 2-25 Database System Information Metrics ... 2-26 Instance Information Metrics ... 2-26 Product Information Metrics ... 2-27 Partition Information Metrics... 2-27 Registry Settings Metrics... 2-27
DB2 Diag Log File Monitoring Metrics... 2-28
3
Sybase Adaptive Server Enterprise Database Metrics
General Statistics... 3-2
Cached Objects Statistics... 3-4
Cached Procedures Statistics... 3-5
Cache Pools Statistics ... 3-5
Data Cache Statistics... 3-6
Deadlock Statistics... 3-7
Device Statistics... 3-9
Adaptive Server Engines Statistics... 3-10
Device Data and IO Log Statistics... 3-11
Adaptive Server Statistics... 3-12
Locks Information... 3-13
Network I/O Statistics... 3-14
Open Databases Statistics... 3-15
Open Objects Statistics... 3-16
Procedure Cache Statistics... 3-18
Process Statistics... 3-19
Processes Activity Statistics... 3-20
Process Tracking Details... 3-22
Process Network IO Activity... 3-22
Process Objects Information... 3-23
Running Procedures Statistics... 3-24
Currently Executing SQL Text Information... 3-24
Currently Executing Queries... 3-24
Waiting Process Statistics... 3-25
Adaptive Server State... 3-25
Recently (Currently Being) Executed SQL Text... 3-26
Most Recently Executed Statement Statistics... 3-26
Waiting Events Statistics... 3-27
Server-Wide Worker Threads Statistics... 3-27
Wait Class Event Information... 3-28
Wait Events Information... 3-28
Database Usages... 3-29
Database Indexes... 3-29
Database Login Roles... 3-30
Database Logins... 3-30 Database Objects... 3-31 Database Segments... 3-31 Database Thresholds... 3-32 Database Transactions... 3-32 Database Users... 3-33
Most Recent Error Messages... 3-33
Segment Usages... 3-34
Top Ten Big Cached Objects... 3-34
Top Ten Frequently Accessed Cached Objects... 3-35
Configuration Metrics... 3-35 Sybase ASE Version Metrics ... 3-35 System Listeners Metrics... 3-36
System Databases ... 3-36 Installed Scripts ... 3-36 Charsets Information ... 3-36 Configuration Parameters... 3-37 Database Instances ... 3-38
4
Microsoft SQL Server Reports
5
IBM DB2 Database Reports
Preface
This manual is a compilation of the plug-ins metrics provided in Oracle Enterprise Manager for database management.Audience
This document is intended for Oracle Enterprise Manager users interested in plug-ins metrics for database management.
Documentation Accessibility
Our goal is to make Oracle products, services, and supporting documentation accessible to all users, including users that are disabled. To that end, our
documentation includes features that make information available to users of assistive technology. This documentation is available in HTML format, and contains markup to facilitate access by the disabled community. Accessibility standards will continue to evolve over time, and Oracle is actively engaged with other market-leading
technology vendors to address technical obstacles so that our documentation can be accessible to all of our customers. For more information, visit the Oracle Accessibility Program Web site at http://www.oracle.com/accessibility/.
Accessibility of Code Examples in Documentation
Screen readers may not always correctly read the code examples in this document. The conventions for writing code require that closing braces should appear on an
otherwise empty line; however, some screen readers may not always read a line of text that consists solely of a bracket or brace.
Accessibility of Links to External Web Sites in Documentation
This documentation may contain links to Web sites of other companies or
organizations that Oracle does not own or control. Oracle neither evaluates nor makes any representations regarding the accessibility of these Web sites.
Deaf/Hard of Hearing Access to Oracle Support Services
To reach Oracle Support Services, use a telecommunications relay service (TRS) to call Oracle Support at 1.800.223.1711. An Oracle Support Services engineer will handle technical issues and provide customer support according to the Oracle service request process. Information about TRS is available at
http://www.fcc.gov/cgb/consumerfacts/trs.html, and a list of phone numbers is available at http://www.fcc.gov/cgb/dro/trsphonebk.html.
Related Documents
For more information, see the following documents in the Oracle Enterprise Manager 10g Release 2 documentation set:
■ Oracle Enterprise Manager System Monitoring Plug-in Installation Guide for Sybase Adaptive Server Enterprise (ASE)
■ Oracle Enterprise Manager System Monitoring Plug-in Installation Guide for IBM DB2 Database
■ Oracle Enterprise Manager System Monitoring Plug-in Installation Guide for Microsoft SQL Server
Conventions
The following text conventions are used in this document: Convention Meaning
boldface Boldface type indicates graphical user interface elements associated with an action, or terms defined in text or the glossary.
italic Italic type indicates book titles, emphasis, or placeholder variables for which you supply particular values.
monospace Monospace type indicates commands within a paragraph, URLs, code in examples, text that appears on the screen, or text that you enter.
How to Use This Manual
The System Monitoring Plug-in Metric Reference Manual for Non-Oracle DatabaseManagement lists all the plug-ins metrics for database management that Enterprise Manager monitors. This manual shows all the metric help available online, eliminating the need to have the Grid Control Console up and running.
This preface describes:
■ Structure of the Metric Reference Manual
■ Background Information on Metrics, Thresholds, and Alerts
Structure of the Metric Reference Manual
This manual contains chapters for the Microsoft SQL Server and the IBM DB2 Database. The metrics in these chapters appear in alphabetical order according to category.
Metric Information
The information for each metric comprises a description and user action if available: ■ Description
Provides an explanation following the metric name. This text defines the metric and, when available, provides additional information pertinent to the metric. ■ User Action
Suggests how to solve the problem causing the alert.
Definitions of Columns in Metric Summary Tables
The Metric Summary table in Enterprise Manager Grid Control is part of the overall metric information. The following table provides descriptions of columns in the Enterprise Manager Metric Summary table.
Column Header Column Definition
Target Version Version of the target, for example, 9.0.2.x and 10.1.0.x. The x at the end of a version (for example, 9.0.2.x) represents the subsequent patchsets associated with that release.
Abbreviations and Acronyms
To reduce the page count in this document, the following abbreviations and acronyms are used:
Background Information on Metrics, Thresholds, and Alerts
A metric is a unit of measurement used to determine the health of a target. It is through the use of metrics and associated thresholds that Enterprise Manager sends out alerts notifying you of problems with the target.
Thresholds are boundary values against which monitored metric values are compared. For example, for each disk device associated with the Disk Utilization (%) metric, you can define a different warning and critical threshold. Some of the thresholds are predefined by Oracle; others are not.
Server Evaluation Frequency
The rate at which the metric is evaluated to determine whether it has crossed its threshold. For server-generated alerts, the evaluation frequency is determined by Oracle Database internals. For example, if the evaluation frequency is 10 minutes, when the Average File Write Time degrades to the point an alert should trigger, it could be almost 10 minutes before Enterprise Manager receives an indication of the alert. This column is present in the Metric Collection Summary table only for Oracle Database 10g
metrics.
Collection Schedule The rate at which the Management Agent collects data. The collection frequency for a metric comes from the Enterprise Manager default collection file for that target type. Upload Interval The rate at which the Management Agent moves data to the Management Repository.
For example, upload every nth collection. The upload frequency for a metric comes from the Enterprise Manager default collection file for that target type. This column is present in the Metric Collection Summary table only when the Upload Frequency is different from the Collection Frequency.
Comparison Operator The comparison method Enterprise Manager uses to evaluate the metric value against the threshold values.
Default Warning Threshold
Value that indicates whether a warning alert should be initiated. If the evaluation of the warning threshold value returns a result of TRUE for the specified number of
consecutive occurrences defined for the metric, an alert triggers at the warning severity level.
Default Critical Threshold
Value that indicates whether a critical alert should be initiated. If the evaluation of the critical threshold value returns a result of TRUE for the specified number of
consecutive occurrences defined for the metric, an alert triggers at the critical severity level.
Consecutive Number of Occurrences Preceding Notification
Consecutive number of times a metric’s value reaches either the warning threshold or critical threshold before a notification is sent.
Alert Text Message indicating why the alert was generated. Words that display between percent signs (%) denote variables. For example, Disk Utilization for %keyValue% is %value%% could translate to Disk Utilization for d0 is 80%.
Abbreviation/Acronym Name
Agent Oracle Management Agent
Database Oracle Database
OMS Oracle Management Service
Repository Oracle Management Repository Column Header Column Definition
After a threshold is reached, an alert is generated. An alert is an indicator signifying that a particular condition has been encountered and is triggered when one of the following conditions is true:
■ A threshold is reached. ■ An alert has been cleared.
■ The availability of a monitored service changes. For example, the availability of an application server changes from up to down.
■ A specific condition occurs. For example, an alert is triggered whenever an error message is written to a database alert log file.
Alerts are detected through a polling-based mechanism by checking for the monitored condition from a separate process at regular, predefined intervals.
Editing
Out of the box, Enterprise Manager comes with thresholds for critical metrics. Warning and critical thresholds are used to generate an alert, letting you know of impending problems so that you can address them in a timely manner.
To better suit the monitoring needs of your organization, you can edit the thresholds provided by Enterprise Manager and define new thresholds. When defining
thresholds, the key is to choose acceptable values to avoid unnecessary alerts, while still being notified of issues in a timely manner.
You can establish thresholds that will provide pertinent information in a timely manner by defining metric baselines that reflect how your system runs for a normal period of time.
The metrics listed on the Edit Thresholds page are either default metrics provided by Oracle or metrics whose thresholds you can change.
Specifying Multiple Thresholds
The Specifying Multiple Thresholds functionality allows you to define various subsets of data that can have different thresholds. By specifying multiple thresholds, you can refine the data used to trigger alerts, which is one of the key benefits of using
Enterprise Manager.
The key in specifying multiple thresholds is to determine how the comparison relates to the metric threshold as a whole. What benefit will be realized by defining a more stringent or lax threshold for that particular device, mount point, and so on?
For example, using the Average Disk I/O Service Time metric, you can define warning and critical thresholds to be applied to all disks (sd0 and sd1), or you can define different warning and critical thresholds for a specific disk (sd0). This allows you to adjust the thresholds for sd0 to be more stringent or lax for that particular disk.
Accessing Metrics Using the Grid Control Console
To access metrics in the Grid Control Console, use the All Metrics page associated with a particular target by doing the following:
1. From the Grid Control Console, choose the target.
See Also: See the Oracle Enterprise Manager Concepts manual and the Enterprise Manager online help for additional information about metrics, thresholds, and alerts
3. On the All Metrics page, choose the metric of interest and click Help. The help for that metric appears.
1
Microsoft SQL Server Metrics
This chapter provides descriptions for all Microsoft SQL Server metric categories, and tables list and describe associated metrics for each category. The tables also provide user actions if any of the metrics for a particular category support user actions. Shaded rows represent key columns for a particular category.1.1 Configuration Metrics
Configuration metrics consist of the following categories: ■ SQL Server Configuration
■ Registry Setting Configuration ■ Database Setting Configuration
1.1.1 SQL Server Configuration Metrics
The metrics in this category represent a SQL Server installation. The metrics contain details of the product and version of the SQL Server instance.
■ Table Name — MGMT_EMX_MSSQL_SQLSERVER ■ View Name — MGMT_EMX_MSSQL_SQLSERVER_VIEW Default Collection Interval — Every 24 hours
Table 1–1 SQL Server Configuration Metrics
Metric Description
Server Name Name of the SQL Server.
Clustered Whether the server belongs to a cluster. Package Product installed.
0 — Unknown 1 — Office 0 — Unknown 0 — Unknown 0 — Unknown Product Installed product. Version String Installed version. Operatingsystem
Details
Configuration Metrics
1.1.2 Registry Setting Configuration Metrics
The metrics in this category contain the installation and run-time parameters of the SQL Server stored in the registry.
■ Table Name — MGMT_EMX_MSSQL_REGSETTING ■ View Name — MGMT_EMX_MSSQL_REGSETTING_VIEW Default Collection Interval — Every 24 hours
1.1.3 Database Setting Configuration Metrics
The metrics in this category contain the settings for a database. These settings control the access to and the behavior of the database.
■ Table Name — MGMT_EMX_MSSQL_DBSETTING ■ View Name — MGMT_EMX_MSSQL_DBSETTING_VIEW Default Collection Interval — Every 24 hours
Table 1–2 Registry Setting Configuration Metrics
Metric Description
Agent Log File Path and file name for the Agent log. Backup Directory Location of the backup files directory.
Case Sensitive Comparison method for multi-byte character data is either case-sensitive or not. Error Log Path Operating system path and file name to be used for the SQL Server error log.
Master DB Path The full path and file name of the operating system file containing the master database. NT Event Logging Whether the SQL Server uses the Windows NT application log. If TRUE, the SQL
Server sends all events to the Windows NT application log and the SQL Server error log. If FALSE, the SQL Server sends events only to the SQL Server error log.
Number of Processors Number of CPUs available to the SQL Server on the server.
Perf Mon Mode Operating system path and file name to be used for the SQL Server error log. Windows NT Performance Monitor polling behavior when the monitor is launched.
0 — Continuous 1 — On demand
Registered Organization Company name supplied by the installer. Registered Owner User name supplied by the installer.
Replication Installed TRUE when components supporting replication are installed. RPC Encrypt Whether RPC encryption is enabled.
SNMP Whether Simple Network Management Protocol (SNMP) is installed on an instance of the SQL Server.
SNMP Current Version Version of Simple Management Protocol (SNMP) currently installed on an instance of the SQL Server.
Sort Order Character set used and ordering applied.
SQL Data Root Default operating system directory implementing storage for SQL Server system user-defined databases.
Access Methods Metrics
1.2 Access Methods Metrics
The metrics in this category search through and measure the allocation of SQL Server database objects, such as the number of index searches or number of pages that are allocated to indexes and data.
Table 1–3 Database Setting Configuration Metrics
Metric Description
Database Name (key column)
Database name.
Offline Whether the database is online. Also, whether the database is unavailable, or is being made unavailable, for use by authorized users.
Recovery Type Whether the comparison method for multi-byte character data is case-sensitive or not. Type of recovery model that a database will use:
Value — 0
Description — Simple
Explanation — The database can be recovered only to the last full database backup or last differential backup.
Value — 1
Description — Bulk Logged
Explanation — Logging for all SELECT INTO, CREATE INDEX, and bulk loading data operations is minimal and therefore requires less log space. In exchange for better performance and less log space usage, the risk of exposure to loss is greater than with full recovery.
Value — 2
Description — Full
Explanation — Database backups and transaction log backups provide full recoverability from media failure. All operations are fully logged, including bulk operations such as SELECT INTO, CREATE INDEX, and bulk loading data. Value — 3
Description — Unknown
Explanation — The recovery type is not known.
AutoClose Whether the database is closed and its resources are freed when no user connection accesses the database.
AutoCreateStatistics Whether the optimizer directs automatic creation of supporting data statistics as required.
AutoShrink Whether operating system files maintaining table and index data are evaluated for downward resizing when the server periodically checks for unused space.
AutoUpdateStatistics Whether the optimizer directs the automatic rebuilding of statistics. CursorCloseOnCommit Whether cursors are closed when a transaction is completed. DataSpaceUsage Amount of space in use and reserved for use of data in megabytes. IndexSpaceUsage Amount of space for the index in megabytes.
DB Owner UseOnly Whether only users with the database ownership privilege can access the database. SingleUser Mode Whether only one user can access the database at a given time.
ReadOnly Whether the database is read-only.
DefaultCursor Whether cursors declared in a batch are created with local scope. SelectIntoBulkCopy Whether non-logged operations are allowed.
TruncateLogOnChekpoi nt
Whether the SQL Server removes log entries referencing committed transactions when activity on the databases forces a dirty page write.
Access Methods Metrics
1.2.1 For Microsoft SQL Server 2000/2005/2008
Default Collection Interval — Every 30 minutes
The Access Method Counter Name key column contains several metrics. Table 1–5
provides a list of these metrics and a description for each. Table 1–4 Access Methods Metrics
Metric Description
Access Method Counter Name (key column)
Performance metric name. See Table 1–5. Access Method Counter
Value
Performance metric value.
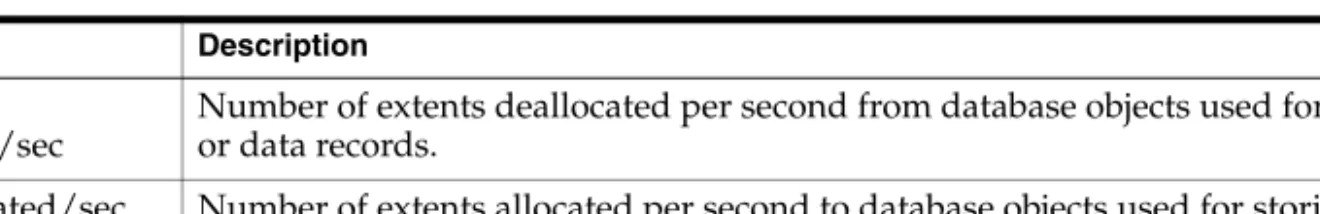
Table 1–5 Access Method Counter Name Metrics
Metric Description
Extents
Deallocations/sec
Number of extents deallocated per second from database objects used for storing index or data records.
Extents Allocated/sec Number of extents allocated per second to database objects used for storing index or data records.
Forwarded Records/sec Number of records per second fetched through forwarded record pointers. FreeSpace Page
Fetches/sec
Number of pages returned per second by free space scans used to satisfy requests to insert record fragments.
FreeSpace Scans/sec Number of scans per second that were initiated to search for free space in which to insert a new record fragment.
Full Scans/sec Number of unrestricted full scans per second, which can be either base-table or full-index scans.
Index Searches/sec Number of index searches per second. These are used to start range scans and single index record fetches and to reposition an index.
Mixed Page Allocations/sec
Number of pages allocated per second from mixed extents. These are used for storing the first eight pages that are allocated to an index or table.
Page Deallocations/sec Number of pages deallocated per second from database objects used for storing index or data records.
Page Splits/sec Number of page splits per second that occur because of overflowing index pages. Pages Allocated/sec Number of pages allocated per second to database objects used for storing index or
data records.
Probe Scans/sec Number of probe scans per second. These are used to directly find rows in an index or base table.
Range Scans/sec Number of qualified range scans through indexes per second. Scan Point
Revalidations/sec
Number of times per second that the scan point had to be revalidated to continue the scan.
Skipped Ghosted Records/sec
Number of ghosted records per second skipped during scans. Table Lock
Escalations/sec
Number of times locks on a table were escalated. Workfiles Created/sec Number of workfiles created per second.
Buffer Manager Metrics
1.3 Agent Status Metrics
The metrics in this category provide information regarding the current status of the Agent.
Default Collection Interval — Every 5 minutes
1.4 Buffer Manager Metrics
The Buffer Manager object provides counters to monitor how Microsoft SQL Server uses:
■ Memory to store data pages, internal data structures, and the procedure cache. ■ Counters to monitor the physical I/O as the SQL Server reads database pages
from, and writes database pages to, the disk.
1.4.1 For Microsoft SQL Server 2000/2005/2008
Default Collection Interval — Every 15 minutes
The Buffer Manager Counter Name key column contains several metrics. Table 1–8
provides a list of these metrics and a description for each. Worktables Created/sec Number of work tables created per second.
Worktables from Cache Base
Denominator ("base") of a fraction that the performance counter Worktables from Cache ratio represents.
Worktables from Cache Ratio
Percentage of work tables created where the initial pages were immediately available in the work table cache.
Table 1–6 Agent Status Metrics
Metric Description and User Action
Process ID Process ID of the Sqlserver Agent process. Server name Name of the Sqlserver instance.
Software Home Path of the Sqlserver process. Sqlserver Agent Status Status of the Sqlserver Agent process.
When the status is not running, the SQL server Agent must be started.
Table 1–7 Buffer Manager Metrics
Metric Description
Buffer Manager Counter Name (key column)
Performance metric name. See Table 1–8. Buffer Manager Counter
Value
Performance metric value. Table 1–5 (Cont.) Access Method Counter Name Metrics
Cache Manager Metrics
1.5 Cache Manager Metrics
The Cache Manager object provides counters to monitor how the Microsoft SQL Server uses memory to store objects such as stored procedures, ad hoc and prepared Transact-SQL statements, and triggers. Multiple instances of the Cache Manager object can be monitored at the same time, with each instance representing a different type of plan to monitor.
1.5.1 For Microsoft SQL Server 2000/2005/2008
Default Collection Interval — Every 15 minutes Table 1–8 Buffer Manager Counter Name Metrics
Metric Description
Buffer Cache Hit Ratio Percentage of pages found in the buffer cache without having to read from disk. The ratio is the total number of cache hits divided by the total number of cache lookups since the SQL Server was started. After a long period of time, the ratio does not change very much. Because reading from the cache is much less expensive than reading from disk, this ratio should be high. Generally, you can increase the buffer cache hit ratio by increasing the amount of memory available to the SQL Server.
Buffer Cache Hit Ratio Base
Denominator ("base") of a fraction that the performance counter Buffer Cache Hit Ratio represents.
Checkpoint Pages/sec Number of pages flushed to disk per second by a checkpoint or other operations that cause all dirty pages to be flushed to disk.
Database Pages Total number of database pages.
Free List Stalls/sec Number of requests that had to wait for a free page. Free Pages Total number of pages on all free lists.
Lazy Writes/sec Number of buffers written per second by the buffer manager's lazy writer. The lazy writer is a system process that flushes out batches of dirty, aged buffers (buffers that contain changes that must be written back to disk before the buffer can be reused for a different page) and make them available to user processes. The lazy writer eliminates the need to perform frequent checkpoints in order to create available buffers.
Page Lookups/sec Number of requests to find a page in the buffer pool.
Page Reads/sec Number of physical database page reads issued per second. This statistic displays the total number of physical page reads across all databases. Because physical I/O is expensive, you may be able to minimize the cost by using a larger data cache, intelligent indexes, more efficient queries, or by changing the database design. Page Writes/sec Number of database page writes issued per second. Page writes are generally
expensive. Reducing page-write activity is important for optimal tuning. One way to do this is to ensure that you do not run out of free buffers in the free buffer pool. If you do, page writes will occur while waiting for an unused cache buffer to flush.
Procedure Cache Pages Number of pages used to store compiled queries. Readahead Pages/sec Number of pages read in anticipation of use. Reserved Pages Number of buffer pool reserved pages.
Stolen Pages Number of pages used for miscellaneous server purposes (including procedure cache). Target Pages Ideal number of pages in the buffer pool.
Database Metrics
The Cache Manager Counter Name key column contains several metrics. Table 1–10
provides a list of these metrics and a description for each.
1.6 Database Metrics
The MSSQL_Database class represents a SQL Server database. Each SQL Server installation can contain one or more databases.
Default Collection Interval — Every 15 minutes Table 1–9 Cache Manager Metrics
Metric Description
Cache Manager Counter Name (key column)
Performance metric name. See Table 1–10. Cache Manager Instance
Name (key column)
Instance for the Cache Manager counter name. Cache Manager Counter
Value
Performance metric value.
Table 1–10 Cache Manager Counter Name Metrics
Metric Description
Cache Hit Ratio Percentage of pages found in the cache without having to read from disk. The ratio is the total number of cache hits divided by the total number of cache lookups since the SQL Server was started. After a long period of time, the ratio does not change very much. Because reading from the cache is less expensive than reading from disk, this ratio should be high. Generally, you can increase the cache hit ratio by increasing the amount of memory available to the SQL Server.
Cache Hit Ratio Base Denominator ("base") of a fraction that the performance counter Cache Hit Ratio represents.
Cache Pages Number of pages used by objects in the cache. After a long period of time, the count does not change very much.
Cache Object Counts Number of objects found in the cache. After a long period of time, the count does not change very much.
Cache Use Counts/sec Number of times per second that each type of object in the cache has been used. The higher this value is, the better. After a long period of time, the count does not change very much.
Table 1–11 Database Metrics
Metric Description and User Action Database Name (key
column)
Database name.
Create Date Time and date the database was created. Database File Path Primary location of the database files. Database Status Status of the database:
0 — Normal 32 — Loading 192 — Recovering 256 — Suspect 512 — Offline 1024 — Standby 32768 — Emergency Mode
Database Backup Metrics
1.7 Database Backup Metrics
The metrics in this category provide detailed backup information for all databases. Default Collection Interval — in real time
Database Size (MB) Total size of the database in megabytes.
Allocate more space to the database if this metric decreases beyond the critical threshold.
Database Space Available %
Percentage of space that is available.
Allocate more space to the database if this metric decreases beyond the critical threshold.
Space Available (MB) Unused space in megabytes.
Allocate more space to the database if this metric decreases beyond the critical threshold.
Version Version of Microsoft SQL Server used to create the referenced database.
Table 1–12 Database Backup Metrics
Metric Description
Backup Set ID (key column)
Unique backup set identification number that identifies the backup set. Media Set ID (key
column)
Unique media set identification number that identifies the media set containing the backup set.
Family Sequence Number (key column)
Position of this media family in the media set. File Number (key
column)
File identification number unique within a database. Backup Set Name Name of the backup set. Can be NULL
Backup Set Description Description of the backup set. Can be NULL.
Username Name of the user performing the backup operation. Can be NULL. Start Date Date and time the backup operation started. Can be NULL. Finish Date Date and time the backup operation finished. Can be NULL. Size of Backup (bytes) Size of the backup set, in bytes. Can be NULL.
Database Name Name of the database involved in the backup operation. Can be NULL. Server Name Name of the server running the SQL Server backup operation. Can be NULL. Machine Name Name of the computer running SQL Server. Can be NULL.
Media Set Name Name of the media set. Can be NULL.
Media Set Device Name Physical name of the backup device. Can be NULL.
Physical Block Size (Bytes) Physical block size used to write the media family. Can be NULL. File Group Name Name of the filegroup containing a backed up database file. Can be NULL. File Group Physical Name Remainder of the physical (operating system) file name. Can be NULL. Backup Set Expiration Date Date and time the backup set expires. Can be NULL.
Table 1–11 (Cont.) Database Metrics
Database Job Metrics
1.8 Database Job Metrics
The metrics in this category return information about jobs that are used by the SQLServerAgent service to perform automated activities in Microsoft SQL Server. Default Collection Interval — Every 2 hours
Table 1–13 Database Job Metrics
Metric Description and User Action Job ID (key column) Job identification number. Computer Used to Send
Network Messages
Name of the user or computer used when sending network messages. Computer Used to Send
Pages
Name of the user or computer used when sending a page. Current Execution
Status
0 — Returns only jobs that are not idle or suspended 1 — Executing
2 — Waiting for thread 3 — Between retries 4 — Idle
5 — Suspended
7 — Performing completion actions Current Execution Steps
in the Job
Current job execution step.
Current Retry Attempt If the job is running and the step has been retried, this is the current retry attempt. Delete Job Event Bitmask indicating under what circumstances the job should be deleted when a job
completes. Possible values are the same as for notify_level_eventlog. Description Description for the job.
Email of Operator Email name of the operator to notify.
Enabled Indicates whether the job is enabled to be executed. ID of Next Run
Schedule
Identification number of the next run schedule. Job Category The category to which the job belongs.
Job Creation Date Date the job was created. Job Modification Date Date the job was last modified. Job Owner The owner of the job.
Job Type 1 — Local job
2 — Multiserver job
0 — Job has no target servers
Job Version Number Version of the job, which is automatically updated each time the job is modified. Last Run Date
(mm-dd-yyyy)
Date the job last started executing. Last Run Outcome Outcome of the job the last time it ran:
0 — Failed 1 — Succeeded 3 — Canceled 5 — Unknown Last Run Time
(hh:mm:ss)
Time the job last started executing.
Name Name of the job.
Database Lock Metrics
1.9 Database Lock Metrics
The metrics in this category report information about locks. Default Collection Interval — Every 15 minutes
Next Run Time (hh:mm:ss)
Time the job is next scheduled to run.
Notify Level Email Bitmask indicating under what circumstances a notification email should be sent when a job completes. Possible values are the same as for notify_level_eventlog.
Notify Level Event Log Bitmask indicating under what circumstances a notification event should be logged to the Microsoft Windows NT application log. Possible values are as follows:
0 — Never
1 — When a job succeeds 2 — When the job fails
3 — Whenever the job completes (regardless of the job outcome)
Notify Level Net Send Bitmask indicating under what circumstances a network message should be sent when a job completes. Possible values are the same as for notify_level_eventlog.
Notify Level Page Bitmask indicating under what circumstances a page should be sent when a job completes. Possible values are the same as for notify_level_eventlog.
Number of Job Schedules
Number of job schedules the job has. Number of Job Steps Number of job steps the job has. Number of Target
Servers
Number of target servers the job has.
Originating Server Name of the server from which the job originated. Start Step ID ID of the step in the job where execution should begin.
Table 1–14 Database Lock Metrics
Metric Description
Server Process Identifier (key column)
Server process ID of the current user process. Database Identifier (key
column)
Database identification number requesting a lock. Object Identifier (key
column)
Object identification number of the object requesting a lock. Index Identifier (key
column)
The index identification number. Table 1–13 (Cont.) Database Job Metrics
Database Parameter Metrics
1.10 Database Parameter Metrics
The Databases object in Microsoft SQL Server provides counters to monitor: ■ Bulk copy operations.
■ Backup and restore throughput. ■ Transaction log activities.
Monitoring transactions and the transaction log determine how much user activity is occurring in the database and how full the transaction log is becoming. The amount of user activity can determine the performance of the database and affect log size, locking, and replication. Monitoring low-level log activity to gauge user activity and resource usage can help you identify performance bottlenecks.
Default Collection Interval — Every 24 hours
Mode Lock mode:
Shared (S) Update (U) Exclusive (X) Intent Schema
Bulk update (BU)
RangeS_S — Shared range, shared resource lock; serializable range scan. RangeS_U — Shared range, update resource lock; serializable update scan.
RangeI_N — Insert range, null resource lock. Used to test ranges before inserting a new key into an index.
RangeX_X — Exclusive range, exclusive resource lock. Used when updating a key in a range.
Resource Lock resource that corresponds to the value in syslockinfo.restext: RID, KEY, PAG, EXT, TAB, and DB
Lock Request Status The current status of the lock: GRANT, WAIT, and CNVT
Type The lock type:
■ RID = Lock on a single row in a table identified by a row identifier (RID).
■ KEY = Lock within an index that protects a range of keys in serializable transactions. ■ PAG = Lock on a data or index page.
■ EXT = Lock on an extent.
■ TAB = Lock on an entire table, including all data and indexes. ■ DB = Lock on a database.
■ FIL = Lock on a database file.
■ APP = Lock on an application-specified resource. ■ MD = Locks on metadata, or catalog information.
■ HBT = Lock on a heap or B-Tree index. This information is incomplete in SQL Server. ■ AU = Lock on an allocation unit. This information is incomplete in SQL Server.
Table 1–14 (Cont.) Database Lock Metrics
Database Parameter Metrics
Table 1–15 Database Parameter Metrics
Metric Description and User Action Parameter Name (key
column)
Name of the Database Configuration parameter. Current Value Current value of the Database Configuration parameter. Description Text description of the configuration value.
Dynamic Reconfigure Whether the parameter can be dynamically reconfigured. If TRUE, a modification to the value is immediately effective. If FALSE, modifications are visible only after the SQL Server service has been stopped and restarted.
ID Parameter name.
Maximum Value Upper bound for a configuration value. Minimum Value Lower bound for a configuration value.
Running Value Value for the configuration option (value in syscurconfigs.value).
Table 1–16 ID Description Mapping
Metric Description 101 Recovery interval. 102 Allow updates. 103 User Connections. 106 Locks. 107 Open objects 109 Fill factor. 115 Nested triggers. 117 Remote access. 124 Default language. 125 Language in cache.
502 Max async I/O.
503 Max worker threads.
505 Network packet size.
518 Show advanced option.
542 Remote proc trans.
543 Remote conn timeout.
1110 Time slice.
1123 Default sort order ID.
1124 Unicode local ID.
1125 Unicode comparison style.
1126 Language neutral.
1127 Two-digit year cutoff.
1505 Index create mem.
1514 Spin Counter.
1517 Priority boost.
Database Performance Metrics
1.11 Database Performance Metrics
The Databases object in Microsoft SQL Server provides counters to monitor: ■ Bulk copy operations.
■ Backup and restore throughput. ■ Transaction log activities.
Monitoring transactions and the transaction log determine how much user activity is occurring in the database and how full the transaction log is becoming. The amount of user activity can determine the performance of the database and affect log size, locking, and replication. Monitoring low-level log activity to gauge user activity and resource usage can help you identify performance bottlenecks.
1.11.1 For Microsoft SQL Server 2000/2005/2008
Default Collection Interval — Will upload data when alert raised
1520 Remote query timeout.
1531 Cursor threshold.
1532 Set working set size.
1533 Resource timeout.
1534 User Options.
1535 Processor affinity mask.
1536 Max text repl size.
1537 Media retention.
1538 Cost threshold for parallelism.
1539 Max degree of parallelism.
1540 Min memory per query.
1541 Query wait.
1542 VLM size.
1543 Min memory.
1544 Max memory.
1545 Query max time.
1546 Lightweight pooling.
Table 1–17 Database Performance Metrics
Metric Description
Database Performance Counter Name (key column)
Performance metric name. See Table 1–18.
Database Performance Instance Name (key column)
Instance for the Database Performance Counter Name
Database Performance Server Locks Counter
Performance metric value. Table 1–16 (Cont.) ID Description Mapping
Event Log Entry Metrics
The Database Performance Counter Name key column contains several metrics.
Table 1–18 provides a list of these metrics and a description for each.
1.12 Event Log Entry Metrics
The MSSQL_ErrorLogEntry class represents the entries in a SQL Service error log. Default Collection Interval — Metric is disabled. Will upload data when alert is raised. Table 1–18 Database Performance Counter Name Metrics
Metric Description
Active Transactions Number of active transactions for the database. Backup/Restore
Throughput/sec
Read/write throughput for backup and restore operations of a database per second. For example, you can measure how the performance of the database backup operation changes when more backup devices are used in parallel or when faster devices are used. Throughput of a database backup or restore operation allows you to determine the progress and performance of your backup and restore operations.
Bulk Copy Rows/sec Number of rows bulk-copied per second. Bulk Copy
Throughput/sec
Amount of data bulk-copied in kilobytes per second.
Data File(s) Size (KB) Cumulative size (in kilobytes) of all the data files in the database including any automatic growth. Monitoring this counter is useful, for example, for determining the correct size of tempdb.
DBCC Logical Scan Bytes/sec
Number of logical read scan bytes per second for database consistency checker (DBCC) statements.
Log Bytes Flushed/sec Total number of log bytes flushed.
Log Cache Hit Ratio Percentage of log cache reads satisfied from the log cache. Log Cache Reads/sec Reads performed per second through the log manager cache.
Log File(s) Size Cumulative size in kilobytes of all the transaction log files in the database. Log File(s) Used Size
(KB)
The cumulative used size of all the log files in the database. Log Flush Wait Time Total wait time in milliseconds to flush the log.
Log Flush Waits/sec Number of commits per second waiting for the log flush. Log Flushes/sec Number of log flushes per second.
Log Growths Total number of times the transaction log for the database has expanded. Log Shrinks Total number of times the transaction log for the database has contracted. Log Truncations Total number of times the transaction log for the database has truncated. Percent Log Used Percentage of space in the log that is in use.
Repl. Pending Xacts Number of transactions in the transaction log of the publication database marked for replication, but not yet delivered to the distribution database.
Repl. Trans. Rate Number of transactions per second read out of the transaction log of the publication database and delivered to the distribution database.
Shrink Data Movement Bytes/sec
Amount of data being moved per second by autoshrink operations, DBCC SHRINKDATABASE, or DBCC SHRINKFILE statements.
General Statistics Metrics
1.13 General Statistics Metrics
The General Statistics object in Microsoft SQL Server provides counters to monitor general server-wide activity, such as the number of current connections and the number of users connecting and disconnecting per second from computers running an instance of SQL Server. This can be useful when you are working on large online transaction processing (OLTP) systems where many clients connect and disconnect from an instance of SQL Server.
1.13.1 For Microsoft SQL Server 2000/2005/2008
Default Collection Interval — Every 30 minutes
The General Statistics Counter Name key column contains several metrics. Table 1–21
provides a list of these metrics and a description for each. Table 1–19 Database Performance Counter Name Metrics
Metric Description
Type of Record (key column)
Specifies the type of event. This is an enumerated string Record Number (key
column)
Identifies the event within the Windows logfile (for example, NT Eventlog logfile). This is specific to the logfile and is used together with the logfile name to uniquely identify an instance of this class.
Event Log Entry Name of Windows logfile (for example, NT Eventlog logfile). This is used together with the RecordNumber to uniquely identify an instance of this class.
Event Code This property has the value of the lower 16-bits of the EventIdentifier property. It is present to match the value displayed in the NT Event Viewer. Two events from the same source may have the same value for this property but may have different severity and EventIdentifier values
Event Identifier Identifies the event. This is specific to the source that generated the event log entry, and is used, together with SourceName, to uniquely identify an NT event type.
Date-Time Date and time of event generation.
Event Severity Indicates the severity of the event. Two events from the same source may have may have different severity and EventIdentifier values.
Category Specifies a subcategory for this event. This subcategory is source specific.
User User name of the logged on user when the event ocurred. If the user name cannot be determined this will be NULL.
Event Message Event message as it appears in the NT Eventlog. This is a standard message with zero or more insertion strings supplied by the source of the NT event. The insertion strings are inserted into the standard message in a predefined format. If there are no insertion strings or there is a problem inserting the insertion strings, only the standard message will be present in this field.
Table 1–20 General Statistics Metrics
Metric Description
General Statistics Counter Name (key column)
Performance metric name. See Table 1–21.
General Statistics Counter Value
General Statistics Metrics
Table 1–21 General Statistics Counter Name Metrics
Metric Description
Logins/sec Total number of logins started per second.
Logouts/sec Total number of logout operations started per second.
User Connections Number of user connections. Because each user connection consumes some memory, configuring overly high numbers of user connections could affect throughput. User connections should be set to the maximum expected number of concurrent users.
Last Database Backup Metrics
1.14 Integrated Security Setting Metrics
The MSSQL_IntegratedSecuritySetting class represents the security settings of a SQL Server installation. This setting affects all login connections to the SQL Server regardless of the login authentication type.
Default Collection Interval — Every 24 hours
1.15 Last Database Backup Metrics
The metrics in this category provide the last backup information for all databases. Default Collection Interval — Every 24 hours
Note: This metric is supported for SQLServer Database 2000 targets but not for SQLServer Database 2005 targets.
Table 1–22 Integrated Security Setting Metrics Metric Description and User Action SettingID (key column) SQL Server name.
Audit Level Indicates the current audit level security setting. Possible values are shown below. You can change the value for the desired auditing level.
0
Description — None
Explanation — Do not log authentication attempts. 1
Description — Audit Login Success
Explanation — Log successful authentication. 2
Description — Audit Login Failure Explanation — Log failed authentication. 3
Description — Audit All
Explanation — Log all authentication attempts regardless of success or failure. Impersonate Client Indicates the current audit level security setting as shown Security context for
non-administrative users executing xp_cmdshell. If TRUE,
xp_cmdshell runs in the security context of the client connection. If FALSE,
xp_cmdshell runs in the security context of the SQL Server Agent.
Security Mode Indicates the current security mode. Possible values are shown below. You can change the value for the desired security mode.
0
Description — None
Explanation — Do not log authentication attempts. 1
Description — Audit Login Success
Explanation — Log successful authentication. 2
Description — Audit Login Failure Explanation — Log failed authentication. 3
Description — Audit All
Login Metrics
1.16 Login Metrics
The MSSQL_Login class represents the login authentication records present in a SQL Server installation.
Default Collection Interval — in real time
1.17 MSSQL Database File Metrics
The MSSQL_DatabaseFile class is an extension to the CIM_DataFile class. It contains properties that are relevant to an operating system file that is also a file storing SQL Server database data.
Default Collection Interval — Every 30 minutes Table 1–23 Last Database Backup Metrics
Metric Description
Database_name (key column)
Name of the database.
Days Since Last Backup Number of days since the last backup of the database. Last Backup Date Date when the last backup of the database was initiated.
Table 1–24 Login Metrics
Metric Description
Name (key column) User name.
Type Login type for the user:
0 — Other NT user authentication 1 — NT group
2 — SQL server authentication
Table 1–25 MSSQL Database File Metrics
Metric Description
Database File Name (key column)
User name. Database Name (key
column)
Name of the database. FileGroup Name (key
column)
Name of the File Group.
Database File Path Complete path of the database file.
File Growth Growth increment of the operating system file that stores table, index, or log data. When FileGrowthType is in megabytes, the FileGrowth value represents the number of megabytes of disk space to allocate for incremental file growth. When FileGrowthType is percent, the value represents a percentage and must be in the range from 1 through 100.
File Growth Type Method of incremental allocation applied when an operating system file is extended. 0 — Megabyte
1 — Percent 99 — Invalid
Maximum Size Upper limit for the size of an operating system file containing table and index data, or maintaining a database transaction log.
Primary File Whether the database file is the one that maintains the database-specific system tables. A SQL Server database can have only one primary file.
MSSQL Transaction Log Metrics
1.18 MSSQL File Group Metrics
The MSSQL_FileGroup class represents the groups of operating system files that store a database. A SQL Server filegroup categorizes the operating system files containing data from a single SQL Server database to simplify database administration tasks, such as a backup. A filegroup cannot contain the operating system files of more than one database, though a single database can contain more than one filegroup.
Default Collection Interval — in real time
1.19 MSSQL Transaction Log Metrics
The MSSQL_TransactionLog class represents the transaction log of a Microsoft SQL Server database. A SQL Server transaction log maintains a record of modifications to the operating system files containing the data of an SQL Server database. The
transaction log provides data recovery assistance if a system failure occurs, and a SQL Server database has at least one operating system file that stores transaction log records. A transaction log can be written to more than one operating system file. Each SQL Server database maintains its own transaction log, and the operating system file or files that store log records cannot be shared with another database.
Default Collection Interval — Every 30 minutes
Space Available in MB Amount of disk resources, in megabytes, allocated and unused in operating system files.
Database File Space Available (%)
Percentage of space available of the database file. Size (MB) Current size of the database file.
Table 1–26 MSSQL File Group Metrics
Metric Description
DatabaseName (key column)
Name of the database. Filegroup Name (key
column)
FileGroup name.
Default Whether the filegroup is the default filegroup during table or index creation. Read Only Whether the filegroup is read only.
Total Size of the File Group (in MB)
Total size of the file group in megabytes.
Type Filegroup type. A database is created on exactly one filegroup named PRIMARY. This is the primary filegroup. After database creation, you can add a filegroup to the database, called a user-defined file group.
0 — User-defined 8 — On read-only media 16 — Primary
Note: This metric is supported for SQLServer Database 2000 targets but not for SQLServer Database 2005 targets.
Table 1–25 (Cont.) MSSQL Database File Metrics
Memory Manager Metrics
1.20 Memory Manager Metrics
The Memory Manager object in Microsoft SQL Server provides counters that enable you to monitor overall server memory usage to gauge user activity and resource usage. This can help you identify performance bottlenecks.
1.20.1 For Microsoft SQL Server 2000/2005/2008
Default Collection Interval — Every 15 minutes
The Memory Manager Counter Name key column contains several metrics. Table 1–29
provides a list of these metrics and a description for each. Table 1–27 MSSQL Transaction Log Metrics
Metric Description
Database Name (key column)
FileGroup name.
Size Initial size of the database. Last Backup Time of the last backup. Transaction Log Space
Available (in MB)
Space available in the database. Transaction Log Space
Available (%)
Percentage of space available in the database.
Table 1–28 Memory Manager Metrics
Metric Description
Memory Manager Counter Name (key column)
Performance metric name. See Table 1–29.
Memory Manager Counter Value
Performance metric value.
Table 1–29 Memory Manager Counter Name Metrics
Metric Description
Connection Memory (KB)
Total amount of dynamic memory the server is using for maintaining connections. Granted Workspace
Memory (KB)
Total amount of memory currently granted to executing processes such as hash, sort, bulk copy, and index creation operations.
Lock Memory (KB) Total amount of dynamic memory the server is using for locks.
Lock Blocks Allocated Current number of allocated lock blocks. At server startup, the number of allocated lock blocks plus the number of allocated lock owner blocks depends on the SQL Server Locks configuration option. If more lock blocks are needed, the value increases. Lock Owner Blocks
Allocated
Current number of allocated lock owner blocks. At server startup, the number of allocated lock owner blocks plus the number of allocated lock blocks depends on the SQL Server Locks configuration option. If more lock owner blocks are needed, the value increases dynamically.
Lock Blocks Current number of lock blocks in use on the server (refreshed periodically). A lock block represents an individual locked resource, such as a table, page, or row.
Lock Owner Blocks Number of lock owner blocks currently in use on the server (refreshed periodically). A lock owner block represents the ownership of a lock on an object by an individual thread. Therefore, if three threads each have a shared (S) lock on a page, there will be three lock owner blocks.
Memory Statistics Metrics
1.21 Memory Statistics Metrics
The metrics in this category provide information about various memory-related performance issues.
Default Collection Interval — Every 15 minutes Maximum Workspace
Memory (KB)
Maximum amount of memory available for executing processes such as hash, sort, bulk copy, and index creation operations.
Memory Grants Outstanding
Total number of processes per second that have successfully acquired a workspace memory grant.
Memory Grants Pending
Total number of processes per second waiting for a workspace memory grant. Optimizer Memory (KB) Total amount of dynamic memory the server is using for query optimization. SQL Cache Memory
(KB)
Total amount of dynamic memory the server is using for the dynamic SQL cache. Target Server Memory
(KB)
Total amount of dynamic memory the server is willing to consume. Total Server Memory
(KB)
The memory allocated to the SQL Server.
Table 1–30 Memory Statistics Metrics
Metric Description and User Action Average Latch Wait
Time (ms)
Average latch wait time in milliseconds for latch requests that had to wait. If this number is high, your server might have resource limitations. Buffer Cache Hit Ratio
(%)
Percentage of pages found in the buffer cache without having to read from disk. The ratio is the total number of cache hits divided by the total number of cache lookups since the SQL Server was started. After a long period of time, the ratio does not change very much.
Because reading from the cache is much less expensive than reading from disk, this ratio should be high. Generally, you can increase the buffer cache hit ratio by increasing the amount of memory available to the SQL Server.
Table 1–29 (Cont.) Memory Manager Counter Name Metrics
Processor Metrics
1.22 Processor Metrics
The Win32_Processor class represents a device that is capable of interpreting a sequence of machine instructions on a Win32 computer system. On a multiprocessor machine, one instance of this class exists for each processor.
Default Collection Interval — Every 15 minutes
1.23 Response Metrics
This metrics category provide information about the response of the target SQL Server Instance.
Default Collection Interval — Every 5 minutes
Cache Hit Ratio (%) Percentage of pages found in the cache without needing to read from disk. The ratio is the total number of cache hits divided by the total number of cache lookups since the SQL Server was started. After a long period of time, the ratio does not change very much.
Because reading from the cache is less expensive than reading from disk, this ratio should be high. The higher this value is, the better. Generally, you can increase the cache hit ratio by increasing the amount of memory available to the SQL Server. Log Flush Wait Time
(ms)
Log cache is very important, because it rolls back a transaction before it is committed if the circumstances warrant. But after a transaction is complete (and no longer can be rolled back), this log cache is immediately flushed to the physical log file. This is a normal procedure.
SELECT queries that do not modify data do not create transactions and do not produce log flushes. Essentially, a log flush occurs when data is written from the log cache to the physical log file. Therefore, a log flush occurs every time a transaction completes, and the number of log flushes that occur are related to the number of transactions performed by the SQL Server.
One way to troubleshoot the disk I/O bottleneck is to capture the Log Flushes/sec counter data and see how busy this mechanism is. If the server experiences a lot of transactions, it will also experience a lot of log flushes, so the value you see for this counter can vary from server to server, depending on how busy it is with action-type queries that create transactions.
Try to identify situations where the number of log flushes per second seems to be significantly higher than the expected number of transactions that you think should be running on a server.
Total Lock Wait Time (ms)
Total wait time in milliseconds for locks in the last second. If the value is high, your server has high resource contention.
Table 1–31 Processor Metrics
Metric Description and User Action Device (key column) Device ID for the device. CPU Status Status of the CPU.
Load Percentage Usage of the CPU. If the value increases above the critical threshold, this indicates a possible risk to the processor.
Table 1–30 (Cont.) Memory Statistics Metrics Metric Description and User Action