The University of Birmingham (Live System)
Thrombin generation and procoagulant
microparticle profiles AQ1 after acute trauma: A
prospective cohort study
Harrison, Paul
Document Version
Publisher final version (usually the publisher pdf)
Citation for published version (Harvard):
Harrison, P 2015, 'Thrombin generation and procoagulant microparticle profiles AQ1 after acute trauma: A prospective cohort study' The Journal of Trauma and Acute Care Surgery.
Link to publication on Research at Birmingham portal
General rights
When referring to this publication, please cite the published version. Copyright and associated moral rights for publications accessible in the public portal are retained by the authors and/or other copyright owners. It is a condition of accessing this publication that users abide by the legal requirements associated with these rights.
• You may freely distribute the URL that is used to identify this publication.
• Users may download and print one copy of the publication from the public portal for the purpose of private study or non-commercial research.
• If a Creative Commons licence is associated with this publication, please consult the terms and conditions cited therein. • Unless otherwise stated, you may not further distribute the material nor use it for the purposes of commercial gain.
Take down policy
If you believe that this document infringes copyright please contact UBIRA@lists.bham.ac.uk providing details and we will remove access to the work immediately and investigate.
ARTICLE COVERSHEET
LWW_CONDENSED-FLA(8.125X10.875)
SERVER-BASED
Template version : 7.7
Revised: 06/30/2015
Article : TA500222
Typesetter : natis
Date : Saturday August 29th 2015
Time : 15:44:22
Thrombin generation and procoagulant microparticle profiles
after acute trauma: A prospective cohort study
AQ1
Myung S.
AQ2
Park, Ailing Xue, Grant M. Spears, Timothy M. Halling, Michael J. Ferrara, Melissa M. Kuntz,
Sabtir K. Dhillon, Donald H. Jenkins, William S. Harmsen, Karla V. Ballman, Paul Harrison,
and
John A. Heit,
Rochester, Minnesota
OBJECTIVE: The two sides of trauma-induced coagulopathy, the hypocoagulable and the hypercoagulable states, are poorly understood. To identify potential mechanisms for venous thromboembolism and bleeding after acute trauma, we estimated changes in cir-culating procoagulant microparticles (MPs) and thrombin activity during hospitalization for trauma.
METHODS: Whole blood was collected by venipuncture into 3.2% trisodium citrate at 0, 6, 12, 24, and 72 hours after injury and discharge. Platelet-poor plasma was harvested and stored atj80-C until analysis. Thrombin generation was determined using the calibrated automated thrombogram (CAT), reported as lag time (minutes), peak height (nM thrombin), and time to reach peak height (ttPeak, minutes). The concentration of total procoagulant MPs (number/KL) was measured by flow cytometry. Data are presented as median (interquartile range [IQR]).
RESULTS: Among 443 trauma patients (1,734 samples; Injury Severity Score [ISS], 13.0 [IQR, 6.0Y22.0]; hospital length of stay, 4.0 days [IQR, 2.0Y10.0]; age, 48 years [IQR, 28Y65]; 70.7% male; 95% with blunt mechanism; mortality, 3.2%), no discernable patterns in thrombin generation or MP concentration were observed over time. The peak height and MPs were significantly different from healthy volunteers and were 337 nM (IQR, 285Y395) and 400/KL plasma (IQR, 211Y772), respectively. Extreme (defined as highest or lowest 5%) values reflecting a possible ‘‘hypercoagulable state’’ (lag timee1.98, peak heightQ486.2, ttPeake3.61, and total procoagulant MPQ2,278) were reached within 12 hours after acute trauma, while extreme values representing a possible ‘‘hypocoagulable state’’ (lag timeQ18.6, peak heighte17.8, and ttPeakQ29.45) were not reached until 1 day to 3 days.
CONCLUSION: Although there was no predictable pattern of coagulopathy observed in each patient after trauma, those who reached extreme values did so relatively early after injury. These findings should be taken into account when designing risk model tools in-volving coagulation laboratory parameters. (J Trauma Acute Care Surg. 2015;00: 00Y00. Copyright*2015 Wolters Kluwer Health, Inc. All rights reserved.)
LEVEL OF EVIDENCE: Diagnostic test study, level III.
KEY WORDS: Trauma; thrombin; microparticle; prospective; cohort.
T
rauma-induced coagulopathy (TIC) detected early after injury reflects injury severity and is prognostic for blood transfusion requirement and death.1,2Maintenance of hemostasis,often with blood products aimed at limiting hemorrhage, comes with the price of increased risk of venous thromboembolism (VTE).3Y5 The two sides of TIC, the hypocoagulable and the
hypercoagulable states, are poorly understood. Existing therapies to treat TIC are based on limited understanding of their mech-anisms. Hence, assays with enhanced sensitivity and specificity are needed to understand the basis for TIC. In a previous study, we noted that the concentration of plasma procoagulant
microparticles (MPs) and peak thrombin generation in patients with blunt trauma correlated with injury severity, while the standard clotting assays (prothrombin time and activated partial thromboplastin time) were within the normal range.6Our
long-term goal was to identify potential mechanisms for VTE and bleeding after acute trauma. In a prospective cohort study, we estimated serial changes in plasma procoagulant MP concen-tration and thrombin generation potential over time among pa-tients hospitalized for acute trauma. We hypothesized that TIC occurs early after injury and it is quantifiable.
PATIENTS AND METHODS
In a prospective cohort study, all trauma patients trans-ported to the Mayo Clinic Emergency Department (ED) by ambulance or air transport from February 2011 to June 2014 were considered for inclusion. Exclusion criteria were age less than 18 years, anticoagulation (e.g., heparin, warfarin) or thrombotic therapy (excluding aspirin or nonsteroidal anti-inflammatory drugs), preexisting coagulopathy, more than 12 hours from time of injury, transfusion of blood products before blood sample collection, active cancer, sepsis, renal failure, burn injuries, or declined consent by the patient or legal guardian. The time of injury was determined by the prehospital medical providers based on information at the injury scene. If the time of
O
RIGINAL
A
RTICLE
J Trauma Acute Care Surg
Copyedited by: Jay Bagcal
Submitted: December 8, 2014, Revised: May 22, 2015, Accepted: May 29, 2015. From the Department of Trauma and Critical Care Surgery (M.S.P., D.H.J.), Depart-ment of Surgery (M.J.F., M.M.K., S.K.D.), Hematology Research (A.X., T.M.H.), Department of Health Sciences Research (G.M.S., W.S.H., K.V.B.), and Depart-ment of Internal Medicine (J.A.H.), Mayo Clinic, Rochester, Minnesota; and University of Birmingham Medical School (P.H.), Birmingham, United Kingdom
AQ3
.The contents of this article are solely the responsibility of the authors and do not nec-essarily represent the official views of the NIH, Department of Defense, and NCRR. Supplemental digital content is available for this article. Direct URL citations appear in the printed text, and links to the digital files are provided in the HTML text of this article on the journal’s Web site (www.jtrauma.com).
Address for reprints: Myung S. Park, MD, Division of Trauma, Critical Care and General Surgery, Mayo Clinic, 200 First St SW, Rochester, MN 55905; email: Park.Myung@mayo.edu.
injury was unclear, the prehospital medical providers estimated the time and relayed this information to the emergency com-munication center. A trauma alert page was then sent to the hospital and laboratory staff as to the time of injury. We collected demographic and baseline clinical characteristics, including In-jury Severity Score (ISS), patient age and sex, body mass index, hospital length of stay, all-cause mortality, and start and stop of anticoagulant-based thromboprophylaxis and other medications affecting coagulation. Transfusion therapy was mainly based not only on Mayo Clinic Trauma Center transfusion guidelines but also at the discretion of the medical provider. Blood samples also were collected for reference (control) analysis from 89 volunteers with no history of thrombosis (i.e., stroke, myocardial infarction, or VTE) or recent antithrombotic (thienopyridine; including aspirin or nonsteroidal anti-inflammatory drugs) or anticoagulant (heparin, low-molecular-weight heparin, warfarin) therapy, who were recruited by advertisement within the Mayo Clinic Em-ployee Portal. This study was approved by the Mayo Clinic In-stitutional Review Board.
Sample Collection and Processing
Blood samples were collected at baseline; at 2, 6, and 12 hours; at 1 and 3 days after injury; and at hospital discharge. When patients were unable to provide consent at the time of the trauma, consent was obtained from the patient or legal guardian within 30 days of hospital discharge; samples were discarded when consent could not be obtained. A total of 18 mL of whole blood was collected by antecubital venipuncture or via existing indwelling catheters into 4.5 mL citrated Vacutainer tubes (0.105-M buffered sodium citrate, 3.2% Becton Dickinson, Plymouth, United Kingdom), processed to platelet free plasma by double centrifugation (3,000 G, 15 minutes) as recommended by the ISTH vascular biology SSC Collaborative Workshop,7and
stored in multiple aliquots atj80-C until analysis. All samples
were processed within 1 hour of collection.
CAT Analyses
Thrombin generation was measured with the CAT (Thrombinoscope BV, Maastricht, the Netherlands), using a Fluoroskan Ascent plate reader (390-nm excitation, 460-nm emission, Thermo Electron Corp, Vantaa, Finland), as previ-ously described by Hemker et al.8,9and Owen et al.10Assays of
trauma patient samples were performed in triplicate. Corn trypsin inhibitor (25 mg/mL) 25 KL (50 Kg/mL, final con-centration) was added to each plasma sample before CAT analyses. Thrombin generation was initiated using two different reagents: addition of 20KL of either PPP (5-pM tissue factor and 4-KM phospholipid, Stago, United States) or PRP (1-pM tissue factor, Stago, US) reagent. Then, 80KL of citrated platelet-poor plasma was added to each well of U-bottom 96-well microtiter plates (Nunc, Thermo Fischer Scientific, Rochester, NY) using a single channel pipette. After an incubation period (10 minutes at 37-C), 20 KL of warmed FLUCA reagent (Fluca kit, TS50, Thrombinoscope, BV), which contains the fluorogenic substrate and CaCl2was added to each well via an automated dispenser.
Thrombin generation curves were recorded continuously for 90 minutes at a rate of three readings per minute. Separate wells containing the thrombin calibrator, which corrects for inner filter effects and quenching variation among individual plasmas, were
also measured in parallel.9A dedicated program, Thrombinoscope,
was used to calculate thrombin activity over time. The parameters derived were lag time (LT), time to peak (ttPeak), and peak height (PH). We did not analyze samples collected after anticoagulant-based (mainly heparin) prophylaxis; we have found that prophy-lactic dose of heparin completely attenuates thrombin generation in CAT analyses. When unfractionated heparin was added, at varying concentrations from 0.1 U/mL to 0.4 U/mL, to platelet-poor plasma (Cryocheck), we noted a significant decrease in PH values (85% decrease) and prolongation of LT (200% increase) even at the lowest dose.
MP Analyses
The flow cytometric assay to measure plasma MPs, without ultracentrifugation, was adapted from the method of Ayers et al.11 The MPs were analyzed by FACSCanto II
flow cytometer (BD Biosciences, San Jose, CA) and using BD Diva Software version 6.0. Samples were run at high flow rate of 120 KL/min. To note, every morning, before patient sample analyses, filtered HEPES-buffered saline (HBS) buffers with and without antibodies were analyzed to be sure the reagents were free of contaminants. Fluorbrite beads of 0.2Km to 2.0Km in 1:10,000 dilution of HBS buffers were analyzed to ensure the instrument was optimized for gating on MPs, which were defined in this study as events less than 1Km in diameter and positive for Annexin V (procoagulant) and cell-specific markers.
To establish procoagulant properties of the MP, a dual-labeling procedure was used. For each sample analysis, 100KL of test plasma samples were diluted with 890KL of filtered HBS (pH 7.4) and 10KL of Hirudin (to achieve final concentration of 1KM) was added to prevent clot formation. Then, all the samples were stained with 4-KL fluorochrome-labeled Annexin VYFITC (BD Pharmingen, 556420) monoclonal antibody, which binds to procoagulant phosphatidylserine (Annexin V) expressed on MP, and either 4KL of R-phycoerythrin (PE)Ylabeled monoclonal an-tibody to CD42a, which binds to single chain integral membrane glycoprotein, GPIX, on platelet-derived MPs (BD Pharmingen, 558819 or 561853) or 4KL of IgG PE (isotype control). Following 30-minute incubation of samples with the antibodies, 800KL of filtered HBS-Ca was added as well as 100-KL Trucount beads (BD Biosciences). Each tube was run for a minimum of 300 seconds or until 1,500 events were collected in the Trucount bead gate. Trucount beads facilitated the accurate calculation of MP absolute numbers, using the following formula:
AQ4
Absolute count of cell population¼ Number of events in quadrant containing cell population Number of events in absolute count bead region
Total number of beads per test* Test volume
An MP gate on a flow cytometry plot of forward scatter versus side scatter was used to distinguish MP from small platelets, as previously published.12,13All buffers were filtered
twice through Millex-GP 33-mm filters in preparation of daily sample analyses. All antibodies were also filtered twice through 0.2-Km membrane filters. Unfiltered buffers and antibodies contain interfering numbers of chemical MPs (data not shown). In addition, we used a commercially available reference plasma, Cryocheck (Precision Biologic, Dartmouth, NS), which was analyzed with every carousel of patient samples to ensure that our technique for MP analysis was consistent. The overall mean J Trauma Acute Care Surg Volume 00, Number 00
Park et al.
of AnnV pos MP counts in Cryocheck was calculated to be 3,046/KLT574/KL plasma
AQ5
. Between two experienced researchtechnologists, the range of coefficient of variation using this reference plasma has consistently been 15% to 23%. With the use of the compensation setup feature of DIVA software (V6, BD Biosciences), compensation was determined by running unstained and single-color positive control samples following the manufacturer’s recommendations.
Statistical Analyses
Data analysis was performed using SAS version 9.3 (SAS Institute Inc, Cary, NC) and R version 3.0.2. Descriptive statistics are presented as median (interquartile range). A comparison of continuous variables between trauma patients and volunteers (controls) was performed using analysis of variance, the dependent variable being the ranked laboratory value and including age and sex in the model as additional independent variables. ‘‘Ex-treme’’ values were defined as the greatest or lowest 5% of values, regardless of patient or the time of sample acquisition relative to the time of injury. For each laboratory parameter, the most
‘‘hypercoagulable’’ value within the first 24 hours for each patient was identified; this was defined as the lowest 5% LT and ttPeak, the greatest 5% PH and MP counts. The most ‘‘hypocoagulable’’ value was defined as values at the other end of extreme 5%. The> level was set at 0.05 for statistical significance.
RESULTS
From February 2011 through April 2014, we screened 2,106 patients and 1,418 met inclusion criteria. Of these eligible patients, 288 declined to participate, 332 patients did not return mail-in consents, and their study samples were discarded. Of the 798 enrolled, we randomly analyzed blood samples of 443 pa-tients; to assess for existence of discernible pattern in thrombin generation and MP counts after injury. The number of patient samples analyzed at each time point was as follows: (1) 228 baseline, (2) 368 at 6 hours, (3) 391 at 12 hours, (4) 310 at 24 hours, (5) 210 on Day 3, and (6) 155 on the day of discharge. Demo-graphic data are displayed inTable 1. Of the 443 patients sampled, T1 90 were transfused within the first 24 hours after arrival to our trauma center. The median among the patients who received each type of blood product within this time frame were as follows: packed red blood cells (RBCs) 4 (IQR, 2Y7), frozen or thawed plasma 5 (IQR, 2Y6), platelets 2 (IQR, 1Y2), and cryoprecipitate 2 (IQR, 1Y2).
Comparison of Laboratory Values Between
Trauma Patients and Volunteers
The median patient and volunteer ages were 48 years (IQR, 28Y65) and 40 years (IQR, 27Y53) (p = 0.002), re-spectively; 71% and 49% of trauma patients and volunteers, respectively, were men (p G 0.001). For both PPP and PRP, thrombin PH and ttPeak were significantly greater and shorter, respectively, as compared with volunteers, while the LT did not differ significantly using PPP reagent. These samples from trauma patients also had significantly greater procoagulant MP levels in peripheral blood even after adjusting for age and sex (Table 2). We also observed a wide variance of thrombin T2 generation and MP levels as compared with healthy volun-teers (see Figures, Supplementary Digital Contents 1 and 2, http://links.lww.com/TA/A638).
TABLE 1. Demographic and Baseline Characteristics of 443 Trauma Patients
Age at trauma, median (IQR), y 48 (28Y65)
Male sex, n (%) 313 (70.7)
Blunt mechanism, n (%) 423 (95.5)
ISS, median (IQR) 13.0 (6.0Y22.0)
Hospital length of stay, median (IQR), d 4.0 (2.0Y10.0)
Death, n (%) 14 (3.2)
International normalized ratio (admission), median (IQR) 1.0 (1.0Y1.1) Partial thromboplastin time (admission), median (IQR), s 26.0 (24.0Y29.0) Hemoglobin (admission), median (IQR), g/dL 13.7 (12.0Y14.8) Red blood cell, median (IQR) (first 24 h of arrival),* U 4 (2Y7) Plasma median (IQR) (first 24 h of arrival)* 5 (2Y6) Platelet median (IQR) (first 24 h of arrival),* U 2 (1Y2) Cryoprecipitate median (IQR) (first 24 h of arrival),* U 2 (1Y2) Tranexamic acid administration in prehospital or ED (%) 10 (2.3) Bebulin (PCC) infusion in prehospital or ED (%) 4 (1)
*Median (IQR) among the patients who received each type of blood product within the first 24 hours of arrival (77 patients received red blood cells, 53 patients received plasma, 51 patients received platelets, and 14 patients received cryoprecipitate).
TABLE 2. Comparison of Laboratory Values between Trauma Patients and Uninjured Screened Volunteers (Adjusted for Sex and Age)
Variable Patient, Median (IQR) Volunteer, Median (IQR) p 5-pM TF/4-KM PS (PPP reagent) LT, min 2.67 (2.38Y3.27) 2.67 (2.33Y2.96) 0.320 PH, nM 337.6 (285.9Y395.6) 320.6 (287.0Y343.9) 0.0081 ttPeak, min 4.73 (4.19Y5.56) 5.11 (4.61Y5.67) G0.0001 1-pM TF (PRP reagent) LT, min 8.34 (6.89Y10.56) 9.00 (8.00Y10.07) G0.001 PH, nM 49.2 (33.9Y71.4) 25.6 (19.8Y34.1) G0.0001 ttPeak, min 17.19 (14.55Y20.22) 20.56 (18.56Y22.78) G0.0001
Total procoagulant MPs (number/KL plasma) 401 (212Y772) 241 (146Y530) 0.0015
Platelet-derived procoagulant MPs (number/KL plasma)*
AQ6
19.4 (10.6Y40.8) 31.6 (13.1Y65.8) 0.0023PS, phospholipid; TF, tissue factor.
J Trauma Acute Care Surg
Trend Over Time and Time To Reach
Extreme Values
The plots of each individual patient’s thrombin activity and MP counts over time did not exhibit a discernable pattern; each patient displayed a unique pattern after injury (see Figure, Sup-plementary Digital Content 3aYd, http://links.lww.com/TA/A638). Since no particular trends in the serial blood analyses of individual patients were observed, extreme (defined as highest or lowest 5%) values reflecting a possible ‘‘hypercoagulable state’’ (
T3 Tables 3Y
T5
5) and ‘‘hypocoagulable state’’ were calculated (Tables 3 and T4
4). We observed that the hypercoagulable extreme values were reached within 12 hours after acute trauma, while hypocoagulable extreme values were not reached until 1 day to 3 days.
Comparisons of CAT and MP Values
With Degrees of Injury Severity and
Blood Transfusions
Among the cohort of 443 patients, 261 patients presented with ISS of less than 15, 96 patients presented with ISS of 15 to 24, and 86 patients had severe injury with ISS of 25 or greater. We observed that shortened LT, decreased PH, and ttPeak were found to be associated with greater injury severity (
T6 Table 6).
However, there were no significant differences between these groups of patients with regard to MP counts. There were no overall significant differences in CAT and MP values between those who received any blood type transfusion and those who did not.
DISCUSSION
In this study, we have observed that endogenous thrombin generation and circulating procoagulant MP are significantly different in trauma patients when compared with volunteers. In particular, PH and ttPeak values were greater and lesser, re-spectively, in the trauma patients relative to the volunteers. Hence, patients exhibit acceleration of thrombin generation, indicating that the plasma coagulome is important in generating the hyper-coagulable milieu needed for thrombotic complications. As injury severity increased, a shortened LTand ttPeak were observed, which are consistent with accelerated rate of thrombin generation.
In our cohort study, serial blood draws, relative to time of injury, were obtained from trauma patients until their discharge. In so doing, we did not observe any discernible pattern over
time for individual patient-level thrombin activity and MP counts. Curry et al.14recently showed, in their pilot study of
50 patients, an increase in peak thrombin generation imme-diately after trauma admission as compared with the values at the time of admission. However, the mean time from injury to admission was not specified. Similarly, Matijevic et al.15
de-scribe their findings of cellular MPs and thrombogram in patients enrolled in the Prospective Multicenter Major Trauma Transfu-sion (PROMMTT) study. They only collected one time blood sample at the time of admission for trauma, but the time at which these samples were collected relative to the time of injury is not specified. Obtaining blood relative to time of injury is important because it allows us to gain a better understanding of where, in the time continuum of injury response, a patient may reside. Regardless, this study supports the findings of these other in-vestigators who have shown that thrombin generation and procoagulant MP counts are altered after trauma as compared with noninjured volunteers.7,14,15
Thrombin Generation Assay
CAT is a functional assay of global thrombin generation. It measures the rate of thrombin generation and inhibition in citrated plasma and has been used to quantify procoagulant activity in several diseases including VTE and coronary artery disease.16Y18In our previous pilot study, we performed native
thrombin generation assays, as initially described by Dunbar and Chandler,19in which no agonist such as tissue factor or phospholipid source (PCPS) was added. The role of CAT in clinical practice has yet to be defined largely because of a lack of official standardization of the assay with its associated large interlaboratory variability. However, Dargaud et al.20were able
to reduce assay variability when assays were performed using TABLE 3. Time to Extreme Values for CAT Data Using
PPP*Reagent
Variable n Extreme 5% Value Time to Extreme Value, d
Hypercoagulable LT, min 1,575 e1.98 0.32 (0.12Y0.50) PH, nM 1,575 Q486.2 0.50 (0.09Y2.97) ttPeak, min 1,575 e3.61 0.32 (0.24Y0.59) Hypocoagulable LT, min 1,575 Q5.00 2.95 (1.03Y7.27) PH, nM 1,575 e194.6 0.97 (0.49Y3.08) ttPeak, min 1,575 Q8.00 2.95 (0.93Y6.68) *PPP, 5-pM TF/4-KM PS. PS, phospholipid; TF, tissue factor.
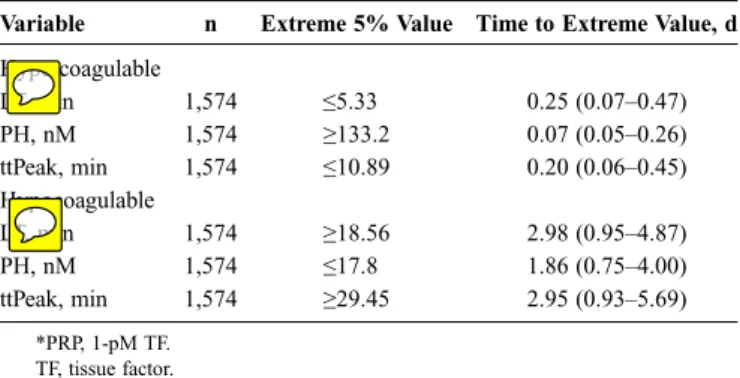
TABLE 4. Time to Extreme Values for CAT Data Using PRP*Reagent
Variable n Extreme 5% Value Time to Extreme Value, d
Hypercoagulable LT, min 1,574 e5.33 0.25 (0.07Y0.47) PH, nM 1,574 Q133.2 0.07 (0.05Y0.26) ttPeak, min 1,574 e10.89 0.20 (0.06Y0.45) Hypocoagulable LT, min 1,574 Q18.56 2.98 (0.95Y4.87) PH, nM 1,574 e17.8 1.86 (0.75Y4.00) ttPeak, min 1,574 Q29.45 2.95 (0.93Y5.69) *PRP, 1-pM TF. TF, tissue factor.
TABLE 5. Time to Extreme Values for MPs
Variable n Extreme 5% Value Time to Extreme Value, d CD42+, procoagulant MPs (/KL plasma)* 1,734 Q126 0.55 (0.25Y4.06) Total procoagulant MPs (/KL plasma) 1,734 Q2,278 0.25 (0.05Y1.98)
*CD42+, procoagulant MPs, Annexin V+ MPs derived from platelets only.
J Trauma Acute Care Surg Volume 00, Number 00
Park et al.
identical equipment, standardized reagents, and carefully se-lected reference plasma for normalization of results. We have previously demonstrated that CAT assays can be performed with reproducible results when commercially available reference plasma is used with every patient sample runs.21In addition, the
presence of lot-to-lot variability of PPP and PRP reagents have to be taken into account if CAT data are to be used to make clinical correlations. In brief, we plan to perform experiments that hopefully will begin to dissect the procoagulant and antico-agulant activities accounting for the observed net thrombin gen-eration response after trauma. The investigators of Trans-Agency Research Consortium for Trauma-Induced Coagulopathy (TAC-TIC) study 1-UM-1-HL120877-2 have begun the performance of comprehensive analyses of coagulation and inflammation profiles in trauma patients. Hopefully, this multicenter multidisciplinary team of physicians and scientists can enhance our understanding of the mechanisms for the development of coagulopathy in trauma patients after injury.
MP Analyses by Flow Cytometry
MPs are found in healthy individuals. In normal plasma, MP derived from platelets are the most common (980%), followed by MPs derived from endothelial cells (G10%) and leukocytes (G10%).22Thrombogenic potential of MPs that
ex-press surface phosphatidylserine (Annexin V+) are procoagulant in vitro.13,22,23Thus, endogenous MPs expressing membrane
phosphatidylserine may not contribute intrinsically to throm-bosis but may drive thromthrom-bosis in an environment where procoagulant enzymes are generated, such as would be expected in peripheral blood of patients after major trauma.7In this study, MP analyses were limited to Annexin VYbinding (procoagulant) MPs, some of which are derived from platelets. Further evalu-ation needs to be performed to quantify the number and subtypes of MPs present in our bank of stored samples. Curry et al. quantified subtypes of MPs in platelet-poor plasma without ul-tracentrifugation. We adopted their technique as data variability became significantly less when ultrancentrifugation step was omitted. Curry et al. found significantly greater red blood cell, procoagulant (Annexin V+) MPs, and decrease in endothelial cellYderived MPs. As compared with their 41 survivors, the 9 nonsurvivors had significant decrease in platelet-derived procoagulant MPs. As performed by Curry et al., we have used the recommendations within the ISTH SSC guidance for standardization of MP analysis.24 Similar to CAT assays, an
obstacle to translating MP analysis methods into the clinical arena is the lack of standardization that has been uniformly ac-cepted by the research community. Namely, there is a lack of consensus with regard to MP analyses performed using identical equipment, standardized reagents, and carefully selected refer-ence plasma for normalization of results. This is an area of re-search in dynamic flux, and it remains to be determined if characterization of procoagulant MPs could find practical ap-plications in the clinical arena.
Limitations
Our study has several limitations. First, our definitions of hypercoagulable or hypocoagulable states were arbitrary. We chose the greatest or least 5% of thrombin generation variables to define hypercoagulable and hypocoagulable states, respectively. With regard to total procoagulant MPs, we defined plasma samples with the greatest number (in the top 5%) to be hyper-coagulable. Second, the patients enrolled in this study were not consecutive admissions because our overall consent rate was approximately 60%. Lastly, we did not stratify our findings based on fluid administration and blood transfusions, which may affect our findings secondary to hemodilution or alteration of coagu-lation secondary to blood product administration.
AQ7
CONCLUSION
In this prospective cohort study, we observed an increase in thrombin generation by CAT and procoagulant MPs after injury. Although there was no predictable pattern of coagulopathy ob-served in each patient after acute trauma, patients who reached extreme values did so relatively early after injury. These findings should inform the design of risk model tools involving coagu-lation laboratory parameters. Challenges remain regarding the lack of standardization and lack of reference controls to allow reproducibility of data among different centers. Hence, it remains to be determined if thrombin assays by CAT and characterization of procoagulant MPs could find practical applications as diag-nostic indicators of postinjury TIC.
AUTHORSHIP
M.S.P. contributed in the study design, enrollment of patients, literature search, data collection and analysis, data interpretation, manuscript preparation, and manuscript critical revision. P.H. contributed in the MP assay development, literature search, data interpretation, manuscript preparation, and manuscript critical revision. G.M.S. contributed in the data analysis, database design, data interpretation, and manuscript
TABLE 6. Comparisons of CAT and MP Values With Degrees of Injury Severity
Variable ISSG15 (n = 261) ISS, 15Y24 (n = 96) ISSQ25 (n = 86) p 5-pM TF/4-KM PS (PPP reagent) LT, min 2.79 (2.38Y3.33) 2.67 (2.33Y3.11) 2.67 (2.20Y3.36) G0.0001 PH, nM 342.6 (293.2Y396.8) 347.4 (290.2Y409.9) 319.4 (267.6Y376.2) G0.0001 ttPeak, min 4.94 (4.33Y5.78) 4.56 (4.06Y5.14) 4.52 (3.92Y5.30) G0.0001 1-pM TF (PRP reagent) LT, min 8.67 (7.11Y11.00) 7.86 (6.67Y10.22) 8.22 (6.64Y10.21) G0.0001 PH, nM 46.9 (33.2Y68.1) 49.8 (34.0Y73.4) 52.4 (35.9Y77.5) 0.0071 ttPeak, min 17.89 (15.33Y21.00) 16.70 (14.05Y19.36) 15.97 (13.56Y18.84) G0.0001 Total procoagulant MPs (/KL plasma) 405.6 (211.5Y786.9) 424.3 (237.9Y770.7) 372.7 (197.8Y758.3) 0.370 CD42+, procoagulant MPs (/KL plasma)* 20.6 (11.1Y42.1) 18.5 (9.9Y36.1) 19.0 (9.1Y42.9) 0.0520
*CD42+, procoagulant MPs, platelet-derived, procoagulant MPs. PS, phospholipid; TF, tissue factor.
J Trauma Acute Care Surg
preparation. A.X. contributed in the performance of assays, data collec-tion, data interpretacollec-tion, and manuscript preparation. T.M.H. contributed in the performance of assays, data collection, data interpretation, and manuscript preparation. M.J.F. contributed in the enrollment of patients, database design, data collection, and manuscript preparation. M.M.K. contributed in the enrollment of patients, database design, data collection, and manuscript preparation. S.K.D. contributed in the database design and data collection. D.H.J. contributed in the enrollment of patients, manuscript preparation, and manuscript critical revision. W.S.H. contrib-uted in the study design, data analysis, data interpretation, and manuscript preparation. K.V.B. contributed in the data analysis, manuscript preparation, and manuscript critical revision. J.A.H. contributed in the study design, lit-erature search, data analysis, data interpretation, manuscript preparation, and manuscript critical revision.
ACKNOWLEDGMENT
We thank the research coordinators Amy Headlee, LPN, Teron T. Cox, and Debbie A. Dixon for the patient recruitment and data collection; Nancy C. Hawley, RN, CCTC, Maria Nacionales, and Matthew J. Hangge of the Clinical Research Unit of the Center for Translational Science Activities for the support in blood sample collection and processing; Robert D. Litwiller and Teresa K. Kimlinger of the Hematology Research Laboratory, Mayo Clinic, Rochester, Minnesota, for their technical as-sistance in sample analyses; and Mayo Clinic Medical Transport and the Mayo 1 Medical Director, Scott P. Zietlow, MD, and Kathleen S. Berns, MS, RN, CNS, for their support in the patient recruitment and blood sample collection.
DISCLOSURE
This study was supported by Grant Number K08 GM093133-05 (MSP) from the National Institute of General Medical Sciences (NIGMS), W81XWH-10-2-2010 (M.S.P.) from the Telemedicine and Advanced Technology Research Center (TATRC) of the Department of Defense, 1 UL1 RR024150 from the National Center for Research Resources (NCRR), a component of the National Institutes of Health (NIH), the NIH Roadmap for Medical Research, and by Grant Number UL1 TR000135 from the National Center for Advancing Translational Sciences (NCATS).
REFERENCES
1. Brohi K, Singh J, Heron M, Coats T. Acute traumatic coagulopathy.
J Trauma. 2003;54:1127Y1130.
2. Kaufmann CR, Dwyer KM, Crews JD, Dols SJ, Trask AL. Usefulness of thrombelastography in assessment of trauma patient coagulation.J Trauma. 1997;42:716Y720.
3. Schreiber MA, Differding J, Thorborg P, Mayberry JC, Mullins RJ. Hypercoagulability is most prevalent early after injury and in female pa-tients.J Trauma. 2005;58:475Y480.
4. Geerts WH, Code KI, Jay RM, Chen E, Szalai JP. A prospective study of venous thromboembolism after major trauma.N Engl J Med. 1994;331:1601Y1606. 5. Park MS, Martini WZ, Dubick MA, Salinas J, Butenas S, Kheirabadi BS,
Pusateri AE, Vos JA, Guymon CH, Wolf SE, Mann KG, Holcomb JB. Thromboelastography as a better indicator of hypercoagulable state after injury than prothrombin time or activated partial thromboplastin time.J Trauma. 2009;67:266Y275.
6. Park MS, Owen BA, Ballinger BA, Sarr MG, Schiller HJ, Zietlow SP, Jenkins DH, Ereth MH, Owen WG, Heit JA. Quantification of hypercoagulable state after blunt trauma: microparticle and thrombin generation are increased relative to injury severity, while standard markers are not.Surgery. 2012; 151:831Y836.
7. Lacroix R, Judicone C, Mooberry M. Standardization of pre-analytical variables in plasma microparticle determination: results of the International Society on Thrombosis and haemostasis SSC Collaborative workshop.J Thromb Haemost. 2013;11:1190Y1193.
8. Hemker HC. Recollections on thrombin generation.J Thromb Haemost. 2008;6:219Y226.
9. Hemker HC, Al Dieri R, De Smedt E, Beguin S. Thrombin generation, a function test of the haemostatic-thrombotic system. Thromb Haemost. 2006;96:553Y561.
10. Owen BA, Xue A, Heit JA, Owen WG. Procoagulant activity, but not number, of microparticles increases with age and in individuals after a single venous thromboembolism.Thromb Res. 2011;127:39Y46. 11. Ayers L, Kohler M, Harrison P, Sargent I, Dragovic R, Schaap M,
Nieuwland R, Brooks SA, Ferry B. Measurement of circulating cell-derived microparticles by flow cytometry: sources of variability within the assay.Thromb Res. 2011;127:370Y377.
12. Dhillon SK, Houck ML, Jenkins DH, Rosedahl JK, Harmsen WS, Halling TM, Park MS. Transfusion of stored red blood cells in trauma patients is not associated with increased procoagulant microparticles.J Trauma Acute Care Surg. 2014;77(5):674Y678.
13. Jayachandran M, Litwiller RD, Owen WG, Heit JA, Behrenbeck T, Mulvagh SL, Araoz PA, Budoff MJ, Harman SM, Miller VM. Charac-terization of blood borne microparticles as markers of premature coronary calcification in newly menopausal women. Am J Physiol Heart Circ Physiol. 2008;295:H931YH938.
14. Curry N, Raja A, Beavis J, Stanworth S, Harrison P. Levels of procoagulant microvesicles are elevated after traumatic injury and platelet microvesicles are negatively correlated with mortality.J Extracell Vesicles. 2014;3:25625. 15. Matijevic N, Wang YW, Wade CE, Holcomb JB, Cotton BA, Schreiber
MA, Muskat P, Fox EE, Del Junco DJ, Cardenas JC, Rahbar MH, Cohen MJ; PROMMTT Study Group. Cellular microparticle and thrombogram phenotypes in the Prospective Observational Multicenter Major Trauma Transfusion (PROMMTT) study: correlation with coagulopathy.Thromb Res. 2014;134:652Y658.
16. Eichinger S, Hron G, Kollars M, Kyrle PA. Prediction of recurrent venous thromboembolism by endogenous thrombin potential andD-dimer.Clin Chem. 2008;54(12):2042Y2048.
17. Tripodi A, Legnani C, Palareti G, Chantarangkul V, Mannucci PM. More on: high thrombin generation and the risk of recurrent venous thrombo-embolism.J Thromb Haemost. 2009;7:906Y907.
18. Sossdorf M, Ko¨nig V, Gummert J, Marx G, Lo¨sche W. Correlations be-tween platelet-derived microvesicles and thrombin generation in patients with coronary artery disease.Platelets. 2008;19(6):476Y477.
19. Dunbar NM, Chandler WL. Thrombin generation in trauma patients.
Transfusion. 2009;49(12):2652Y2660.
20. Dargaud Y, Wolberg AS, Luddington R, Regnault V, Spronk H, Baglin T, Lecompte T, Ten Cate H, Negrier C. Evaluation of a standardized protocol for thrombin generation measurement using the calibrated automated thrombogram: an international multicentre study.Thromb Res. 2012;130:929Y934. 21. Park MS, Xue A, Rosedahl JK, Harmsen WS, Kuntz MM, Heit JA. Timing
of corn trypsin inhibitor to platelet poor plasma alters thrombin generation.
J Thromb Haemost. 2014;12:63.
22. Berckmans RJ, Nieuwland R, Bo¨ing AN, Romijn FP, Hack CE, Sturk A. Cell-derived microparticles circulate in healthy humans and support low grade thrombin generation.Thromb Haemost. 2001;85:639Y646. 23. Morel O, Toti F, Hugel B, Bakouboula B, Camoin-Jau L, Dignat-George F,
Freyssinet JM. Procoagulant microparticles: disrupting the vascular homeo-stasis equation?Arterioscler Thromb Vasc Biol. 2006;26(12):2594Y2604. 24. Lacroix R, Robert S, Poncelet P, Kasthuri RS, Key NS, Dignat-George F,
ISTH SSC Workshop. Standardization of platelet-derived microparticle enumeration by flow cytometry with calibrated beads: results of the In-ternational Society on Thrombosis and Haemostasis SSC Collaborative workshop.J Thromb Haemost. 2010;8:2571Y2574.
J Trauma Acute Care Surg Volume 00, Number 00
Park et al.