Microsoft Dynamics
®GP 2010
Report Writer User’s Guide
Copyright Copyright © 2011 Microsoft Corporation. All rights reserved.
Limitation of liability This document is provided “as-is”. Information and views expressed in this document, including URL and other Internet Web site references, may change without notice. You bear the risk of using it.
Some examples depicted herein are provided for illustration only and are fictitious. No real association or connection is intended or should be inferred.
Intellectual property This document does not provide you with any legal rights to any intellectual property in any Microsoft product.
You may copy and use this document for your internal, reference purposes.
Trademarks Microsoft, Dexterity, Excel, Microsoft Dynamics, Visual Basic, Windows, and Windows Vista are trademarks of the Microsoft group of companies. FairCom and c-tree Plus are trademarks of FairCom Corporation and are registered in the United States and other countries.
All other trademarks are property of their respective owners.
Warranty disclaimer Microsoft Corporation disclaims any warranty regarding the sample code contained in this documentation, including the warranties of merchantability and fitness for a particular purpose. License agreement Use of this product is covered by a license agreement provided with the software product. If you
have any questions, please call the Microsoft Dynamics GPCustomer Assistance Department at 800-456-0025 (in the U.S. or Canada) or +1-701-281-6500.
Contents
Introduction
...2
What’s in this manual ... 2
Symbols and conventions... 3
Product support ... 3
Part 1: Basics
...6
Chapter 1: Getting Started with the Report Writer
...7
Report Writer tasks ... 7
Terminology... 8
Storing reports... 8
Starting the Report Writer ... 9
Chapter 2: The Report Writer Interface
...11
The main window and toolbar ... 11
Menus ... 11
Windows ... 13
Standard buttons... 15
Part 2: Creating Reports
...18
Chapter 3: Report Definition
...19
Creating a new report definition ... 19
Report options... 22
Printing a report definition ... 25
Chapter 4: Report Layout
...27
Creating a report layout... 27
Layout sections... 28
The Toolbox ... 30
Adding fields to a report layout ... 33
The Properties window... 34
Report properties ... 35
Field properties ... 36
C O N T E N T S
Report field characteristics ... 38
Applying drawing options ... 40
Chapter 5: Sorting
...43
Using a main table key ... 43
Creating a sorting definition ... 43
Chapter 6: Restrictions
...47
Defining report restrictions ... 47
Restriction functions ... 49
Chapter 7: Calculated Fields
...57
Creating a calculated field ... 58
Operators... 59 Fields tab ... 61 Constants tab ... 63 Functions tab... 63 System-defined functions ... 64 User-defined functions ... 69
Chapter 8: Additional Headers and Footers
...71
Overview of headers and footers... 71
The order of headers and footers... 72
Creating additional headers or footers ... 73
Chapter 9: Legends
...77
Using legends ... 77
Legends example... 78
Chapter 10: Modifying Fields
...79
Field visibility ... 79
Specifying a format resource ... 80
Specifying a format field ... 81
Changing display types ... 82
C O N T E N T S
Part 3: Gathering Data
...88
Chapter 11: Data Storage
...89
Terminology... 89
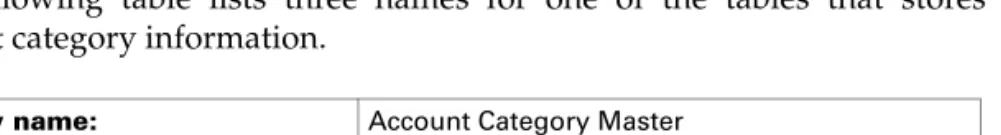
Table names ... 92
Table types ... 93
Table groups ... 93
Chapter 12: Table Relationships
...95
Table relationship overview ... 95
Types of table relationships... 95
Defining a table relationship... 96
Chapter 13: Virtual Tables
...101
Virtual table overview... 101
Viewing virtual table information... 101
Using virtual tables with reports... 102
Part 4: Modifying Reports
...104
Chapter 14: Selecting a Report to Modify
...105
Finding a report name... 105
Creating a modified report... 106
Modifying the current report ... 106
Chapter 15: Viewing a Modified Report
...109
Viewing from the Report Writer ... 109
Viewing from the application ... 110
Chapter 16: Common Modifications
...113
Modifying the layout... 113
Changing the page orientation ... 114
Adding or removing fields... 114
Using VBA with reports ... 115
C O N T E N T S
Part 5: Global Modifications
...118
Chapter 17: Data Types
...119
Opening a data type ...119
Keyable length ... 120 Static values ... 120 Format... 121
Chapter 18: Formats
...123
Opening a format ... 123 Formatting options ... 124 Format string ... 125Chapter 19: Global Fields
...127
Opening a global field ... 127
Opening a field’s data type... 128
Chapter 20: Pictures
...129
Adding a picture to the picture library ... 129
Using a picture from the picture library ... 130
Guidelines for using logos ... 131
Chapter 21: Strings
...133
Using strings ... 133 Modifying a string ... 133Chapter 22: Tables
...135
Table elements ... 135 Keys... 136 Key segments ... 136 Key options ... 137 Segment options ... 137Part 6: Printing and Mailing Reports
...140
Chapter 23: Printing Reports
...141
Printing modified reports ... 141
Printing custom reports... 142
C O N T E N T S
Chapter 24: Mailing Reports
...147
MAPI... 147
Attachment types... 147
Mailing a report ... 148
Chapter 25: Exporting Data
...149
Export formats... 149
Creating reports for exporting ... 150
Part 7: Report Design
...152
Chapter 26: Report Design Guidelines
...153
Report design ... 153
Optimizing reports ... 155
Chapter 27: Preprinted Forms
...157
Report definition settings ... 157
Report layout... 158
Printing preprinted reports ... 159
Chapter 28: Groups
...161
Group overview ... 161
Sorting for groups... 162
Group headers... 162
Group footers ... 163
Counting items in a group... 164
Counting groups ... 164
Totaling and subtotaling ... 165
Advanced groups ... 166
Chapter 29: Checks, Invoices, and Labels
...167
Checks ... 167
Invoices... 169
C O N T E N T S
Part 8: Storing and Accessing Reports
...172
Chapter 30: Storing Reports
...173
Reports dictionary... 173
Launch file... 174
Report Writer configurations... 175
Chapter 31: Accessing Reports
...177
Accessing the Report Writer ... 177
Accessing modified reports ... 178
Accessing custom reports ... 179
Accessing third-party reports... 180
Removing modified reports... 182
Chapter 32: Packaging Reports
...183
Package files... 183
Exporting a package file... 184
Importing a package file ... 185
Package file import/export issues... 186
Chapter 33: Importing Reports
...187
Importing from a reports dictionary ... 187
Validating reports... 188
Part 9: Word Templates
...192
Chapter 34: Overview of Word Templates
...193
Template-enabled reports ... 193
Report definition ... 194
Report template document ... 194
How Word Templates are processed ... 195
Capabilities of Word templates ... 196
Chapter 35: Setting Up Microsoft Word
...197
Add-in for Microsoft Word ... 197
C O N T E N T S
Chapter 36: Report Template Design
...201
Document structure... 201
Creating a report template layout with tables... 203
Fields, captions, and legends ... 205
Bookmarks ... 207
Company image... 208
Tips for working with report template documents ... 209
Common report template patterns... 210
Chapter 37: Creating Report Templates
...213
Overview of creating report template documents... 213
Creating a new report template document ... 213
Chapter 38: Report Templates for Modified Reports
...217
Modifying the report definition... 217
Creating a modified report template document ... 218
Using the modified report template document... 221
Updating the data source for a report template... 223
Chapter 39: Troubleshooting Templates
...225
Template layout issues ... 225
Template processing issues ... 226
Appendix
...230
Appendix A: User-defined Functions
...231
Glossary
...235
Introduction
Welcome to the Report Writer, the tool you can use to create and customize reports. With the Report Writer, you can change the appearance of existing reports, make global changes that affect all reports, or create your own new reports. If you have the Modifier with Visual Basic® for Applications (VBA), you can use scripting to further customize your reports.
What’s in this manual
This manual is designed to give you an in-depth understanding of how to use the Report Writer to customize and create new reports in the accounting system.
• Part 1, Basics, describes how to get started with the Report Writer, and describes the Report Writer interface.
• Part 2, Creating Reports, explains how to create the various elements that make up a report.
• Part 3, Gathering Data, describes how data is stored in the accounting system and how to assemble the data you need to create a report. • Part 4, Modifying Reports, explains how to modify existing reports in
the accounting system.
• Part 5, Global Modifications, explains how to make modifications that affect all reports in the application.
• Part 6, Printing and Mailing Reports, describes how to print reports, export data from them, and mail them to other users.
• Part 7, Report Design, provides guidelines for creating reports and describes common design elements of reports.
• Part 8, Storing and Accessing Reports, describes the Reports dictio-nary. It also explains how to control access to reports you have modi-fied with the Report Writer. Packaging reports is also described.
You can also refer to the Report Writer online help for more information about using the Report Writer. The sample reports available for Microsoft Dynamics GP are another good source of information.
I N T R O D U C T I O N
Symbols and conventions
To help you use the Report Writer documentation more effectively, we’ve used the following symbols and conventions within the text to make specific types of information stand out.
Product support
Technical support for the Report Writer can be accessed using the following methods.
• Telephone support – Technical Support at (888) 477-7877 between 8:00 a.m. and 5:00 p.m. Central Time, Monday through Friday. International users can contact Technical Support at (701) 281-0555.
• Internet – Report Writer Technical Support is also available online through CustomerSource or PartnerSource, and is accessible from www.microsoft.com/Dynamics/GP.
Symbol Description
The light bulb symbol indicates helpful tips, shortcuts and suggestions.
Warnings indicate situations you should be aware of when using the Report Writer.
Margin notes summarize important information.
Margin notes call attention to critical
information, and direct you to other areas of the documentation where a topic is explained.
Convention Description
Part 1, Basics Bold type indicates a part name.
Chapter 5, “Sorting” Quotation marks indicate a chapter name.
Applying drawing options Italicized type indicate a section name.
Software Development Kit (SDK)
Acronyms are spelled out the first time they’re used.
TAB or ALT+M Small capital letters indicate a key or a key
Part 1: Basics
This portion of the documentation contains basic information you should know before you begin using the Report Writer. The following information is discussed:
• Chapter 1, “Getting Started with the Report Writer,” describes the basic tasks you can perform with the Report Writer, the terminology used to describe reports, and how reports are stored. It also describes how to start the Report Writer.
• Chapter 2, “The Report Writer Interface,” describes the interface for the Report Writer.
Chapter 1:
Getting Started with the Report
Writer
Before you begin working with the Report Writer, you should have a basic understanding of the types of tasks you can perform, terminology used in the Report Writer, and how reports are stored. Information is divided into the following sections:
• Report Writer tasks
• Terminology
• Storing reports
• Starting the Report Writer
Report Writer tasks
You can use the Report Writer to perform three basic tasks: Modifying existing reports, creating new reports, and making global changes for reports.
Modifying existing reports
With the Report Writer, you can change the appearance of individual reports in the accounting system. This allows you to customize your system to meet your specific needs. For instance, a common modification is changing the layout of an invoice to match the invoice format you currently use.
Creating new reports
Though many predefined reports are included with the accounting system, a specific report you need may not be available. You can use the Report Writer to create new reports for the accounting system.
Making global report changes
The Report Writer also allows you to make changes that will be reflected in reports throughout the accounting system. For example, most of the strings that are displayed in reports can be modified. If you were to modify the string “ZIP Code” and change it to be “Postal Code”, the change would be seen in every report in which the string “ZIP Code” was used.
P A R T 1 B A S I C S
Terminology
To get the most benefit from the Report Writer, you need to understand some basic terminology used to describe reports.
Original reports
An original report is one that was provided with the accounting system. Original reports are stored in the main application dictionary.
Modified reports
A modified report is a copy of an original report that you have made changes to. Modified reports are stored in the Reports dictionary. A modified report can be substituted for an original report in the accounting system. When a user prints the report, they’re actually using the modified report, rather than the original.
Custom reports
A custom report is one that was created using the Report Writer. You can start with a blank report, or you can start by making a copy of a report that already exists in the accounting system. Custom reports are stored in the Reports dictionary. You must use a special procedure to print custom reports in the accounting system.
Storing reports
All changes and additions you make using the Report Writer are stored in the reports dictionary for the application. By storing the new and modified resources in a separate dictionary, the integrity of the system can be maintained. For example, the following illustration shows the dictionary for Microsoft Dynamics GP and its associated reports dictionary.
You will learn more about the reports dictionary in Chapter 30, “Storing Reports.”
Dynamics Reports.dic
New and modified resources are stored in the reports dictionary.
C H A P T E R 1 G E T T I N G S T A R T E D W I T H T H E R E P O R T W R I T E R
Starting the Report Writer
To begin using the Report Writer, log into the accounting system. If you’re using Microsoft Dynamics GP in a multiuser environment, verify that no other users are in the Report Writer and then perform the following steps:
1. Start the Report Writer.
From the main Dynamics GP window:
In the Microsoft Dynamics GP menu, choose Tools >> Customize >> Report Writer.
From individual task windows:
In the Tools menu, choose Customize >> Report Writer.
If the Report Writer item is dimmed, you have not been granted access through system security. Refer to Chapter 31, “Accessing Reports,” for more information about setting access to the Report Writer.
2. Select the product to modify.
If you’re using additional products that integrate with Microsoft Dynamics GP, the following window will appear when you start the Report Writer.
Select the product whose reports you want to access, then click OK. If Microsoft Dynamics GP is the only product available, this window won’t appear.
If you have integrating products, use this window to select the product whose reports you want to access.
Chapter 2:
The Report Writer Interface
This portion of the documentation describes the basic elements of the Report Writer interface. It is divided into the following sections:
• The main window and toolbar
• Menus
• Windows
• Standard buttons
The main window and toolbar
When you start the Report Writer, the Report Writer’s main window and toolbar appear. The toolbar appears across the top of the main window. Each button that appears represents a fundamental resource that you can view or edit. The following table describes each button.
Menus
The following items are available in the Report Writer menu bar. File: Print Setup
This menu item opens the printer setup dialog box. This dialog box allows you to configure the currently selected printer.
File: Generate Resource Reports
This menu item prints a resource report for the application. The resource report is a text file that lists all resources in the current dictionary, their internal resource IDs and any resources associated with the listed resource. When you choose Generate Resource Reports, a dialog box will appear and allow you to name the report and select its location.
Button Description
Opens the Data Types window, where you can view or edit existing data types.
Opens the Fields window, where you can view a list of fields in the application.
Opens the Tables or Virtual Tables window, where you can view information about tables or virtual tables in the application. Opens the Report Writer window, which allows you to create new or modified reports.
P A R T 1 B A S I C S
File: Process Monitor
This menu option opens the Process Monitor window. This window displays activity for tasks that you choose to process in the “background” within your application.
File: <<Main Application Name>>
The name of this menu item changes based on the application being used. Choosing the menu item allows you to exit the Report Writer and return to the main application.
File: Table/Field/Window Descriptions
These menu items open forms in the Resource Descriptions tool. This tool displays information about all the tables, fields and windows used in the current dictionary.
File: Exit
This menu item allows you to exit the application. Edit: Undo
This menu item will undo the last keyboard entry in an editable field. It will also undo field movement and sizing in a layout window, but not the addition or removal of fields, text or graphics from a layout window. Edit: Cut/Copy/Paste
These menu items allow you to copy text or graphics to the Clipboard, then paste it in a different location. You cannot cut, copy or paste fields.
Edit: Clear
This menu item allows you to remove text from an editable field, or remove selected items from the layout area.
Edit: Select All
This menu item allows you to select the entire entry in a field, or all items in the layout area for a report.
Macro: (all)
The items available from the Macro menu allow you to record and play macros.
Resources: (all)
The items in the Resources menu allow you to access the various resources in the application. Resources available from this menu include all resources accessed from the toolbar, as well as other resources (such as formats and strings).
C H A P T E R 2 T H E R E P O R T W R I T E R I N T E R F A C E
Windows:
This menu displays a list of the windows currently open. Selecting a window from this menu makes the window active.
Help: Lookup
This menu item opens any lookup window for the current field. Help: Contents
This menu item displays the contents topic for the Report Writer online help.
Help: Search for Help On
This menu item displays the search window for the help system, allowing you to search the Report Writer online help.
Help: Window Help
This menu item displays help for the current window in the Report Writer. Help: About
This menu item displays the About window for the main application.
Windows
The Report Writer uses several types of windows. Review the following descriptions to learn how each is used.
Resource list windows
Resource list windows display a list of resource names for a given resource type. To display a list window, click a button in the Report Writer toolbar or choose a resource from the Resources menu. When the window appears, select a resource name and click Open to display its definition window.
P A R T 1 B A S I C S
The following illustration shows the Formats resource list window.
Definition windows
Definition windows allow you to customize individual resources. For example, you will use the Format Definition window to customize how data is displayed on reports.
C H A P T E R 2 T H E R E P O R T W R I T E R I N T E R F A C E
Layout window
You will use the Layout window to specify the layout of reports in the application. The Layout window uses a graphics metaphor you may already be familiar with: an assortment of tools you can use for drawing and creating objects; a built-in grid that allows easy alignment of objects; moveable objects in a layout like an object-oriented drawing program; and standard cut-copy-and-paste techniques so you can import graphics you create in other applications.
The Toolbox is available whenever the Layout window is open. It contains tools you will use to add objects to the layout.
Standard buttons
The following buttons are used throughout the Report Writer:
Button Description
Saves changes and closes the current window.
Closes the current window without saving the changes to the window.
Creates a new resource.
P A R T 1 B A S I C S
Deletes the selected resource.
Allows you to insert items in a list, such as fields into a sorting definition.
Allows you to remove items from a list, such as the fields in a sorting definition.
The lookup button opens another window, allowing you to select a value to return to the current field. Typically, clicking the lookup button displays a list of resources. One of these resources can be selected and have its value returned to the current field.
Part 2: Creating Reports
This portion of the documentation describes the various resources used to create new reports. The following is a list of the topics discussed, along with a brief explanation of each:
• Chapter 3, “Report Definition,” describes how to use the Report Definition window to define a new report.
• Chapter 4, “Report Layout,” explains how to use the Report Layout window to design the appearance of a report.
• Chapter 5, “Sorting,” explains how to sort the data in a report.
• Chapter 6, “Restrictions,” describes how to restrict what data appears in a report.
• Chapter 7, “Calculated Fields,” explains how to create and use calculated fields in a report.
• Chapter 8, “Additional Headers and Footers,” describes how to use additional headers and footers to create groups for the report.
• Chapter 9, “Legends,” explains how legends are used in reports. • Chapter 10, “Modifying Fields,” describes how to modify how fields
Chapter 3:
Report Definition
Before you can work with the layout of a report, you must open an existing report definition or create a new one. The report definition specifies important characteristics of the report, such as its name. Many of these characteristics can be adjusted after you begin designing the report layout. Information about the report definition is divided into the following sections:
• Creating a new report definition
• Report options
• Printing a report definition
Creating a new report definition
Some of the items specified in the report definition include the name of the report, whether any restrictions will be used to control the scope of the data included when the report is generated, and which tables data presented in the report will come from.
To create a new report definition, start the Report Writer. In the Report Writer, click the Reports button on the toolbar to open the Report Writer window. Click the New button to open the Report Definition window.
P A R T 2 C R E A T I N G R E P O R T S
1. Name the report.
Enter a report name. Supply a name that accurately describes the purpose of the report.
2. Select a report series.
Series assignments allow you to group related reports in the accounting system using categories like Sales, Financial and Inventory. To ensure the consistent use of series, it’s a good idea to use the series of the primary table as the report series.
3. Select a main table for the report.
The name of each table in the current dictionary is displayed in the list box below the Main Table field. From this list, select the table you want to use as the main table for the report. The main table is typically the table that contains the majority of information used by the report. Refer to Chapter 11, “Data Storage,” for information about how to determine which tables to use for your reports.
4. Add additional tables to the report (if necessary).
Data for the report may need to come from tables other than the main table. If this is the case, you need to attach additional tables to the report. To do this, click the Tables button to open the Report Table Relationships window. The report’s main table will be the only table listed in this window. The number 01 will appear to the left of the table name, denoting its status as the report’s main table.
Refer to Chapter 12,
“Table Relationships,”
for more information about creating table relationships.
Click New to add another table to the report. The Related Tables window will open. This window contains a list of all tables that have a relationship with the main table already defined using the Table Relationship Definition window. An asterisk appearing next to the table name denotes a one-to-many relationship. Select the desired table and click OK. Each table that is added to the report and is directly linked to the main table will be listed below the main table in the Report Table Relationships window, with a single dash to the left of the table name.
To add a table that is linked to a table other than the main table, select the secondary table’s name in the Report Table Relationships window and click New. Select the name of the table to be added and click OK. This table will appear in the Report Table Relationships window below the table that it is linked to, and will have two dashes to the left of its name.
C H A P T E R 3 R E P O R T D E F I N I T I O N
The following illustration of the Report Table Relationships window shows the dashes that denote levels of linking.
You can have only one one-to-many relationship among the tables used for the report. For example, if the Customer Master Address File table has a one-to-many relationship with another table used in the report, all of the other relationships must be one-to-one.
Once you have added all the necessary additional tables, click Close to close the Report Table Relationships window.
5. Set the maximum number of records for the report.
Use the Max Records field to restrict the number of records that will be printed on the report. The default value for this field is 0, which indicates that all records will be printed.
If you enter the number 10 in the Max Records field, for example, only the first 10 records in the report will be printed, unless a restriction has been created to specify another number. Any limit set using a restriction overrides the limit set using the Max Records field.
You may want to enter a relatively small number while you’re creating the report, so that test reports will be generated more quickly. Be sure to change the number to 0 or another appropriate number when you are finished testing.
What is an appropriate number depends upon the type of report and how it will be used. For example, you could generate a report that lists all sales statistics by salesperson. If the user will only want to view the top ten salespersons, you could set the Max Records field to 10.
Main table
The dashes indicate the level of linking between the current table and the main table. Two dashes indicate that this table has a relationship with the Customer Master Summary table, which in turn is related to the main table.
P A R T 2 C R E A T I N G R E P O R T S
Report options
Several options are available to control characteristics of a report. Use the following procedure to set options for the report.
1. Set the report format options.
These settings specify various characteristics of the report. The Format Options are described in detail below.
Text Report Mark this option if you want to create a text report. Text reports do not allow you to specify fonts or use graphical items in your report, such as lines and pictures. However, text reports are less likely to be adversely affected by different printer configurations.
We suggest you create graphics reports only when creating custom reports for specific clients, where you can be sure of the type of printer the report will be printed to. If you create graphics reports for general distribution, be sure to test the reports with a wide variety of printers.
Skip Blank Records Mark this option to include only records for which there is corresponding data in the main and related tables. If there isn’t a corresponding record in each of the related tables, the entire record won’t be included in the report.
Suppress Decimals Mark this option to round currency values to the nearest whole currency unit. This option is primarily used for international versions of applications where inflation makes the fractional portions of currency amounts insignificant.
2. Set page orientation options.
You can specify the page orientation that will be used for the report. Printer Setting Choose this option to use the page orientation as specified for the printer currently selected.
Portrait Choose this option to have the report printed in portrait mode, regardless of the current printer setting.
Landscape Choose this option to have the report printed in
C H A P T E R 3 R E P O R T D E F I N I T I O N
3. Set text report options.
Refer to Chapter 4,
“Report Layout,” for
more information about the Report Layout window.
If you marked the Text Report option, you will activate the Text Report Options portion of the Report Definition window. Marking this option also changes the appearance of the Report Layout window, adding vertical guides at the 80 and 132 character marks. These marks allow you to count characters and more precisely place your field if you are using a fixed text pitch. The text report options are described in detail below.
Best Text Fit Choose this option to have the report printed using the largest printer font that will allow all of the information to be printed on the paper size and paper orientation specified for the printer to which the report will be sent.
If you’re creating a report in a dictionary that will be distributed to multiple locations, selecting Best Text Fit will help ensure that the report will print properly on the widest variety of printers.
17 Characters/Inch Choose this option to have the report print in compressed text format.
10 Characters/Inch Choose this option to have the report print in uncompressed text format.
Variable Characters/Inch Choose this option to be able to specify the characters per inch on a line-by-line basis for the report.
Six Lines/Inch Choose this option to ensure that six lines of the report will print in each inch of report height, regardless of which other text option is selected.
This option is most useful when Best Text Fit is selected. It will prevent the font from becoming too small when the text is compressed. The font will shrink in width so that the entire report can be printed on the available paper, but no more than six lines of text will be printed per vertical inch.
P A R T 2 C R E A T I N G R E P O R T S
4. Set printing options.
Four printing option are available:
To access the Report Section Options window, open the Report Layout window and select Report Section Options from the Tools menu.
First Page Header Choose this option if you want the page header to be printed on the first page of the report. If you don’t want to print page headers on any page of the report, use the Report Section Options window to inactivate page headers. If page headers have been inactivated, the Page Header check box will appear dimmed.
Last Page Footer Choose this option if you want the page footer to print on the last page of the report. If you don’t want to print page footers on any page of the report, use the Report Section Options window to inactivate page footers. If page footers have been inactivated, the Page Footer check box will appear dimmed.
Preprinted Form Select this option to remove the built-in margin from the layout area when designing a text report. With this option selected, you can place fields anywhere in the layout area. However, if you place fields outside of the printer’s predefined margins, data outside of the margin will not print.
If Preprinted Form is not selected, a margin will appear in the report layout area; the margin is drawn to show the default printer margins of the currently-selected printer. The Report Writer will not allow you to place fields outside of this margin.
If Preprinted Form is not selected and you lay out a report while you have one printer selected, then save the report layout, select a different printer and reopen the report layout, the margins may shift, depending on the default margins of the new printer. If the margins shift, fields in the layout area will shift with the left and top margins. This shift may force fields outside of the area bounded by the right margin.
The Preprinted Form selection isn’t available if the Best Text Fit option is selected. The use of preprinted forms isn’t an option when Best Text Fit is selected because the size and spacing of the font used for Best Text Fit reports varies based on the data in the report. Therefore, you can never be certain that text will appear in the appropriate position on a preprinted form.
C H A P T E R 3 R E P O R T D E F I N I T I O N
Use RF for Last PF Mark this option to replace the last page footer on the report with the report footer. The report footer will be printed in the area designated for the page footer. If you mark this option, the page footer and report footer must be the same size, and both sections must be active.
To access the Footer Options window, open the Report Layout window, select Report Options from the Tools menu, and click Add or Open in the Additional Footers section.
Mark this option if the report will contain totals in the report footer. For instance, an invoice report containing invoice numbers, invoice items and an additional footer could have a Sum type field in the additional footer (which breaks on the invoice number field) to display the sum of the invoice items. If you wish to display an overall sum at the bottom of the report as well, you must place it in the report footer, then mark Use RF For Last PF, as well as Suppress Last Record’s Footer in the Footer Options window for the additional footer.
Printing a report definition
To keep track of the numerous options for a report, you may want to print the report definition. To do this, select the report in the Modified Reports list of the Report Writer window, and then click Print Definition. The Print Report Definition window will appear.
Mark the options indicating what type of information you want included on the report, and then click OK. The report will be generated.
Printing report definitions for existing reports is a good way to learn about the report.
Chapter 4:
Report Layout
Once you’ve planned and defined your report, you’re ready to design the report layout. Use the information provided here to create a report layout using the Report Layout window. Information about the report layout is divided into the following sections:
• Creating a report layout
• Layout sections
• The Toolbox
• Adding fields to a report layout
• The Properties window
• Report properties
• Field properties
• Drawn object properties
• Report field characteristics
• Applying drawing options
Creating a report layout
Click the Layout button in the Report Definition window to access the Report Layout window and its associated Toolbox. The Report Layout window and Toolbox are shown in the following illustration.
The Report Layout window will be displayed differently depending on whether you are creating a graphics or text report. Changes affect the tools shown in the Toolbox and the width of layout area.
Make a selection from this drop-down list to view calculated fields, global variables, legends, or table fields in this fields list.
Drag fields from this fields list to the layout.
P A R T 2 C R E A T I N G R E P O R T S
Toolbox
The type of report being created is displayed in the Toolbox, next to the arrow tool. Also, several tools are available only when creating graphics reports, such as the line and picture tools.
Layout area
For a text report, the layout area includes a left border, a right border, and two intermediate vertical guides. These guides mark the positions 80 characters and 132 characters from the left margin. They can help you more precisely place fields in the layout area and are especially useful if you’re using a preprinted form and have specified a fixed-pitch text option. Then, regardless of the printer printed to, you are assured of proper placement of fields.
For graphics reports, the layout area simply includes the left and right borders.
To make the various sections of the layout area easier to distinguish, you can mark the Colorize Report Sections item in the Layout menu. This makes the various sections of the report appear lightly shaded.
Layout sections
Before you can add fields and data to the report layout, you must decide where to place that information in the layout area. The Report Layout window for a new report contains four evenly-spaced blank sections, separated by border lines. Each border has a handle in the left margin that is labeled using a one- or two-letter abbreviation. Each section can be resized by dragging the handle up or down. Once fields have been placed in a section, you can’t drag the lower border of a section above the lowest field in the section.
Additional headers and additional footers are
described in Chapter 8,
“Additional Headers and Footers.”
Seven types of sections can appear in the Report Layout window, depending on which options are selected in the Report Section Options window. Once the Report Layout window has been opened, you can access the Report Section Options window by choosing Report Section Options from the Tools menu.
C H A P T E R 4 R E P O R T L A Y O U T
Each section is described in the following table.
Section Use
Page Header (PH)
Items in this section are placed at the top of every report page. Page number, date, and time fields are commonly placed in this section of a report. You can prevent the Page Header from being included on the first page of a report by unmarking the First Page Header option in the Report Definition window.
To exclude page headers from a report, unmark the Page Header option in the Report Section Options window.
Report Header (RH)
Items in this section appear only on the first page of a report. The title of the report and introductory information are often included in this section. If a page header is also included on the first page, the report header will appear after the page header. To exclude a report header from a report, unmark the Report Header option in the Report Section Options window.
Additional Headers (H1, H2, H3...)
Additional headers and footers allow you to create groupings in your report. Each header will print when the data in the field it is based on changes. Therefore, the sorting order used will affect the order in which the headers appear on the report. For example, if the field related to header 2 is sorted before the field for header 1, header 2 will print before header 1.
Use the Report Section Options window to add additional headers. You can have up to 15 additional headers in a report.
Body (B) The report body normally contains the bulk of the report. Depending on the number of additional headers and the sorting order used, there could be a body section for each additional header section.
Additional Footers (F1, F2, F3...)
Additional headers and footers allow you to create groupings in your report. Footers should correspond to headers and break on the same fields. They are often used to display summary data, such as a total of all records in the report’s body under the footer’s related header.
Use the Report Section Options window to add additional footers. You can have up to 15 additional footers in a report.
Report Footer (RF)
Items in this section appear only on the last page of a report. Summary information is often included in this section. If a page footer is also included on the last page, the report footer will appear before the page footer.
To exclude a report footer from a report, unmark the Report Footer option in the Report Section Options window.
Page Footer (PF)
Items in this section are placed at the bottom of every report page. This section often includes administrative information, such as the name of the person running the report. You can prevent this section from being included on the last page of a report by unmarking the Last Page Footer option in the Report Definition window.
To exclude page footers from a report, unmark the Page Footer option in the Report Section Options window.
P A R T 2 C R E A T I N G R E P O R T S
The Toolbox
Use the Toolbox to place the fields and other items in the report layout area. The Toolbox window’s Layout and Arrange tabs let you toggle between two different sets of tools. Tools in the Layout tab help you place information in the layout area, while tools in the Arrange tab are used to arrange selected items in the layout area.
To activate the Toolbox window, simply move the pointer from the Layout window to the Toolbox window. The following illustration shows the Toolbox for a graphical report when the Layout tab is displayed and a field in the Layout area is selected. Each of the Layout and Arrange tools, as well as the Pos and Size fields, are described in the following sections.
The layout tools
To use a layout tool, click the tool’s icon, then click in the layout area.
Use the Layout tab to display the layout tools.
The Pos field displays the coordinates of the selected field’s upper left and lower right corners. The name of the table the selected field came from, or the field type appears here.
The Size field displays the total width and height of the selected field. The report type is displayed here.
Tool Name Description
Arrow tool Use the arrow tool to select objects in the layout area. When you select an object, handles will appear; dragging a handle allows you to resize the object. To select more than one object at once, hold down the SHIFT key as you select the object, or drag the arrow tool to draw a rectangle around the set of objects you want to select. You can also use the arrow tool to drag objects to a new position in the layout area.
C H A P T E R 4 R E P O R T L A Y O U T
Divider tool Use the divider tool to divide the report into columns, such as for printing labels. To mark a division on the report, click the divider tool, then click in the body of the report where you want to place the division. You must add the division to the right of any existing fields; the division won’t appear if there are fields or other objects to the right of where you’ve clicked. Once you’ve placed a division on the report, you can’t add any objects to the right of the division. You can reposition a division by dragging it with the arrow tool. Text tool Use the text tool to place text in the layout area, such as a
report title or column headings. You can enter up to 79 characters in a text field. You can’t use the ENTER key to make the text wrap; this can only be accomplished by resizing the text field.
Date tool Use the date tool to add fields that display the current date. The date is determined by the operating system setting. Time tool Use the time tool to add fields that display the current time.
The time is determined by the operating system setting. Page number
tool
Use the page number tool to add fields that display the current page number.
Picture tool The picture tool is available for use only with graphics reports. It allows you to add pictures from your application’s picture library to a report. To add a picture to the report, click the position in the layout area where the picture’s upper left corner should appear. The Pictures window will appear. Select a picture and click OK; the picture will appear in the layout area, where it can be moved or resized like any other object. Refer to Chapter 20 for more information about the picture library.
To add a picture to your application’s picture library, select Pictures from the Resources menu. Click New in the Pictures window, and paste the desired picture in the Picture field of the Picture Definition window. Name the picture and click OK to save it.
Line tool The line tool is available for use only with graphics reports. Use it to draw lines in the report layout.
Circle tool The circle tool is available for use only with graphics reports. Use it to draw circles in the report layout.
Rounded rectangle tool
The rounded rectangle tool is available for use only with graphics reports. Use it to draw rounded rectangles in the report layout.
Rectangle tool
The rectangle tool is available for use only with graphics reports. Use it to draw rectangles in the report layout.
P A R T 2 C R E A T I N G R E P O R T S
The arrange tools
Clicking the Arrange tab in the Toolbox displays an additional set of tools used to align, resize, or tile fields in the window. These tools are described in the following table.
Category Tool Name Description
Align Align to Top Aligns the selected objects with the top object in the group.
Align to Left Aligns the selected objects with the leftmost object in the group. Align to Right Aligns the selected objects with the
rightmost object in the group. Align to Bottom Aligns the selected objects with the
bottom object in the group. Size Size to Shortest Shrinks the selected objects to the
height of the shortest object in the group.
Size to Narrowest Shrinks the selected objects to the width of the narrowest object in the group.
Size to Widest Enlarges the selected objects to the width of the widest object in the group. Size to Tallest Enlarges the selected objects to the
height of the tallest object in the group. Size to Default Resizes the selected text object or field. If the layout grid is active, resizes the object to the nearest horizontal and vertical grid lines. If the grid isn’t active, resizes the object to its default size based on the drawing options for the item.
Tile Tile Horizontally Tiles the selected objects horizontally. The value in the Space field specifies the space between objects.
Tile Vertically Tiles the selected objects vertically. The value in the Space field specifies the space between objects.
C H A P T E R 4 R E P O R T L A Y O U T
Arranging objects can’t be undone. Be sure to save your report layout before arranging objects. If you aren’t satisfied with the result of an arrangement, you can close the window without saving the changes.
The Pos and Size fields
These fields appear at the bottom of the Toolbox when a field is selected in the layout area. The Pos field displays, in pixels, the coordinates of the selected field’s upper-left and lower-right corners. The Size field displays the total width and height, in pixels, of the selected field. These fields are automatically updated as you resize the selected field in the layout area, allowing you to use the information displayed to exactly size a field. If a table field is selected, the name of the table from which the field was selected will appear below the Size field. If the selected field is a global variable, calculated field, or legend, the resource type (Global, Calculated Field, or Legend) will appear below the Size field.
Adding fields to a report layout
For more information about legends, refer to
Chapter 9, “Legends.”
When you open the Report Layout window, the name of the report’s main table will appear under the layout tools in a drop-down list, and the name of each field in that table will appear in the fields list. You can change which fields appear in the fields list by selecting a different entry from the list. The choices in the drop-down list are Globals, Calculated Fields, Legends, and the name of each table associated with the report.
The arrow tool is selected by default when you open the window. Use it to select each desired field from the fields list and drag it to the report layout area. If you inadvertently drag the wrong field to the layout area, select the field using the arrow key, then press DELETE or BACKSPACE. This will remove the field from the layout area without affecting the field in the table.
Refer to Part 3, Gathering Data, for information about finding the data you want to include in your report.
If you add an array field to the layout, the Report Field Options window will appear, allowing you to specify the element of the field being placed on the report. In the Array Index field, enter the number of the array element, and then click OK. If necessary, you can use the Report Field Options window to change the array index to a different element of the array. Fields placed in the layout area will automatically appear sized according to the maximum keyable length of the field. You can resize each field as you wish; however, if you shorten a field, the information in that field may not
P A R T 2 C R E A T I N G R E P O R T S
be displayed in its entirety when the report is printed. If you resize a field by vertically enlarging it, the field’s text will be centered. If you reduce a field’s height, it will not display properly.
You can click and drag with the Arrow tool to select multiple fields in the layout. By default, the selection rectangle will be limited to the current group. Hold down the CTRL key to allow the selection rectangle to expand beyond the current group.
In general, fields placed in the body of the report should be placed at the very top of the body section, since any white space between the top of the body and the field below it will be repeated for every record that’s printed. Similarly, once you’ve finished placing fields in the report body, you should resize the body section so that excess space is removed from the bottom of the section.
The Properties window
The Properties window is used to display and set several characteristics of a report and the objects in the report. To display the properties for the report, select Properties from the Layout menu. If it isn’t already open, the Properties window will appear.
Select an object in the layout area and click the tab indicating which type of property you want to view. Select Object or Visual. To set a property, select it in the list and then change its value in the settings box.
Click a tab to display the corresponding list of properties. To set the value of a property, select it in the list. Then set its value in the settings box.
C H A P T E R 4 R E P O R T L A Y O U T
Setting the property value involves choosing a value from a drop-down list, typing a value, or using a lookup. Some properties listed can’t have their values changed.
Double-clicking a property in the properties list is a shortcut to setting its value. For instance, double-clicking a property whose value is set with a drop-down list will set the property to the next value in the list.
Report properties
To view report properties, be sure the Properties window is open. Select the arrow tool from the Toolbox and click anywhere in the background of the layout area to select the report. The following table lists the report properties.
Property type Description
Some properties are set using a drop-down list.
Some properties have the value entered directly.
Some properties use a lookup to retrieve values.
Some properties can’t be set.
Object property
Description
DisplayName The name displayed for the report at runtime.
MainTable The primary table from which data will be read for the report. MainTableKey The key from the main table that will be used to determine the
default sorting order for the report. An alternative sorting order can be defined using the Sorting Definition window.
MainTableName The display name for the main table selected for the report. MaxRecords Specifies the number of records that will be printed on the report.
For example, the value 10 indicates only the first 10 records will be printed. The default value is 0, which indicates that all records will be printed.
Name The name of the report.
Orientation Specifies the page orientation that will be used for the report. Printer Setting will use the orientation for the printer currently selected. Portrait will always use portrait orientation. Landscape will always use landscape orientation.
ReportID Lists the resource ID of the report.
Series Indicates the series the report is assigned to.
Type Indicates what type the report is. It can be one of the following: Graphics, Text, or Text (Variable CPI).
P A R T 2 C R E A T I N G R E P O R T S
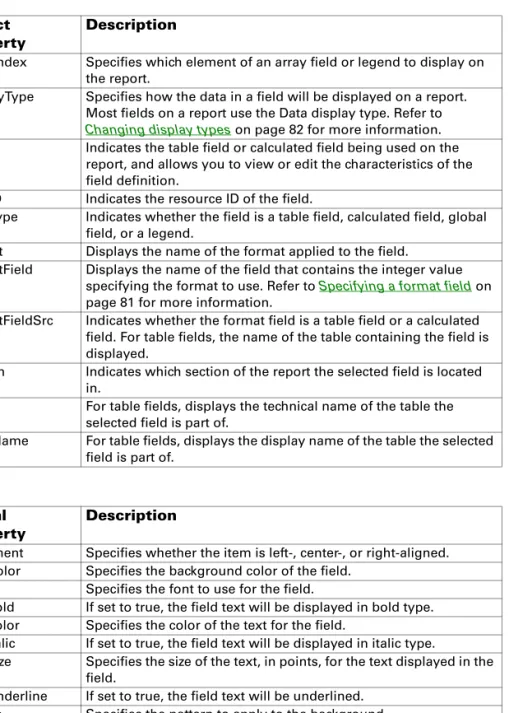
Field properties
The following table lists the field properties. Object
property
Description
ArrayIndex Specifies which element of an array field or legend to display on the report.
DisplayType Specifies how the data in a field will be displayed on a report. Most fields on a report use the Data display type. Refer to Changing display types on page 82 for more information. Field Indicates the table field or calculated field being used on the
report, and allows you to view or edit the characteristics of the field definition.
FieldID Indicates the resource ID of the field.
FieldType Indicates whether the field is a table field, calculated field, global field, or a legend.
Format Displays the name of the format applied to the field.
FormatField Displays the name of the field that contains the integer value specifying the format to use. Refer to Specifying a format field on page 81 for more information.
FormatFieldSrc Indicates whether the format field is a table field or a calculated field. For table fields, the name of the table containing the field is displayed.
Section Indicates which section of the report the selected field is located in.
Table For table fields, displays the technical name of the table the selected field is part of.
TableName For table fields, displays the display name of the table the selected field is part of.
Visual property
Description
Alignment Specifies whether the item is left-, center-, or right-aligned. BackColor Specifies the background color of the field.
Font Specifies the font to use for the field.
FontBold If set to true, the field text will be displayed in bold type. FontColor Specifies the color of the text for the field.
FontItalic If set to true, the field text will be displayed in italic type.
FontSize Specifies the size of the text, in points, for the text displayed in the field.
FontUnderline If set to true, the field text will be underlined. Pattern Specifies the pattern to apply to the background.
PatternColor Specifies the color of the pattern that is applied to the background. Position-Left Indicates the position of the left edge of the field, measured in
C H A P T E R 4 R E P O R T L A Y O U T
Drawn object properties
The following table lists the drawn object properties.
Position-Top Indicates the position of the top edge of the field, measured in points from the top edge of the report.
Size-Height Indicates the field height, measured in points. Size-Width Indicates the field width, measured in points.
Visibility Indicates conditions when the field will be printed on the report. It can be one of the following: Visible, Invisible, or Hide When Empty. Visual property Description Object property Description
Section Indicates which section of the report the selected drawn object is located in.
Visual property
Description
Alignment For static text, indicates whether the text is left, center, or right-aligned.
BackColor Specifies the background color of the object. Font Specifies the font used for static text.
FontBold If set to true, static text will be displayed in bold type. FontColor For static text, specifies the color of the text.
FontItalic If set to true, static text will be displayed in italic type. FontSize For static text, specifies the size of the text, in points. FontUnderline If set to true, static text will be underlined.
LineColor Specifies the color of the line used to draw the object.
LineSize Specifies the width of the line (in pixels) used to draw the object. Pattern Specifies the pattern to apply to the background.
PatternColor Specifies the color of the pattern that is applied to the background. Position-Left Indicates the position of the left edge of the object, measured in
points from the left edge of the report.
Position-Top Indicates the position of the top edge of the object, measured in points from the top edge of the report.
Shape Specifies the shape of an item drawn with the shape tool. Size-Height Indicates the object height, measured in points.
P A R T 2 C R E A T I N G R E P O R T S
Report field characteristics
When printed on a report, most fields you add to a report layout simply display the data values stored by them. However, some fields have special display characteristics you need to be aware of when you use them in a report.
Booleans
When a boolean is added to a report, the string “Yes” is printed on the report if the field contains the value true. The string “No” is printed on the report if the field contains the value false.
Check boxes
When a check box is added to a report, an X is printed if the check box is marked. Nothing is printed on the report if the check box is not marked.
Combo boxes
When a combo box field is added to a report, the text string selected or entered in the field is printed on the report.
Dates
When a date field is added to a report, the short version of the date value is printed on the report. The date value is formatted based on the regional settings for the operating system.
Drop-down lists
When a drop-down list field is added to a report, the static text value corresponding to the field’s value is printed on the report. If the drop-down list field doesn’t have any static text items defined for its data type, no text is displayed on the report. In this case, you must create a calculated field to display a value based on the value of the drop-down list field.
List boxes
When a list box field is added to a report, the static text value corresponding to the field’s value is printed on the report. If the list box field doesn’t have any static text items defined for its data type, no text is printed on the report. In this case, you must create a calculated field to display a value based on the value of the list box field.
Multi-select list boxes
When a multi-select list field is added to a report, the static text values corresponding to the items selected in the field are printed on the report. If the multi-select list box field doesn’t have any static text items defined for its data type, no text is printed on the report.
C H A P T E R 4 R E P O R T L A Y O U T
Pictures
Picture fields should not be added to the report layout.
Radio groups
When a radio group is added to a report, the integer value of the field is printed on the report. If you want to display some other value in the report, you must create a calculated field to display a value based on the value of the radio group field.
Text fields
When you add text fields to a report layout, you should be aware that they can display no more than 10K of data, even though text fields can hold up to 32K of data. Text fields should only be placed in the body of a report. Resizing a text field will have different results, depending on whether the report is a graphics or text report. If you resize a text field in a graphics report, data will be printed to fill the resized area. However, if the text field is larger than the amount of data in that field for a given record, the unused space for that field will still be included in the report. If you resize a text field in a text report, the field width you specify will be used, but the field height will be adjusted automatically to accommodate the text in the text field, up to the 10K limit.
For example, you could resize a text field to be two inches wide and tall enough to include 18 rows of data. If the data in that field for a given record will fill only 12 rows, then only those 12 rows will be included if it’s a text report, while those 12 rows plus 6 blank rows will be included if it’s a graphics report. Similarly, if the data in that same field for a different record contains 20K of data, up to 10K will be included if it’s a text report, while only the first 18 rows will be included if it’s a graphics report.
Times
When a time field is added to a report, the time value is printed on the report. The time value is formatted based on the regional settings for the operating system.
Visual switches
If the visual switch field has static text values defined, the static text value corresponding to the field’s value is printed on the report. If the visual switch field has picture or native picture static values defined, the integer value of the field is printed on the report. If the visual switch field has no static values defined, it can’t be used on the report. Instead, you must create a calculated field to display a value based on the value of the visual switch field.
P A R T 2 C R E A T I N G R E P O R T S
Applying drawing options
Use the Drawing Options window to select a variety of fonts, font styles, colors and fill patterns for items in graphics reports. To open the Drawing Options window, select an item in the layout and choosing Report Drawing Options from the Tools menu.
If several items are selected in the layout area when you open the Drawing Options window, the options you specify will apply to all of them. If no items are selected when you open this window, the options defined will be applied to all new objects placed in the layout area.
For many objects, such as text, lines, and rectangles, you can open the Drawing Options window by double-clicking the object.
Fonts
Use items in the Font section to specify font characteristics for items in the report. For graphics reports, you can choose any font installed on the current system.
Keep in mind that if the report is used on another system that doesn’t have the appropriate fonts installed, the missing fonts will be substituted.
Three “generic” fonts are always available for every report. These are: • Courier (generic)
• Helvetica (generic) • Times (generic)
C H A P T E R 4 R E P O R T L A Y O U T
These fonts correspond to the fonts that were available in earlier versions of the Report Writer. If you want your reports to be independent of the fonts installed on a particular system, use these generic fonts.
If you are creating a text report and have marked the Variable Characters/ Inch option in the report definition, the Font section in the Drawing Options window allows you to specify the characters per inch to use for each line. Simply select a field in the line and display the Drawing Options window. You can choose 5, 6, 10, 12, or 17 characters per inch.
Once you set the characters per inch for a field on the report, any other field you move to that line will also be printed in that size. To see how your text report will appear when printed, be sure the Show Field Names item in the Layout menu is not marked. The report will be displayed as it will appear when printed.
Patterns
Use the Patterns section to select the fill pattern for fields, text items or shapes in the layout.
Color
Use the Color section to select the font/line, background and foreground colors of items you’ve added to the layout. The line color is used for lines and field borders. The font color is used for text. The foreground color is used to draw the pattern selected in the Patterns section. The background color is used to fill in the remaining area of the object. The line size specifies the size of the line used to draw lines, rectangles, circles, and other shapes. When specifying colors, you can select one of the predefined colors in the list. To use a custom color, select User Defined as the color and then click More Colors to display the Color dialog. Select a color and click OK. The color you selected will be applied to the current color selection.
Alignment
Use the Alignment setting to specify the horizontal alignment of text in fields or of text items you’ve added using the text tool.
If you mark the Variable Characters/Inch option for a text report, you can specify the characters per inch for each line of the report.