THE RISK OF DRIVER CRASH
INVOLVEMENT
AS A FUNCTION
OF DRIVER AGE
byAlan E. Drummond
Eun-Voung Veo
Printed by the Australian Road Research Board as part of an agreement with Monash University Accident Research Centre.
MONASH UNIVERSITY ACCIDENT RESEARCH CENTRE
REPORT DOCUMENTATION PAGE
Report No: 49 Report Date: December 1992 ISBN: 0732600499 Pages: 18+7 (app) Title and sub-title:
The Risk of Driver Crash Involvement as a Function of Driver Age
Author(s):
Drummond, Alan E. Yeo, Eun- Young
Sponsoring Organization:
Type of Report
&
Period Covered: General, 1992Australian Road Research Board, Department of Justice, Royal Automobile Club of Victoria, Transport Accident Commission, Vic Roads.
Abstract:
This short report has presented an analysis of risk of crash involvement estimates for 1988 in Metropolitan Melbourne. By necessity, the analysis was age based, in contrast to the original work which was primarily experience based. It was noted that factors other than the ambient level may have affected the incidence of reported crashes, perhaps reducing the direct comparability of the two sets of results. Nevertheless, the same general patterns of results have been obtained, namely the increased risk of crash involvement for younger drivers, the approximate equivalence of risk as a function of driver gender and the elevated risk of night-time driving, particularly after midnight, and for 19 year old drivers.
TABLE OF CONTENTS
Page
1.0 INTRODUCTION 1
2.0 EXPOSURE, CRASHES, AND RISK 1
2.1 Background
1
2.2 Exposure Pattern
2
2.3 Crash Patterns
t ••••••• , ••••••••••••••••••••••••••••••••• t •• t ••••••••••••••• t •••••••3
2.4 Absolute versus Relative Crash Involvement Risks
4
3.0 PREVIOUS SroDY
6
4. 0 UPDATED RISK ESTIMATES 8
4.1 Introduction
8
4.2 Results
8
5.0 CONCLUSION 17 REFERENCES 18 APPENDIX A 19 APPENDIX B 20 APPENDIX C 25TABLES:
2.0.1
2.1.1
2.3.1
2.4.1
3.0.1
4.2.1
4.2.2
LIST OF TABLES AND FIGURES
Page
Datasets used to calculate risk estimates
2
Exposure data from 37 LGAs during the non-holiday period
2
Crash data (37 LGAs for the whole year)
3
Absolute risk estimates
5
Absolute/relative risk estimates by driver age group
7
Risk estimates by driver age
8
Risk estimates of young drivers during restricted period
15
FIGURES:
3.0.1
Absolute risk estimates by driver experience
6
4.2.1
Risk estimates by driver age
9
4.2.2a
Absolute risk - Sex by age group
10
4.2.2b
Relative risk - Sex by age group
10
4.2.3a
Absolute risk - Day vs. night by age group
11
4.2.3b
Relative risk - Day vs. night by age group
11
4.2.4a
Absolute risk - Time block by age group
12
4.2.4b
Relative risk - Time block by age group
12
4.2.5
Absolute risk estimates by hour of day
13
4.2.6
Relative risk estimates by hour of day
14
4.2.7a
Absolute risk estimates during restricted period
16
4.2.7b
Relative risk estimates during restricted period
16
4.2.8
Crash, exposure, and relative risk (night-time restriction)
17
1.0
INTRODUCTION
The Victorian Expert Working Group on Young and/or Inexperienced Driver Safety recognised the need for the collection of high quality exposure data to supplement mass crash data and support the estimation of casualty crash involvement risk as a function of driving experience (Drummond & Torpey, 1984).
On the assumption that high risk driving is the most legitimate young driver exposure reduction target, this process could be considered essential to the development of young driver crash countermeasures. Exposure reduction continues to be the only effective method of reducing the frequency of young driver crashes; the MUARC (Monash University Accident Research Centre) research program on young driver performance aims to develop risk reduction measures through fundamental analyses of driving performance differences.
The initial crash risk analysis outcomes have been reported in a number of places, with Drummond
&
Healy (1986) providing both an overview of crash risk outcomes and a description of the unique method by which objective measures of exposure (Le. distance driven) are generated. This short report provides an update of this work.2.0
EXPOSURE, CRASHES, AND RISK
2.1
BackgroundExposure is often dermed as "the opportunity to have a crash". In Victoria, this has been operationally dermed as the distance of travel. Work in New Zealand has indicated that duration of travel is also an acceptable measure of exposure, although distance and duration are both preferable to a count of the number of trips (White, 1979). Within any given unit of exposure (e.g. total driving on weekdays, driving in non-metropolitan areas, total statewide driving), a certain number of crashes will occur. The actual number of crashes depends on a range of factors but has been demonstrated to vary as a function of vehicle type, road type, age of driver, time of day, etc. The
Thus, estimates of the risk of crash involvement can vary over time as a result of
differential changes in the incidence of crashes and/or the aggregate amount of exposure (if both crashes and exposure increase/decrease
in proportion,
risk estimates remain the same). However, over time, there are a range of factors in the crash frequency domain other than the ambient level of safety which will affect the apparent number of crashes and, by extension, the estimates of crash involvement risk. Thus, the question ofcomparability of this update is an issue requiring resolution. There are three elements to this question:
• apparent changes in exposure patterns • apparent changes in crash frequencies • absolute versus relative crash risk
These three elements are addressed in the next section. The original work and this "update" used/use the following datasets:
Table 2.0.1: Datasets used to calculate risk estimates
Crashes Exposure Original 1981-83 1984 UQdate 1988 1988
It should be noted that, at the definitionallevel, these data sets are directly comparable both
within
andbetween
time periods. That is, the data related to the same time (non-holiday period of year) and space (the same Local Government Areas of the Melbourne Statistical Division). These times and locations are presented in Appendix A.2.2
Exposure Pattern
Table 2.1.1 shows that the estimate of aggregate exposure calculated on the basis of survey data has increased by 40% between 1984 and 1988 and that there does not appear to be any differential change in exposure as a function of driver age.
Table 2.1.1: Exposure data collected from 37 LGAs during the
non-holiday period
18-25
26-98Total year old
% year olddriver%% Year
exposure change exposureexposurechangechange (millions) (millions) (millions) 1984 1264.1 4796.36060.4 1988 1790.5 42% 6702.08492.540%40%
There are no directly comparable data to provide a measure of external validation for these measured increase in exposure (neither have confidence limits for these point estimates been calculated - these would give upper and lower bounds for the change in exposure, Le., 95% sure that the change is between say, 30-50%) and whether this change is significant.
Nevertheless, in the period 1984-1988, there has been a 10% increase in the number of vehicles registered in Victoria and it is estimated that there has been a 20% increase in kilometres travelled statewide (this estimate is derived from fuel sales data). It would appear that the survey data reported in Table 2.1.1 are not inconsistent with these other data.
2.3
Crash Patterns
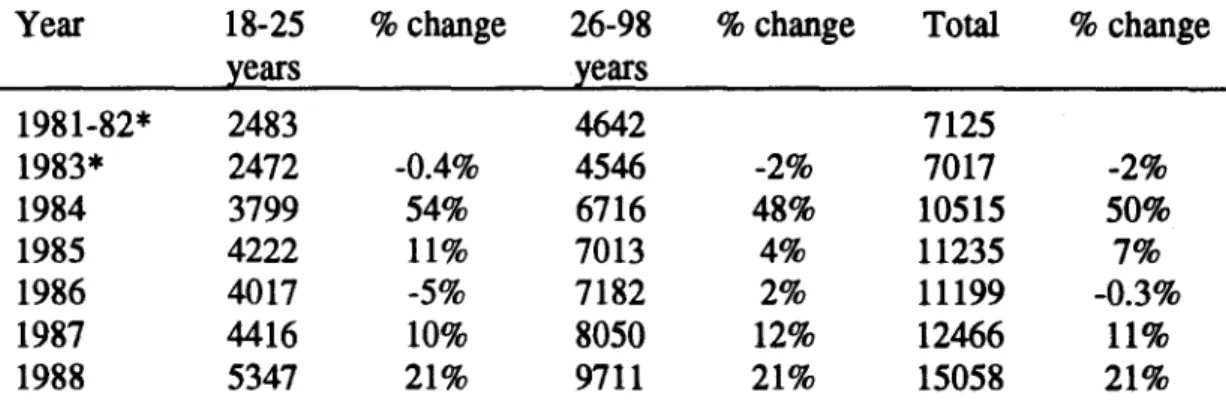
Table 2.3.1 presents a time series of crash frequency data for young, older, and all
drivers for the period 1981-1988. Crash frequencies relate to the whole year as defined non-holidays periods were only available for 1981-83 and 1988.
Table 2.3.1: Crash data collected from 37 LGAs for the whole year
Year18-25 % change% change% change26-98Total years years 1981-82* 2483 46427125 1983* 2472 -0.4%70174546-2%-2% 1984 3799 54% 671648% 1051550% 1985 4222 11% 70134% 112357% 1986 4017 -5% 71822% 11199-0.3% 1987 4416 10% 805012% 1246611% 1988 5347 21% 971121% 1505821%
* 1981-82 and 1983 crash data for the whole year have been scaled from non-holiday crash frequencies, using scaling factors derived from the 1988 data. The scaling factors for the 18-25 age group, 26-98 age group, and total were 1.348, 1.307, and 1.321 respectively.
Table 2.3.1 shows two dysjunctions in the series, the large apparent increase between 1983 and 1984, and the large jump in 1988. It is not possible to provide definitive explanations for these jumps (nor is it necessary, given the greater emphasis on relative risk estimates). However, the following points should be noted;
• Crash data extraction relies upon the variable ANS_TYPE to identify those crashes on the arterial network. While virtually all metropolitan crashes are now classified by ANS_TYPE (and earlier years have been classified retrospectively), in the early 1980's, a proportion of metropolitan crashes were unclassified. This would have made the original analysis, restricted as it was to known arterial road crashes, conservative in an absolute sense: it is likely that classificationllack of classification was a random process with respect to driver age and therefore relative risk estimates would have been largely unaffected.
• The large jump in 1988, and to a lesser extent 1987, reflect both a worsening serious crash situation in Victoria (Drummond, Sullivan,
&
Vulcan, 1991) and changes in crash reporting requirements. The relative contribution of each factor to the overall result is not known.This crash time series pattern reduces the direct comparability of crash risk outcomes over time and emphasises the need to focus on general patterns over time (within a time period, more detailed analysis and interpretation can be undertaken).
2.4
Absolute versus Relative Crash Involvement Risks
There may be a range of reasons why the estimates of
absolute
risk of casualty crash involvement may not be directly comparableover time.
Absolute risk means the number of crash involvements per million kilometres travelled for any particular unit of analysis (e.g. inexperienced drivers on weekday nights, etc). However, the computation of two or more absolute risk estimates allows the calculation of a relative risk estimate which may go some way to controlling the effect of other factors and improve comparability of estimates in different time periods (relative risks are calculated by setting the relative risk of the chosen reference group, e.g. experienced drivers) to unity (by dividing that group's absolute risk by itself) and establishing the relativities of other groups by dividing their absolute risk by the risk estimate for the comparison group. The following hypothetical example both illustrates the process and the different interpretations flowing from the use of absolute and relative risk estimates.Table 2.4.1: Absolute risk estimates
(Crash Involvement per million kilometres travelled) Young Drivers Older Drivers 1980 1990 2.0 4.0 1.0 2.0
One interpretation of this table is that, per unit distance, it was, on average, twice as risky to drive during 1990 as it was during 1980 as absolute risk estimates have doubled (crash involvement frequencies may not have doubled as this depends on the actual amount of exposure). The relative risk of young driver crash involvement (relative to older drivers) has remained constant at 2: 1 and this could be interpreted as indicating a degree of stability in ambient levels of safety (i.e. increases in absolute risk reflect changes in factors other than safety, e.g. crash reporting rates).
The respective contributions of ambient safety and other factors to changes in the absolute risk of crash involvement can only be partially resolved through reference to relative risk estimates. Other measures of safety which are less affected by non-safety factors such as fatality rates may assist but these may not be directly comparable (or equally affected given the severity difference) to crash risk estimates. Such issues should be kept in mind when the results section is read.
3.0
PREVIOUS STUDY
The original work was all done on the basis that driving experience was the most acceptable method for discriminating between driver groups. Experience-based countermeasures (rather than age-based) were considered most equitable and were
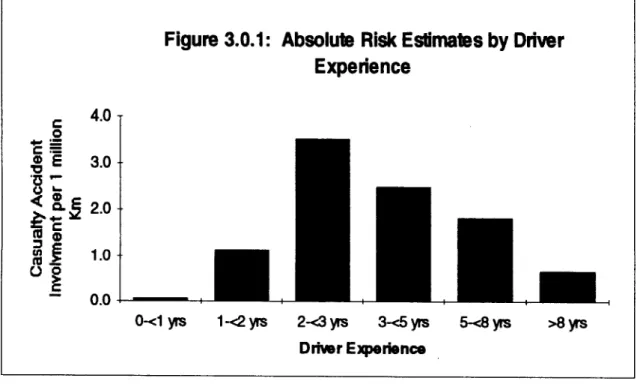
consistent with the road safety focus on the target group as new drivers rather than young people. However, it is not possible to duplicate this work as the crash database algorithm used to assign duration of driving experience to crash involved drivers on the basis of driver age and licence numbers is no longer appropriate. When applied to 1988 crash data, the method only achieves a 62% success rate in deriving driving experience from driver information. As shown in Figure 3.0.1, this is a particular and obvious problem for the least experienced driver group.
Figure 3.0.1: Absolute Risk Estimates by Driver
Experience 4.0
c
o•..=
c
=
30 (I) E . '0.~
o ~
.-«
!.~
2.0 ~ •.. RI C ::l <D en ~ 1.0nl_
O~ 0.00-<1 yrs 1-<2 yrs 2-<3 yrs 3-<5 yrs 5-<8 yrs >8 yrs
Driwr Experience
Thus, the only available method for comparing 1984 and 1988 risk estimation outcomes is on the basis of driver age groups. Two points should therefore be kept in mind:
• the 1984 results are slightly different to those previously reported as the risk estimates are now age-based.
• the 1984 to 1988 comparisons need to be made with the information presented in Section 2 in mind.
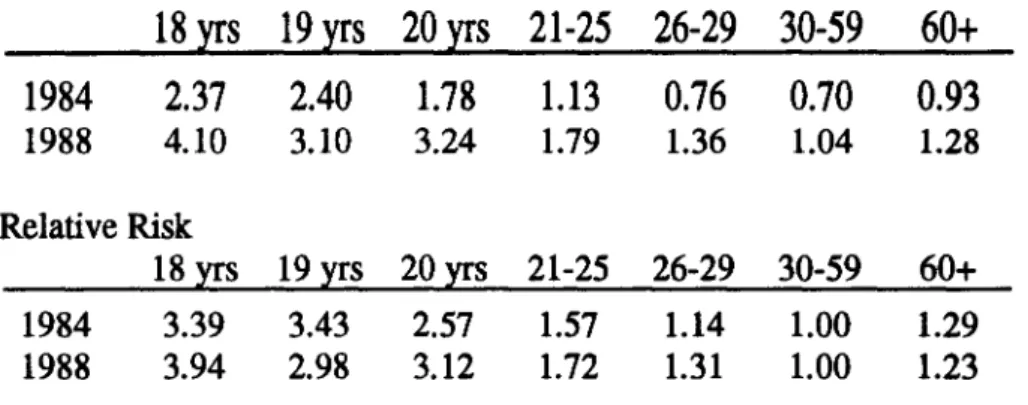
Table 3.0.1 presents 1984 and 1988 risk estimates as a function of driver age group to allow direct comparisons to be made. It should be noted that Table 3.0.1 demonstrates the greater stability of relative risk estimates: for example, whereas the absolute risk estimate for 18 years has increased some 73%, the relative risk estimate has only increased by some 16%. This outcome is generally applicable across the various age groups.
Table
3.0.1:
Absolute/relative risk estimates by driver age group (1984 and 1988)Absolute Risk 18 yrs
19 yrs 20 yrs21-25 26-2930-5960+ 1984 2.37 2.401.78 1.13 0.760.700.93 1988 4.10 3.10 3.241.361.041.281.79 Relative Risk 18 yrs 19 yrs 20 yrs21-25 26-29 30-5960+ 1984 3.39 3.43 2.571.141.001.571.29 1988 3.94 2.98 3.121.311.001.721.23
4.0
UPDATED RISK ESTIMATES
4.1
Introduction
This section presents the results of the updating exercise. Both absolute and relative estimates of the risk of crash involvement are provided, primarily in graphical form. The criterion on which all relative risk estimates are calculated is the overall absolute risk of crash involvement for drivers aged 30-59 years. As can be seen in Table 4.2.1, this driver group has the lowest level of absolute risk (1.0 casualty crashes per million kilometres travelled), making them an appropriate baseline comparison group. All data used in the estimation of crash risk outcomes are presented in Appendix B.
4.2
Results
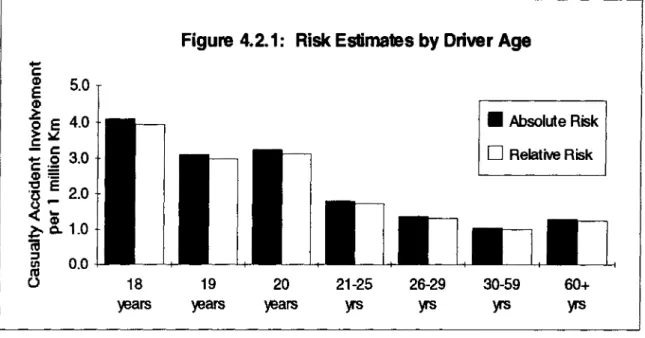
Table 4.2.1 presents overall crash frequencies, aggregate exposure estimates and absolute and relative risk estimates as a function of driver age.
Table 4.2.1: Risk estimates by driver age
Age 18 years 19 years 20 years 21-25 yrs 26-29 yrs 30-59 yrs 60+ years Crash Involvement 423 610 595 2338 1332 5241 858 Exposure Estimate (millions) 103.3 196.7 183.4 1307.2 978.8 5053.0 670.2 Absolute Risk 4.10 3.10 3.24 1.79 1.36 1.04 1.28 Relative Risk3.94
2.98 3.12 1.72 1.31 1.00 1.23These risk estimates are presented in graphical form in Figure 4.2.1. It shows the same general pattern of a skewed U-shaped curve, with younger drivers having significantly elevated crash involvement risks and the oldest driver group demonstrating a modest increase in crash involvement risk.
Figure
4.2.1:
Risk Estima1esby
Driver Age.•... c: Q) E 5.0 Q) .2: ~ E 4.0 c~ - c:
1: .2 3.0
Q)= ~ E 20 <> •••••< •..
Q)~ 0.
1.0 ta ::l IQ 0.0 C,) 18 years 19 years 20 years 21-25 ~ 26-29 ~ • Absolute Risko
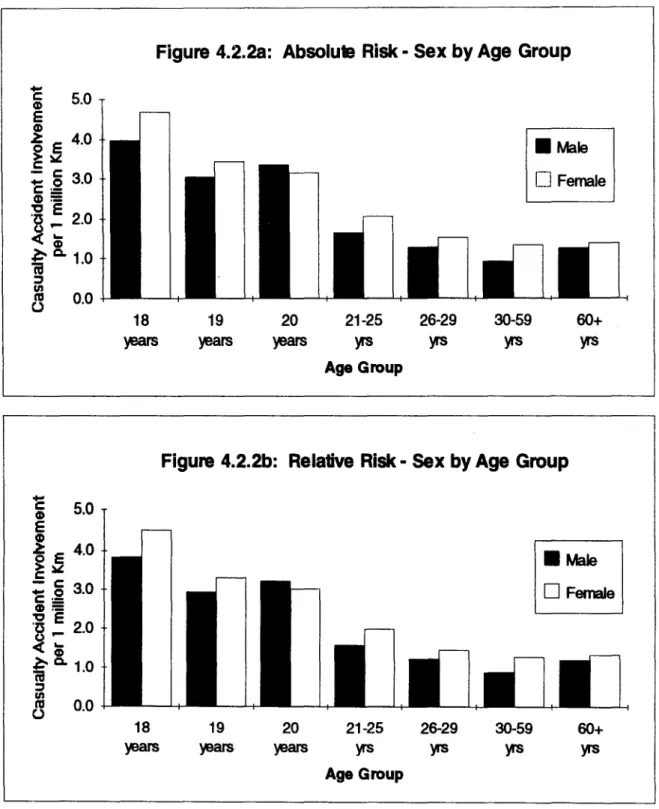
Relative Risk 30-59 60+ ~ ~One of the outcomes of the original work was the finding that on a per distance travelled basis, there were no substantial differences in crash risk as a function of driver gender (previously the young driver problem had been portrayed primarily as a young
male
driver problem). This substantive equivalency of crash risk remains when age-based risks are examined as a function of driver gender, although for most age groups, females tend to have slightly higher crash involvement risks (see Figure 4.2.2a&
b).Figure
4.2.28:
Absolute Risk - Sex by Age Group .•..i
5.0 E (I) ~ E 4.0 ~~ ::~=
~ 3.0 (1)= ~ ~ 2.0 ~;
i
Q. 1.0 ::::J Cl! ~ 0.0 18 ~ 19 ~ars 20 ~ 21-25 ~ Age Group 26-29 ~ 30-59 ~ • Maleo
Female 60+ ~Figure
4.2.2b:
Relative Risk - Sex by Age Groupi
5.0 E (I) 2: ~ 4.0~ ~ ~~ :;: ~ 3.0~=
(1)= ~ ~ 2.0<;
l:'- Q. 1 0iil
.
::::J Cl! ~ 0.0 18 ~rs 19 ~ 20 21-25 ~ }fS Age Group 26-29 }fS 30-59 }fS 60+ }fSIt had been demonstrated that night-time driving, defined at a
general level,
was associated with higher levels of risk of crash involvement for all drivers, but posed a particular problem for the least experienced driver group. On a driver age basis, this general finding remains for the youngest drivers (18-19 year olds) and, for drivers aged 60 years or more (see Figure 4.2.3a&
b).Figure
4.2.38:
Absolute Risk· Day vs. Night by Age Group 5.0 • Day Gam-6pmo
Nght 6pm-6am 4.0 3.0 2.0 1.0 0.0 18 years 19 yaars 20 years 21-25 )fS 26-29 )fS 30-59 )fS 5.0Figure
4.2.3b:
Relative Risk· Day vs. Night by Age Group• DayGanr6pm
o
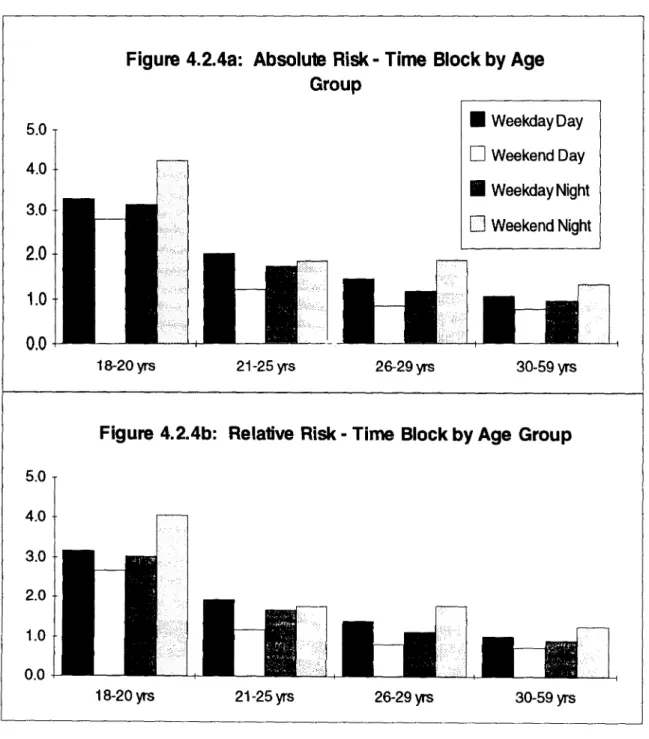
Figures 4.2.4a and 4.2.4b examine time of day controlling for time of week and presents crash risk estimates with four basic time blocks. The graphs show that weekend night-time driving for 18-20 year old drivers is a particular problem, with risk in the other three time blocks being roughly similar. The relatively high risk associated with
weekday daytime driving is perhaps surprising: this may be a reflection of the possibility that reporting of crashes in this time block showed the greatest increase as a result of the new reporting requirements.
Figure 4.2.4a: Absolute Risk - Time Block by Age Group 5.0 4.0 3.0 2.0 1.0 0.0
18-20 yrs 21-25 yrs 26-29yrs
• Weekday Day
o
Weekend Day• Weekday Night
[] Weekend Night
30-59 yrs
Figure 4.2.4b: Relative Risk - Time Block by Age Group
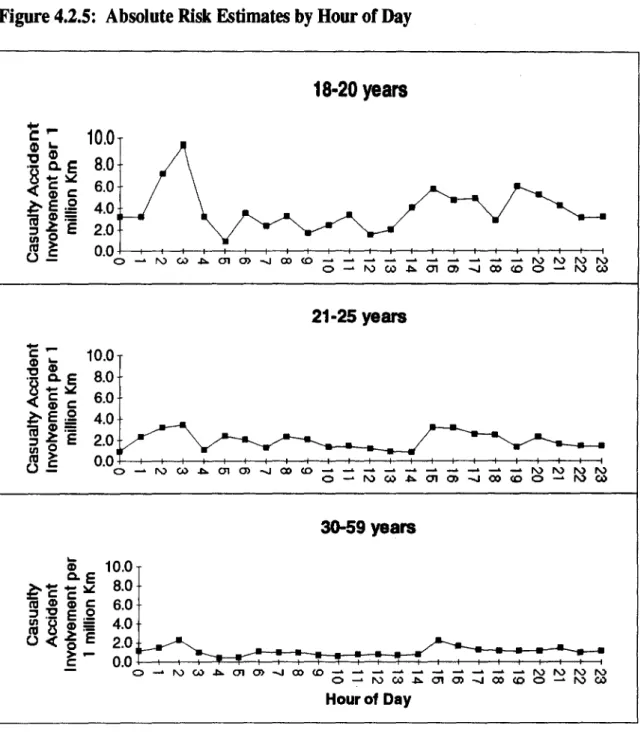
Figure 4.2.5 presents absolute risk estimated for three age groups, viz. 18-20,21-25, and 30-59 year olds by single hour of day in order to show a more detailed pattern of risk. The early morning (i.e. post midnight) period is generally associated with higher levels of risk than the late night (till midnight) period, while afternoons tend to be associated with higher levels of risk than mornings.
Figure 4.2.5: Absolute Risk Estimates by Hour of Day
18·20
years
•••• c:"'" Q) ••• ~ Q) .- Q. E~t:~
(I) c: l:- E .2 -:=(1)-rll2;=
~ 0
E"' >
u.E 10.0 8.0 6.0 4.0 2.0 0.0o~~w~rnm~OOID~---NN~N
O~l\)c.o.l:l.01o)"""(x)COO-~c.o 21-25years
10.0 8.0 6.0 4.0 2.0 0.0O-NWArnm~mID---~NNN
0-I\)C'O.l:l.010) .•..•(X)COO-~CI) 30-59years
The next set of graphs (Figure 4.2.6) extend the above information by presenting the relative risks by single hour of day for the youngest drivers by single year of age (with 21-25 year olds presented for reference). The pattern for the three youngest age groups is similar, with afternoon and night-time elevations. When presented on the same scale, the risk pattern for 21-25 year old drivers is relatively flat.
Figure 4.2.6: Relative Risk Estimates by Hour of Day
18 years
19 years
20
years21-25 years
The final set of tables in this section (Table 4.2.2) presents information on exposure, absolute and relative risk and crashes within a range of potential night-time driving restriction period. In contrast to earlier data which showed a consistent increase in risk of crash involvement as the restriction started later at night, the age-based risks appear relatively stable across these periods. It should be noted that absolute exposure is higher for 19 year olds than for 18 year olds in all restricted periods, except for the lam-5am period in which the amount of exposure affected is the same for the two age groups. A table of crash data by time of day for the whole State to support estimates of state wide benefits from exposure reduction can be found in Appendix C.
Table 4.2.2: Risk estimates of young drivers during restricted period
18 years%
AbsoluteRelative%Night-time% Total Exposure
Risk RiskCrashesCrashes 8pm-5am 25.6% 4.4 4.267.4%27.4% 9pm-5am 21.0% 4.2 4.153.5%21.7% lOpm-5am 16.5% 4.3 4.243.0%17.5% llpm-5am 13.0% 4.0 3.931.4%12.8% 12am-5am 9.1% 4.3 4.123.3%9.5% lam-5am 7.0% 3.4 3.314.5%5.9%
19 yearsAbsoluteRelative% Night-time% Total% Exposure
Risk RiskCrashesCrashes 8pm-5am 18.6% 4.3 4.160.5%25.6% 9pm-5am 16.0% 4.2 4.050.8%21.5% lOpm-5am 11.8% 4.4 4.339.9%16.9% llpm-5am 8.4% 4.6 4.429.5%12.5% 12am-5am 5.9% 5.0 4.822.1%9.3% lam-5am 3.5% 6.3 6.116.7%7.0%
Figures 4.2.7a and 4.2.7b present absolute and relative risk estimates for the four youngest age groups within each of the potentially restricted time periods.
Figure 4.2.7a: Absolute Risk Estimates During Restricted Period
-•.• 7.0 Q) Q. 'E 6.0 Q) E Q) 5.0 2: o E ~ :w: 4.0 - c: .•••0 c: .-Q) :: 3.0 :g E ~ 2.0i'
1.0 :;:, III l'll () 0.0Spm-5am 9pm-5am 1Opm-5am
[ • 18years
o
19years11pm-5am 12am-5am 1am-5am
• 20 years
0
21-25 years ]Figure 4.2.7b: Relative Risk Estimates During Restricted Period "-Q) c.. 7.0 .•.. c: ~ 6.0 Q) ~ E 5.0 ~:w: - c: 4.0
.•••0
c:=
Q) == 3.0 "C E 'S - 2.0 -<: ~ 1.0 ~ 0.0While the general stability of risk across these periods has been noted, the elevated risk of 18 and 19 year old drivers in each period is marked (except for 18 year old drivers in the lam-5am period). Figure 4.2.8 shows graphically how exposure, risk, and crashes vary as a function of possible commencement time of a night-time driving restriction.
Figure 4.2.8: Crash, exposure, and relative risk as a function of possible commencement time of a night-time driving
restriction
(18
year aids)80 60 Percent of night-time 4 era •••• and _poIUrW 0
risk •• timat ••
10pm
11pmMidnight Starting hour of poaible 1.-cu".. (aDending at 5 am)
5.0
CONCLUSION
% Night-time casually crashes
%Annual exposure FIelalive risk estimates
This short report has presented an analysis of risk of crash involvement estimates for 1988 in Metropolitan Melbourne. By necessity, the analysis was age based, in contrast to the original work which was primarily experience based. It was noted that factors other than the ambient level may have affected the incidence of
reported
crashes, perhaps reducing the direct comparability of the two sets of results. Nevertheless, the same general patterns of results have been obtained, namely the increased risk of crash involvement for younger drivers, the approximate equivalence of risk as a function ofREFERENCES
Drummond, A. E., Sullivan, G.
&
Vulcan, P. (1991). A descriptive analysis of the Victorian road toll. Monash University Accident Research Centre, Melbourne. Drummond, A. E.&
Healy, D. 1. (1986). The risk of driver crash involvement perdistance travelled in Metropolitan Melbourne. Proceedings of the 13th Australian Road Research Board Conference, 13(9), 149-159.
Drummond, A. E.
&
Torpey, S. E. (1984). Young and/or inexperienced driver accident study: Interim report of the expert working group. (No. 3/84-GR) Road Traffic Authority, Melbourne, Australia.White, W. T. (1979). Survey of driver exposure to risk: Overview of findings. Proc. Seminar on Driving, Road Traffic Safety Research Council, Wellington, New Zealand.
APPENDIX A
Holiday period (marked X) in 1988: JanFebAprMayJunJulAugSepOctNovMarDee
1 XXX X XX 2 XX X XX 3 X X XX 4 X X XX 5 X X XX 6 X X XX 7 X X XX 8 X X XX 9 X X XX 10 X X XX 11 X XX X 12 X X XXX 13 X X XXX 14 X X X X 15 X X X 16 X X 17 X X 18 X X 19 X X 20 X X 21 X X 22 X X 23 X X 24 X X 25 X X X 26 X X X 27 X X X 28 X X X 29 X X X X 30 X X X X 31 X X X
-
-APPENDIXB
All data used in the estimation of the 1988 crash risk outcomes are shown in the following tables.
Page
Age Group x Sex 21
Age Group x Time Block (weekday day/night vs. weekend day/night) 21
Age Group x Sex CrIIh ExpcllllllExpo_ •• 37/1 000000 Unknown Female Male Total UnknownUnknownTotalTotalFemaleMaleFemaleMale Unknown 8 12 25 45 96307628.22183029910449367.727627303.8735.63 0-17 yrs 71 120 19112.312414028.93332699912973.38 18 years 1 1412814236245581615630.20103.28191271070.7727913212.31 19years 235 375610 134622185036168.46123.24196.69333086553158484.98 20 years 227 3685952815572.32110.00183.3649556841.0419545302972999 21-25yrs 3 986218345 12917607477.951307.18821.1513492338 22193256 353292088.08 26-29 yrs 3 537792353.77837901332621.94978.819561475 16809178 264544433.10 30-59 yrs 7 1977765939 402498091489.243535.435053.013257 5241 95552180 13656792828.34 60+ yrs 1 22763085852010163.78504.48670.184426394 13634489 181128931.92 Total 23 44132308392 71972122 157409809 2316903232862.975824.168572.54719711633 85.41
AbIoIut. RIIk AeIIIIV. RIIk
Unknown
FemaleMale Total UnknownTotllMaleFemale Unknown 0.22 3.100.222.980.850.640.890.66 0-17 yrs 21.02 13.44 15.52 20.21 12.92 14.92 18 years 0.43 4.670.424,493.823.943.974.10 19 years U3 3.04 3.10 3.30 2.93 2.98 20 Y'" 3.14 3.35 3.24 3.02 3.22 3.12 21-25yrs 0.37 2.061.791.64 0.361.581.981.72 26-29 yrs 0.97 1.521.271.36 0.931.461.221.31 30-59 yrs 0.25 1.330.921.04 0.241.28 0.891.00 60+ yrs 0.52 1.391.251.28 0.501.201.231.33 . Total 0.27 1.661.241.36 0.261.191.301.59
Age Group x Time Block CNIIl Unknown 1 253S8 4589918318.8728518887.72 10.55 0·17y •• 1 1172319118383034182.348751712.31 2.50 18 y•••• 2 1985310942383117125218.98597883103.28 22.12 19 y•••• 279 73 90 188810284555438.78777417188.89 2e.78 20 y•••• 1 288 921091255952288751183.3827.8943.28748815 27.71 21·25y •• 4 1170280233850038415805803221.42272.78 1807.188187285 228.19 28·29 y•• 4 718133214e27313398889189174.09181.0514'.00978.'143528194000135284544484705050495.88 30-59y •• 14 3120859524184479317880 22848298 17052015 17349738 138587929 2934.78804830.112841.114 5053.01 845.39 80+ y •• 3 552131185811853297711870.18'85138.1942.3551.0718112894138018511448573734755438.57 TollI 30 844515482140118331273821893119321881470 31537744 32858228 281880325 4712.40 1477.49 1188.1101215.758572.54
WD-O= Woakdoy Day0.1130.270.480.530.550.280.480.88 0.97 Unknown
WE-D. Woak•• d Day
0·17 y •• 17.20 9.21 8.84 50.8515.52 18.548.588.85 48.70 W~. Woakdoy NIght 18y •••• 4.52 2.40 3.71 5.234.10 4.352.305.023.57 WE-N. Woak_ NI~I
19y •••• 2.85 2.54 2.32 5.373.10 2.742.442.235.17 20 y•••• 3.18 3.32 3.114 2.8113.24 3.048.1113.782.78 21·25y •• 2.00 1.23 1.73 1.831.79 1.92 1.18 1.87 1.78 28·211y •• 1.45 0.851.17 1.841.38 1.311 0.821.771.13 30·59y •• 1.08 0.780.981.311.04 1.02 0.750.1121.28 80+ y•• 1.28 1.011.88 1.871.28 1.21 0.971.7111.80 TollI 1.37 0.991.33 1.781.38 1.82 0.881.881.28
Age Group x Time of Day CI'1IlIh Unknown 0-17vrs 18 vears19 vears 20 vears 21-25vrs 26-29 vrs60+ vrsTdal 30-59 vrs 12-1am 1 1518240181415745 1-2am 1 49 129 4314424393 2-3 am 1 6 139 4212716364 3-4 am 1 5 109 318714161 4-5 am 1 5 8 6 156312151 5-6 am 1 31 36 30733862 6-7 am 2 7 8 1265153765419716 7-8 am 1 18204334 1433347138337 8-9 am 2 27273939 2014339039441 9-10 am 9 121217825223445335 10-11am 1 4 156014183921940535 llam-12pm 2 9 122130855824852863 12-1pm 5 8 162899115727157479 1-2pm 11 1617 23 7538 23648569 2-3 pm 2 3 202369175022847462 3-4 pm 4 8 192734 1474478588983 4-5 pm 4 20375852 196106012447198 5-6 pm 5 16476266 228108612846173 6-7 pm 5 7 31209504211893441953 7-8 pm 3 11244938 1442816748440 8-9 pm 2 5 241043525151447 397 9-10pm 7 182831793723815417 10-11pm 1 9 208332927143812215 llpm-12am 3 14 19 17 645210816 293 Unknown 1 1 2 1 4430143 Total 45 191423595610 23381163313325241858
Age Group x Time of Day
Expou'e 18v •••••
19veal'8
2060+veal'8TelIaIVI'821-25VI'8 26-2930-59VI'8VI'8
12-1 am 20288 7562 570101269301133919216163165142344813769033 3730465 1-2 am 103874633 24648102364193775049454212760933505472231426712 2-3 am 13787 43824 31175 29945 3578061800484219526518 1085055 34 am 10569 2853229173 241479104288115195421142950378 4-5 am 8063117609 22095 18830 363238168436613894294803067559 5-6 am 5268 7691 436242323822957794343344366815187047788193 6-7 am 5751 66755 34954 16561886178349836609428137479548418214 7-8am 3350270738 426258 429939 29373381570691715093799206360923555 8-9 am 21666 2600 15656023238544223072891831171243815181781178183 17624969 9-10 am 33819 153341274585218860 108762417386941361040715859518517533 10-11 am 395437 3974 83743 160118122151627963415850161427464814120749133136 11am-12pm 215553 26041 148380205321153996 1609197126986317393658640521 14208237 12-1 pm 46420 303928433303231106 2200957180622012395639472687 15734184 1-2 pm 14195 69403 130502350016261257 216809319083811637336817839459687576 2-3 pm 44805 43779 70120 66852 2638032263423169011816302587678248 13751406 34 pm 20398 90015 18498499591 1255267534627213414739562729294272 4-5 pm 17486 15614 18597916859221245125837529127421211225517787919986284 5-6 pm 2457099697 109075235809448898337036716785141134918720542059799824 6-7 pm 84736 794 19631122399421575919065661231911319520009576365733317 7-8 pm 34002 24837 103321204069194804 28363001165331712164746679361360149 8-9 pm 1788 9559 127558123075716979213732633587096301635973905292241 9-10 pm 38109 29796 126669225258144267 1327450100405561328652920234317027 10-11 pm 530045 5454 98946 177760157534825473733086997021613844101226523 11pm-12am 5991 2719 108030121201418130413713225230455181543788934222374 Unknown 0 Total 1830301332701 27913225315849 4955685 35329207 26454443 136567925 18112893 231690326 EllpoIurex 37/1000000 v•••
20V_60+Tell.v••21·25VI'8 26·29",.30-59VI'8
12-1 am 0.75 0.28 2.11 4.708.00 41.96138.0316.5861.102.55 1-2 am 3.64 0.02 0.91 3.79 4.72 18.3012.4071.7026.730.99 2-3 am 0.51 1.62 1.15 1.11 13.2415.6140.156.660.24 3-4 am 0.39 1.06 1.08 8.933.8615.5835.164.26 4-5 am 0.30 4.35 0.82 0.70 13.4435.0862.325.142.50 5-6 am 0.19 0.28 1.81 8.60 12.70109.4413.5769.213.26 6-7 am 0.21 2.47 1.29 6.13 31.8934.88276.74184.4015.47 7-8 am 0.12 10.02 15.77 15.91 108.68340.64581.1655.8534.17 8-9 am 0.80 0.10 5.79 15.6310.7085.98433.3656.17652.1243.59 9-10 am 1.25 5.67 10.168.10 40.24315.1564.33503.5958.68 10-11 am 14.63 0.15 3.10 5.92 10.3545.20337.9358.65528.1652.25 11.,..12pm 7.98 0.96 5.49 7.605.70 59.5446.98327.10525.7064.36 12-1 pm 1.72 11.2516.038.55 81.4466.83350.49582.1645.86 1-2 pm 0.53 2.57 4.83 12.959.67 80.2270.61358.44605.8166.01 2-3 pm 1.66 1.62 2.59 2.479.76 83.7562.53284.10508.8060.32 3-4 pm 0.75 3.33 6.843.68 46.4435.38197.81343.8949.63 4-5 pm 0.65 0.58 6.88 13.8910.1562.3841.53288.15460.7036.49 5-6 pm 9.09 0.36 4.04 18.0913.7087.2576.01362.59621.0549.92 6-7 pm 3.14 0.03 7.26 24.2982.8811.8172.22354.33583.0927.13 7-8 pm 1.26 0.923.82 7.557.21 104.94431.17247.1445.0113.33 8-9 pm 0.07 0.35 4.72 5.08 6.28 45.54233.1636.03124.2710.81 9-10 pm 1.41 1.10 4.698.335.34 49.12226.9237.15108.0511.73 10-11 pm 19.61 0.20 3.66 6.589.43 58.29259.8031.23122.428.38 llpm-12am 0.22 0.10 4.00 5.07 6.71 44.84191.7229.1993.358.23 Unknown 0.00 Total 67.72 12.31 103.28196.69183.36 1307.185053.018572.54978.81670.18
Age Group x Time of Day AblloIuIe RI8k Unknown 0-17vrs 18Velrs 19Velrs
2060+VelrsTelalvrs21-25vrs 26-2930-59vrsVI'8 12-1 am 3.57 7.11 2.98 2.25 0.95 0.901.961.211.32 1-2 am 0.26 170.792.353.171.913.041.941.462.019.87 2-3 am 3.70 11.2716.593.172.408.122.313.16 3-4 am 12.79 9.47 8.34 3.47 3.631.03 0.232.47 4-5 am 1.15 9.798.611.12 2.330.400.431.01 5-6 am 5.13 3.51 1.86 0.702.360.520.610.480.79 6-7 am 9.40 3.24 9.28 2.45 2.041.551.031.071.36 7-8 am 8.07 2.00 2.732.141.491.321.080.981.23 8-9 am 2.49 280.673.642.502.340.941.671.001.384.66 9-10 am 7.19 2.12 1.18 2.102.040.810.600.740.90 10-11 am 0.07 27.203.041.351.330.670.674.840.650.77 11am-12pm 0.25 9.34 2.19 2.765.271.231.430.980.761.00 12-1 pm 4.66 1.42 1.751.291.22 0.851.720.770.99 1-2 pm 4.28 3.31 1.31 2.380.930.541.050.660.80 2-3 pm 1.21 1.85 7.71 6.872.360.820.801.030.800.93 3-4 pm 5.30
PO
3.949.233.172.521.672.262.49 4-5 pm 6.18 34.623.745.723.142.992.695.381.632.30 5-6 pm 0.55 44.594.522.6111.651.681.463.651.271.75 6-7 pm 1.59 238.272.063.562.521.631.951.181.604.27 7-8 pm 2.38 11.976.495.271.371.873.006.281.141.56 8-9 pm 30.23 14.145.09 4.925.572.280.651.221.221.70 9-10 pm 6.35 3.84 3.36 5.81 1.61 1.021.451.431.64 10-11 pm 0.05 44.604.111.421.221.491.791.005.461.27 11pm-12am 13.53 3.50 3.742.531.431.781.941.161.53 Unknown Total 0.66 15.523.103.241.791.361.284.101.041.36 AIIlIlIve FIIk Unknown 18 ••.• 19 ••.•0 21-2526- 930-5960+ 1'1 1'1 Tdll 12-1 am 6.84 2.87 2.16 0.920.871.881.161.27 1-2 am 0.25 9.49 3.051.83 2.262.921.861.401.93 2-3 am 3.56 10.8415.953.052.317.812.223.04 34 am 12.29 9.11 8.02 3.343.490.230.992.38 4-5 am 1.10 9.418.282.241.070.380.410.97 5-6 am 4.93 3.38 1.79 0.67 2.270.500.590.460.76 6-7 am 9.04 3.11 8.922.351.961.490.991.031.31 7-8 am 7.76 1.92 2.622.061.271.431.040.941.18 8-9 am 269.872.403.502.251.610.900.961.334.482.40 9-10 am 2.020.782.031.141.960.570.710.86 6.92 10-11 am 26.162.920.641.301.280.644.650.620.740.07 11am-12pm 0.24 8.98 2.10 2.665.061.371.190.940.730.97 12-1 pm 4.48 1.37 1.681.24 1.17 0.821.660.740.95 1-2 pm 4.12 3.19 1.26 2.290.900.521.010.630.77 2-3 pm 7.416.612.271.780.790.770.990.770.901.16 3-4 pm 3.798.873.042.425.10 5.49 2.17 1.612.40 4-5 pm 33.295.94 5.17 3.60 5.503.022.872.581.572.21 5-6 pm 42.884.352.5111.201.621.413.511.221.680.53 6-7 pm 229.113.421.982.421.571.881.141.544.101.53 7-8 pm 11.512.29 6.04 6.245.071.321.792.891.091.50 8-9 pm 13.5929.07 4.89 4.735.362.200.621.171.171.64 9-10 pm 3.235.580.983.691.551.391.371.58 6.11 10-11 pm 42.883.951.371.171.431.720.965.251.220.05 11pm-12am 3.602.441.711.371.1113.01 3.37 1.871.47 Unknown Total 14.922.983.121.311.721.233.941.001.300.64APPENDIXC
Victoria: Age Group x Restricted Period
Cralh Unknown 0-17 vrs 18 vrs 18 vrs 20 vrs 21-25 vrs 28-28 vrs 30-58 vrs 80+ vrsTotal 5am-8 pm 2152 130 1250291291313138712355261649512975 8-9 pm 52 15 85 10010242286464159 1305 9-10 pm 63 11 87867924244118422 1152 10-11 pm 63 14 97 905423435116340 1043 llprn-12am 16 8 49824616020232285111 12-1 am 27 13 48 44 511381801261 574 1-5am 65 27 11313113017387336175 1381