Identifying critical components in water
networks using time-dependent data
Nazli Yonca Aydin
11 Future Resilient Systems, Singapore-ETH Centre, 1 Create Way, CREATE Tower, #06-01, Singapore 138602
Abstract
Water supply systems are under stress due to population increase, climate change, aging infrastructures, terrorist attacks etc. all of which have an impact on the operation of water infrastructures resulting in failures/disruptions. The aim of this research is to evaluate the structural and operational properties of water supply systems together and identify the most critical locations in water networks and evaluate the systems’ functionalities. Graph-based metrics, called the entropic degree, is used to identify the critical locations on different network structures using the flow as a weighting parameter on links. The results would assist authorities, decision-makers in strategic plans for prioritizing and rehabilitating network components, identifying vulnerable locations as well as in enhancing the resilience of future water supply systems.
1
Introduction
Critical infrastructure systems are lifelines of cities and built to last long time while they continuously need maintenance and rehabilitation to satisfy the societal needs. Water distribution systems are important parts of critical infrastructures and provide water to communities as well as industrial and agricultural areas. Although water networks are very crucial as a whole, operation and maintenance of water networks require a capital. Authorities and decision makers need to prioritize the components that require maintenance and replacement while allocating resources. Therefore, identifying critical components of a system and maintaining a satisfactory level of performance at these locations are crucial [1]. In addition, identifying and protecting critical locations will assist in reducing vulnerabilities due to disruptions such as damages, attacks and/or natural hazards.
Structural properties play an important role in determining the critical locations in a water network [2]. Spatial distribution of critical locations will differentiate in a branched network configuration to a looped system. In this study, two distinctive water networks with different topological features are selected to identify critical components in water networks. Therefore, this study assists in identifying the influence of a network structure on changing criticalities. A graph-based metric, entropic degree, is implemented for the identification of critical locations in water networks using the results of
Volume 3, 2018, Pages 123–130
extended period simulations from the EPANET [3] and flow parameter as a weighting factor on the links. This way, not only the critical zones identified at water networks, but also the influence of daily demand variations (i.e., peak, minimum, and base demands) as well as hydraulic properties and the spatial distribution of critical locations over time in different network structures are investigated. In other words, the extended period hydraulic simulation parameters are incorporated into structural vulnerability analysis. The results could assist decision makers in maintaining the water supply systems, providing uninterrupted services for different uses and planning the resilient water resources infrastructure.
2
Literature Review
Although there is a limited number of graph theory measures that can be applied effectively to physical networks with flows in links and demands at nodes such as water networks, complex networks theory and applications have limited use in the water resources engineering field to evaluate structural vulnerability, reliability and resilience of water networks. For example, Yazdani and Jeffrey [4] evaluated the structural redundancy and robustness of water network topologies using connectivity metrics such as spectral gap, degree distribution, algebraic connectivity and meshedness co-efficiency while modeling the water network as the undirected and unweighted network.
Giustolisi, et al. [5] classified water network structures based on their “neighbourhood” degree distribution. This method expands the degree of a node by including the total degrees of adjacent nodes. After classification of 22 real-world water network examples, authors conclude that water networks are random-like. The problem with the degree centrality is that spatial networks such as transportation or water networks display restriction due to the spatial referencing. In other words, nodes in physical networks can have limited number of connections [6]. Bristow and Hay [7] used graph representation for water networks to evaluate resilience and recovery. Graph representation was specifically used to model dependency graphs. Meijer, et al. [1] evaluated the critical components of a sewer network using a graph-based index, which is defined as a function of a travelling cost between sinks and sources and the connectivity of a graph. The costs are ranked and compared to the results with a hydrodynamic model method, which is based on ranking the pipes based on their performance of increasing a ponded volume of water.
One of the most widely used graph-based metrics to evaluate critical components is called betweenness centrality. Agathokleous, et al. [8] conducted a study based on the fact that the topological robustness would change when operations in water networks change over time. As a result of this operational variation, vulnerable sections in the network shifts from one section to another. This study uses the betweenness centrality to create heat maps from the results to observe if there is any connection between the changes in betweenness centrality overtime and observed failure records of a water network during a 7-year period starting from 2003 in Nicosia, Cyprus. Shuang, et al. [9] proposed a methodology to evaluate the reliability of water distribution systems. As a part of this study, authors identify critical pipes in a network using a reliability-based approach. These results are compared with a graph-based centrality index of edge betweenness centrality, which is traditionally used to evaluate critical links in a graph. Results were presented to use towards improving network properties to resist disasters and cascading impacts. However, authors state that the edge betweenness measure cannot be solely used as an indicator to modify network properties as it ignores fundamental flow information and related hydraulic properties.
into graph-based vulnerability assessment. They apply the proposed metric on two different case studies: one is the Richmond distribution system from the Yorkshire water service area in the UK, and the other one is the Colorado Springs Utilities. This metric, called entropic degree was first proposed by [11] for power networks, is modified (i.e., demand adjusted entropic degree) to identify critical components of water networks. The metric incorporates node weights (i.e., node demand), connected link weights (i.e., pipe capacity) into the vulnerability analysis. Therefore, it enables differentiation of nodes and provides a more realistically structural modelling. However, in their study, the metric is applied to water networks in the steady state condition using pipe capacity and nodal base demands as weighting factors on the links and nodes, respectively. Their approach ignores the daily demand variations and/or hydraulic parameters such as flows in links.
Although the literature emphasizes the importance of hydraulic properties when evaluating critical components, the most graph-based metrics tend to evaluate the critical locations in a structural point of view while ignoring the hydraulic performance such as flow in pipes and/or daily demand variations. In this study, this gap in the literature is addressed by evaluating the critical locations in two different water networks with different structures using entropic degree by assigning hourly flow parameter as weights on pipes. Therefore, not only the structural properties of nodes (i.e., degree centrality) are considered, but also the hydraulic performance of water networks is included in the criticality analysis.
3
Materials and Methods
There is a limited number of graph metrics that can be applied effectively to physical networks with flows in links and demands at nodes such as water networks. Here, graph-based metrics are investigated first in order to identify overall structural properties of water networks. Algebraic connectivity and meshedness coefficient are selected to characterize the connectivity level of water networks (see Table 1). These metrics are considered specifically for selecting case studies with different topologies. The case studies are selected from the research database of water distribution system models [7] focusing on the approximately the same number of nodes with intuitively different topologies (i.e., branched and looped configuration). These case studies help us to understand the similarities or differences in the spatial distribution of critical components on various water network topologies.
Once the study areas are selected, network data is processed. The network processing includes representing water distribution systems as mathematical graphs G(N, L), where N is the set of nodes with n number of elements, L is the set of links consists of m elements and adjacency metrics are
Metric Definition Algebraic
connectivity
The second smallest Eigenvalue of normalized Laplacian matrix of the network [2] (λ")
Meshedness coefficient
The fraction of the total and the maximum number of independent loops in planar graphs [2]
R%= m − n + 1 2n − 5⁄
m = # of edges, n= # of nodes
Entropic Degree Measuring importance of nodes considering weights on edges [11] k0
1= ( 1 − ∑ p
06logp06) ∑;6=><w06 ;<
6=> p06=
w06
∑;6=><w06
?
p06= normalized weight
created accordingly. The daily demand pattern representing high demand from 6 AM to 9 AM and from 5 PM to 8 PM is assigned to each demand node for both networks. In addition, both systems are analyzed in flow units of Gallons Per Minute using the Hazen-Williams head loss formula. EPANET [3] is used for hydraulic simulations to obtain the flow of links, which are applied for 168 hours. The results between 72-96 hours (i.e., 24-hour) are taken into account. This will assist in identifying the way critical locations change over time as a result of the daily demand variation.
The entropic degree is evaluated for each time step and normalized using maximization method such that the maximum value gets the degree of 1 while the minimum entropic degree value gets the value of 0. As a final step, the results are illustrated in 4 classes (i.e., [0-0.25], [0.25-0.5], [0.5-0.75], [0.75-1]) to identify critical locations and zones in both water networks. Kernel density in ArcGIS software is a commonly used spatial analysis tool for finding densities of houses, crime locations, roads or utility infrastructure lines etc. and calculates the density of point features and provides outputs as raster images [12]. Finally, kernel density analysis is applied to identify density zones from entropic degree and the spatial distribution of critical locations on water networks.
4
Results and Discussions
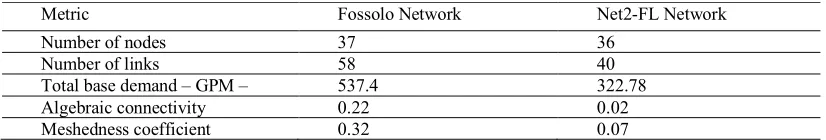
Two distinctive networks are selected for this study from [13], the first network called Net2-FL which has 35 nodes, 1 tank and 40 pipes, and the other one is Fossolo network which has 36 nodes 1 reservoir and 58 pipes. Algebraic connectivity and meshedness coefficient results for both water networks and network properties are given in Table 2. These results indicate that the connectivity of Fossolo network is significantly higher than the Net2-FL and that it can be considered as the loop system while Net2-FL can be identified as branching network.
In order to evaluate the entropic degree, flows on pipes at each time step (i.e., time steps from 76 to 96) are used as weighting parameters. Therefore, the entropic degree of each node is evaluated for each hydraulic simulation time step (i.e., 1 hour). The results are only illustrated for the minimum, base and the peak demand hours (see Figure 1 and 2). As can be seen in Figure 1, critical nodes/zones in Net2-FL change considerably as a result of the daily demand variation and reservoir operation while the critical locations and kernel density classes do not change even if the flow on each link changes in the looped system (i.e., Figure 2, Fossolo network). Note that the magnitude of entropic degree at each time step changes in Fossolo network, however, variations in the corresponding normalized scores are insignificant. This indicates that the connected water networks (i.e., looped configuration) are more robust against demand variation on nodes.
Identification of critical locations using entropic degree can assist authorities in several applications. One example is that the information of criticality can be used in contingency planning scenarios and assist in identifying the consequences of a major failure, disruption or natural disaster on these locations and preparing crisis management. One advantage of using the entropic degree is that the flow on pipes is taking into account as weights. Therefore, the criticality of the network
Metric Fossolo Network Net2-FL Network
Number of nodes 37 36
Number of links 58 40
Total base demand – GPM – 537.4 322.78 Algebraic connectivity 0.22 0.02 Meshedness coefficient 0.32 0.07
Figure 1: The results for entropic degrees for minimum, peak and base demands for Net2-FL network
In addition, evaluating the changes in the node criticalities will assist decision makers in reducing vulnerabilities and creating operational and maintenance, rehabilitation plans as well as in designing the future water supply. This includes prioritizing zones for rehabilitation actions of water networks with different structural properties. This method can be a guideline to identify zones with the highest impact on operations that need to be rehabilitated to increase the performance level.
5
Conclusion
Previously, the entropic degree was evaluated in the literature using the pipe capacity information and/or the steady-state parameters of water networks by Yazdani and Jeffrey [10]. However, in this study, the entropic degree is evaluated for water networks to identify the critical locations on different network structures using the flow parameters on links. The novelty of this study lies in using the time-depended flow information extracted from extended period hydraulic simulations as weights link while evaluating the entropic degree.
The proposed methodology assists in reflecting impacts of daily demand variations and hydraulic simulations as well as identifying vulnerable locations in water networks. Consequently, operational properties of water networks are incorporated into the topological evaluation using the entropic degree. This approach can be used as a decision support tool for authorities and agencies to identify vulnerable locations, prioritize rehabilitation zones as well as to design resilient water networks. As a future work, scenario-based disruptions will be simulated and networks’ recovery and resilience performances against major disruptions will be evaluated.
References
[1] D. Meijer, M. van Bijnen, J. Langeveld, H. Korving, J. Post, and F. Clemens, "Identifying Critical Elements in Sewer Networks Using Graph-Theory," Water, vol. 10, p. 136, 2018.
[2] A. Yazdani, R. A. Otoo, and P. Jeffrey, "Resilience enhancing expansion strategies for water distribution systems: A network theory approach," Environmental Modelling & Software, vol. 26, pp. 1574-1582, 2011.
[3] L. A. Rossman, "EPANET 2 Users Manual," U.S. Environmental Protection Agency, Cincinnati2000.
[4] A. Yazdani and P. Jeffrey, "Applying Network Theory to Quantify the Redundancy and Structural Robustness of Water Distribution Systems," Journal of Water Resources Planning and
Management, vol. 138, pp. 153-161, 2012.
[5] O. Giustolisi, A. Simone, and L. Ridolfi, "Network structure classification and features of water distribution systems," Water Resources Research, vol. 53, pp. 3407-3423, 2017.
[6] M. T. Gastner and M. E. J. Newman, "The spatial structure of networks," Eur. Phys. J., vol. 49, pp. 247 -252, 2006.
[7] D. N. Bristow and A. H. Hay, "Graph Model for Probabilistic Resilience and Recovery Planning of Multi-Infrastructure Systems," Journal of Infrastructure Systems, vol. 23, Sep 2017.
[8] A. Agathokleous, C. Christodoulou, and S. E. Christodoulou, "Topological Robustness and Vulnerability Assessment of Water Distribution Networks," Water Resources Management, vol. 31, pp. 4007-4021, 2017.
[10] A. Yazdani and P. Jeffrey, "Water distribution system vulnerability analysis using weighted and directed network models," Water Resources Research, vol. 48, 2012.
[11] E. Bompard, E. Pons, and D. Wu, "Analysis of the structural vulnerability of the interconnected power grid of continental Europe with the Integrated Power System and Unified Power System based on extended topological approach," International Transactions on Electrical
Energy Systems, vol. 23, pp. 620-637, 2013.
[12] ESRI. (2018, 25 February). How Kernel Density works. Available:
http://pro.arcgis.com/en/pro-app/tool-reference/spatial-analyst/how-kernel-density-works.htm - GUID-3BCBF5CA-CAC7-4547-A3CF-B5E30FDE584E