Collaborative development of high resolution
pluvial flood maps for Flanders
Kris Cauwenberghs
1, Tom Feyaerts
2, Neil Hunter
3, Joost Dewelde
1,
Thomas Vansteenkiste
1, Michael Huybrighs
1, Guido Vaes
2and Rob Berry
31 FlemishEnvironment Agency, K. Albert-II laan 20, Brussels 1000, Belgium 2Hydroscan, Diestsesteenweg 104A, Leuven 3010, Belgium
3 JBA Consulting, South Barn, Broughton Hall, Skipton, North Yorkshire BD23 3AE, UK
[email protected], [email protected], [email protected], [email protected],
[email protected], [email protected], [email protected], [email protected]
Abstract
As part of the low countries and with one of the highest population densities worldwide, the Flemish region has experienced a long history of flooding causing tens of millions euro damage each year. In response to this, water managers invested over the past decade in flood modelling and mapping with a fluvial origin. In recent years, pluvial flooding has also occurred numerous times in Flanders, but a region-wide map describing these processes more in detail in terms of extent, depth and probability was lacking. Following a pilot-study in 2016, the VMM undertook in 2017 the VLAGG1
-project to develop a region-wide, high-resolution pluvial flood map for Flanders. Via a combination of state-of-the art methodologies and web technologies, a draft flood map was presented to a broad reviewing community across Flanders, who were then able to improve it further by adding local knowledge on known flooding and more detailed data on key hydraulic structures. In a three month period, over 7000 additions were made by 370 delegates from 165 organizations that have been incorporated into, and significantly improved the quality of the final flood maps which are due to be published in 2019.
1 Dutch abbreviation “Vlaamse AfstromingsGevoelige Gebieden”
Engineering
EPiC Series in Engineering
Volume 3, 2018, Pages 381–388
1
Introduction
The Flemish policy on the reduction of fluvial flood risk is based upon a “Multi-Layered Water Safety” strategy. It implies a combination of measures on protection, prevention and preparedness in order to reduce flood risk in a sustainable way. Preventative measures, aiming at reducing the consequences of flooding, are closely linked with spatial instruments like the water-test, signal-areas and a legal information duty on flooding that is applicable to all real-estate transactions in Flanders. These instruments rely significantly on available flood maps. The first generation of Flemish flood maps date from the early 2000s and were based upon a limited amount of 1D-fluvial models combined with observed flood contours from manual inventories and alluvial and colluvial zones within regional soil maps. Although over the past decade the 1D-modelled maps have increased in number (over 4000km available in 2017) and hence contributed to the enhanced quality of flood maps, a number of shortcomings were identified in both practical use of these maps and in an audit of the Flemish Ombudsman. The lack of implicit calculation of overland flow-paths, a resolution of 5m limiting the use on parcel-scale and lack of region-wide information on both flood-extent and flood probability were the main issues in current available flood maps.
Moreover, it should be noted that according to the requirements of the Floods Directive, EU-member-states need to provide information on the source of flooding to the European Commission. As Flanders only reported fluvial floods in the first generation of the river basin management plans and reported earlier the entire region is at flood risk, it became clear that extra mapping of pluvial flooding was needed. This need was reinforced in 2016 when, from May 27th till June 8th, Flanders experienced a continuous set of pluvial floods causing significant damage with totalled insured losses (in all but one municipalities) and payments by the Disaster Fund exceeding 500 million euros. This event clearly illustrated the need for a region-wide pluvial flood map that can be considered in existing water, spatial and local policies and new plans such as the local Storm Water Plans that are currently in development. Also, within the framework of insuring against natural disasters (as part of an obligatory fire-insurance), flood risk maps are used in identifying flood risk zones where the return period is less than 25 years and depths are higher than 30 cm.
Therefore, in 2016, an initial feasibility study on 2D pluvial flood modelling methods was commissioned by VMM. In two test-catchments near the cities of Brussels and Antwerp, a wide variety of tests and evaluations were carried out in order to fully discover the potential of 2D methods. This study showed a major quality enhancement on existing flood maps was possible and hence the extra VLAGG-project was commissioned in early 2017, requiring the delivery of a region-wide pluvial flood map by the end of 2017.
2
Material and methods
The models used to create the pluvial flood maps are based on the direct rainfall approach, in which specific rainfall profiles (hyetographs) are applied to a regular 2D model grid and the resulting runoff is then routed over the model grid during the simulation. The grid is a 2m × 2m mesh that is created from the 1m Flanders-wide digital elevation model. For each grid cell, a runoff coefficient is defined, based on land use, soil type and slope. A distinction is made between impervious areas of Type A (buildings and roads) and Type B (other impervious areas like private access ramps and terraces).
The rainfall profiles used are based on composite storms that were created through a statistical analysis of the regional rainfall data and are commonly applied in sewer modelling. Within the project 5 return periods are considered; 2, 10, 25, 100 and 1000-years. To be used in the pluvial flood models, a number of corrections to these standard composite storms are applied:
• The existing composite storms (representative for the 1975 climate) were corrected to represent the 2016 climate, based on predicted changes in rainfall intensity.
• The spatial variation of rain is accounted by applying a general spatial correction factor on the composite storms [1], depending on the size of the model area.
• For impervious areas, a non-linear loss model of 2mm is incorporated in the composite storms to account for local depressions in topography.
• For impervious areas Type A (roofs and streets), a rainfall profile corresponding with a 2-year storm (T2) was subtracted from the composite storm, to account for the drainage by the sewer system.
• For pervious areas, a volume correction was applied for larger return periods to achieve a better match between the models used and existing information of calibrated river models and flow measurements over the last 40 years; this correction corresponds with a decrease of the percentage of surface runoff at higher return periods.
The effect of these corrections on the total rainfall volume applied for different return periods is show in Figure 1.
Figure 1: Total rainfall volume applied for different return periods
In the hydraulic models, water is routed through the 2D mesh, using depth dependent, spatially varying Manning coefficients. To represent the flow around buildings and the backing up of water behind them, buildings were modelled as being unfloodable. To assure the passing of runoff water through artificial barriers in the DTM, approximately 35600 structures were added to the models as culverts, pumps or DTM edits. These were based on data from existing river models, a GIS analysis of presumed locations of intersections (e.g. water course intersecting railroad) and input given by stakeholders through intensive review of the maps (see below). To improve the results along water courses, the T2-flows extracted for the impervious areas of type Urban A are reintroduced in the
models, assuming 50% of the flow is re-entered at WWTP locations and 50% at combined sewer overflow locations (corresponding with the rainfall that occurs 7 times a year, which is the criterium for combined sewer overflows).
Simulations were performed using the JFlow® 2D hydraulic model [2,3,4]. JFlow solves the Shallow Water Equations (SWE) using a finite volume formulation that combines the Riemann based solver of Roe with an upwind treatment of the source terms. The model is both conservative and shock capturing, and maintains water at rest over irregular topography. JFlow is implemented on a regular grid using the supplied DTM and does not require any secondary grid generation process. This simplifies the model set up and allows for direct interpretation of the model results relative to the DTM.
JFlow has been designed with the emphasis on easy set up and model specification. Models are configured using databases, and this provides a highly ordered means to store significant quantities of data. JFlow has also been specifically designed to run in parallel on Graphics Processing Units (GPUs) in order to run 2D models at very high spatial resolution across large areas that have been computationally prohibitive on traditional Central Processing Units (CPUs). For the VLAGG-project, JFlow was run within the tailored IT ‘ecosystem’. The total run times for each of the 102 sub-models were mostly around 1-2 days, however a few of the largest models had runtimes up to 6-10 days. Simulating all 102 sub-models for all return periods, took about 1 month of simulation time for both the present day climate and the 2100 climate.
The VLAGG-project ecosystem runs in a hybrid-cloud. GPU computational resources are located in JBAs datacentre which is coupled to Amazon Web Services (AWS) cloud for the high performance website used by the Project team and stakeholders. The modelling system is controlled through a HTCondor workload management system that provides considerable flexibility through the use of directed acyclic graph (DAG) jobs allowing the models to be set up, run, prioritised and post-processed effectively. The system makes considerable use of open-source tools, comprising of PostgreSQL for the database layer, GDAL/OGR for post-processing, QGIS for the desktop GIS, and Mapserver for the WMS/WMTS mapping layers.
3
Results and discussion
Using the method described above pluvial flood maps are produced for 5 return periods (T2, T10, T25, T100, T1000) and 2 time horizons (2016 and 2100). For taking into account climate change effects, the models were run using the 2100 High Summer climate scenario specifically designed for the Flemish situation and reflecting a worst-case climate scenario [5]. For all these scenarios following maps are made:
• Maximum flood depth
• Maximum flow velocity
• Hazard rating, as a combination of flood depth and flow velocity
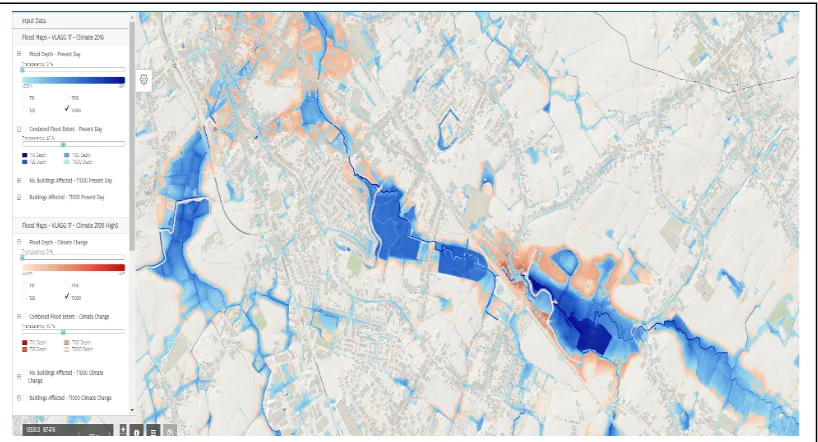
Flood depth maps are displayed in figure 2 with a continuous palette ranging from 0 to 200 cm allowing to highlight some detailed hydrographic elements as deeper river beds, ponds, … . By choosing a different colour scheme for the present day flood depths and the 2100 flood depths it was possible to display in an intuitive way both depths in one map view.
Combined maps were also made showing the extent of pluvial flooding for different return periods within one map layer. These maps are useful for professional users involved in water policy and are illustrated in figure 3. The flood depth maps are then combined with building footprint data to determine which properties are affected by the flooding. Each footprint polygon was buffered by 2m and the maximum depth of flooding determined through a zonal statistics query within ArcGIS.
Where the maximum depth of flooding around the building is greater than 0.1m then the property is identified as flooded. Per-building information is required for property conveyancing purposes but it can also be aggregated up to coarser ‘reporting units’ in order to obtain a view of flood risk that is easier to interpret at the region scale. Here, counts of affected properties were also summarized on a regular 1km x 1km grid to help prioritise the external review process described in section 4.
Figure 2: Maximum T-1000 flood depth map nearby Lebbeke 2016 (blue) and 2100 (red)
The draft national pluvial flood map for Flanders indicates in table 1 that 57.399ha is flooded at a return period of 10 years (4% of the area of Flanders). For the return period 100 years 105.174ha is flooded (8%) and for the return period 1000 years the total amount is 159.358ha (12%). Compared to the fluvial flood maps reported in 2013 to the European Commission the flooded area caused by pluvial flooding is 56% larger. Due to the high resolution 2D-modelling it is now possible to reduce the previously mapped flood zones (which were based on soil data) with 105.000ha, hence better indicating the properties really at risk on the maps.
The pluvial flood maps for 2100, taking into account climate change under a high summer scenario (RCP 8.5), show an increase of the total flooded area at return period 1000 of 290.864ha (+83%). Nearly half of these extra flooded areas due to climate change have flood depths smaller then 30cm, reflecting mostly extra agricultural areas and streets being shallow flooded while flood contours along river valleys mostly show only limited spatial increases. These areas with limited increase in peak flood depth highlight the potential for climate adaptation measures on buildings situated there. The increase in peak flood depth due to climate change is on average over the entire Flemish territory about 15-30cm. However, the expected increase in flood depth can reach up to 50-150 cm at certain locations, mainly where culverts underneath streets and railways are present, indicating the need for adaptation works on these infrastructures. Both average and peak increase in pluvial flood depth do match with earlier analysis looking at the climate change effects on fluvial floods in Flanders. Such high water levels have implications on both the impacted buildings an affected people as both the individual protection of buildings become problematic and some risks to human live start to emerge especially for vulnerable people.
In Flanders about 615.000 main buildings are currently located within the T-1000 pluvial flood contour, corresponding to 24% of all main buildings. About 385.000 (15%) buildings are located in the T-100 contour and 136.000 buildings (5%) are located in the T10-contour. Within the T-1000 fluvial flood contour, about 108.000 buildings are prone to non-zero flood depths, being more than 5 times smaller than the pluvial impact. For frequent T-10 events the ratio between pluvial and fluvial floods even increases up to a factor 13. As the Flemish pluvial flood map covers by definition the entire Flemish region and the fluvial flood maps for Flanders do only represent about 90% of total fluvial flood risk, it can be seen that pluvial floods have a dominant impact over the fluvial floods.
Due to climate change the total number of floodable buildings can raise up to 1,04 million or 41% of all buildings in Flanders. Cities like Antwerp, Gent, Brugge, Leuven and Kortrijk show the highest increase in floodable buildings, ranging from a few thousand extra impacted buildings till about 28.000 extra in Antwerp. It is also noted that the increase of floodable buildings due to climate change is higher for the pluvial floods with higher probability of occurrence. Within the T-10 contour, the factor increase for floodable buildings is about 2,4 while within the T-100 contour it is about 1,9 and in the T-1000 contour about 1,7. This indicates that areas currently already at highest risk, could see also in future the highest increase in flood impacts. This effect amplifies further when looking at floodable building where flood depths are higher than 70cm and thus can be considered as dangerous. In total 161.237 buildings could face such dangerous pluvial floods in 2100 or 2.5 times more comparing current and future climate impact.
Total area (ha) of pluvial flooding Flood depth
(m) > 0.05 > 0.10 > 0.15 > 0.20 > 0.25 > 0.30
Climate 2016
T10 57399 56321 42399 31886 24786 19708
T25 71868 70198 52491 39392 30632 24345
T100 105174 102165 76306 57705 45121 36099
T1000 159358 154262 116655 89661 71184 57770
Climate 2100 (High Summer)
T10 100037 97157 72256 54592 42675 34185
T25 131301 126876 94060 71433 56236 45279
T100 194972 187882 141126 109125 87160 71251
T1000 290864 280135 217622 175217 144152 120445
Table 1: total area of pluvial flooding in Flanders
4
External review process
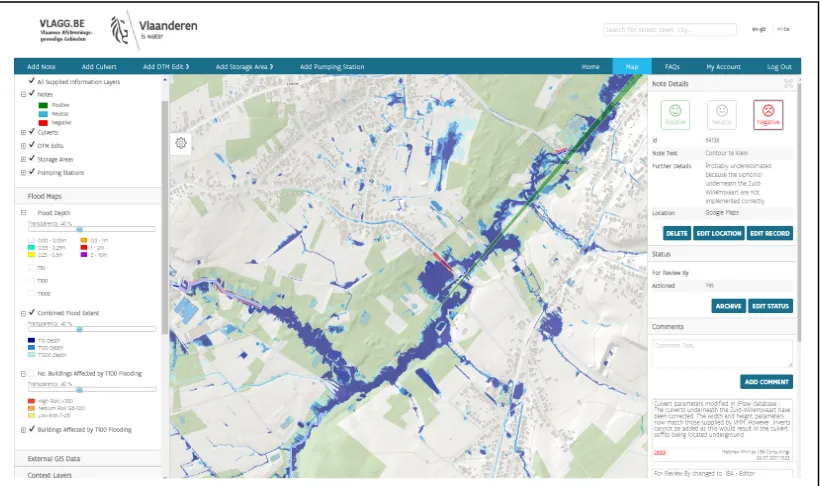
At mid-term of the VLAGG-project a first draft of the pluvial flood map was presented to professional stakeholders, together with a dedicated review-website being developed for the online review and data-enrichment of the initial maps. The review-website is a combination of a map-centric web-application together with a workflow manager and contained some dedicated tools further facilitating the review: users were able to add their own maps as a WMS, a map-difference viewer allowed for a quick diagnosis of current and previous maps together with all model changes and a flood-depth tool allowed for quick display of all depths across the return periods T10, 100 and 1000.
All 307 municipalities, all river- and sewer managers and the main road manager were invited to evaluate the quality of the maps within their working area. Based upon their local terrain knowledge, they could provide online a positive, neutral or negative score for any location they highlighted on the map. A further detail on over- or underestimation of flood contours or flood depth could be added in the review-website. In case of negative evaluations, the external reviewers were invited to supply
extra geometry information into the system. Users had the option to add extra culverts or a change of dimensions of existing culverts, to propose an edit to the altitude of the Digital Terrain Model, or to add extra pumping stations and storage areas. Models were then re-run based upon the amount of changes requested in each of the 102 sub-models. As such, in total 198 re-runs were calculated during the 3 months review-period, with a maximum of 4 re-runs in the most active sub-models. Over 3500 entries on quality evaluation were provided and each of these were processed by VMM. At the end of the review period it appeared 53% were related to a positive or neutral evaluation of the maps. Within the negative evaluations, 44% were related to the fact reviewers indicated they had no knowledge on flooding as it appears on the VLAGG-maps. Underestimations where reported in 26% of the negative evaluations, outperforming overestimations that were reported in 17% of all negative evaluations. An evaluation of the regional distribution of these quality scores gave no evidence for a systematic error in certain hydrologic areas reflecting differences in dominant soil-type, land-use or slope. With respect to the hydraulic structures, over 5500 culverts were added by the web-reviewers together with 670 modifications of the terrain height, 275 pumping stations and 810 flood storage areas. All of these edits were first quality-checked by the local consultancy company and then passed to the modelling company.
The collaborative development of the pluvial flood map received a positive evaluation. In nearly 300 of the 307 municipalities in Flanders the review-process resulted in at least one entry being supplied. The wide use of the review-website clearly showed that an intuitive application had been developed and this was confirmed by many requests for a continued use of the review-website in coming years and even for related applications. Also after handover of the VLAGG-project, the review-website is used by (internal) professional users for consulting the detailed information on pluvial flooding in Flanders.
Figure 3: Screenshot of the review-website developed in the VLAGG.be project (combined flood maps nearby Opglabbeek with review notes)
5
Conclusions
The VLAGG-project proved that a novel web-based modelling approach is able to generate high-class results outperforming high-classical flood results in multiple ways. Firstly, via the re-use of an existing high-performance modelling infrastructure it was possible to simulate in 2D the entire Flemish region (13000km²) at least 3 times, in less than one year while classical 1D simulations take efforts over many years to build models and keep them up to date. Secondly, this infrastructure allowed for running the simulations on a resolution of 2m (being at least 6 times higher than classical maps) finally delivering results on a parcel scale, and thus in line with the use of these maps for advisory purposes to the permit issuing authorities and the legal information duty to the general public. Thirdly, by presenting interim simulated flood contours via a dedicated project-website,
www.vlagg.be, it was possible to engage over 150 Flemish municipalities and dozens of river-, sewer- and road managers. Due to their evaluation of the draft maps and especially due to the additional information on 7250 hydraulic structures, it was possible to enrich the models with further detailed local terrain knowledge. The resulting draft pluvial maps show an astonishing agreement with both pictures taken during multiple flood events and detailed upstream fluvial flood maps [6].
Both the number of delineated flood areas as well as the number of impacted buildings have increased substantial (+56% ha) compared to the previously published flood hazard maps showing only fluvial and coastal flood risks in Flanders. By simulating worst-case climate change scenarios for 2100, it could be demonstrated that a further significant increase of flooded areas (+83%) and impacted buildings (+70%) could occur in Flanders, finally threatening over 1 million buildings or 41% of all buildings by the end of this century.
The success of this web-based modelling process can further be illustrated by the many requests VMM received, to make use of the VLAGG-maps in daily water policy in Flanders and to be able to update the VLAGG-maps in a continuous way. As a result the current draft pluvial flood map was in 2018 already included in a new climate-portal showing several types of climate effects and climate impacts across Flanders. Also requests were received to perform spatial planning scenarios and more climate projections with the VLAGG model-framework. These extra works will happen later in 2018 and it is planned that a final pluvial flood map in Flanders will be approved in 2019 by the Minister of Environment, Nature and Agriculture. It is foreseen that this final pluvial flood map will be used in the reporting to the European Commission of the sources of flooding, together with the previously generated fluvial and coastal flood maps. Following this reporting, all information available in the pluvial flood maps will become available for public re-use.
References
[1] G. Vaes, P. Willems, 2003. Areal rainfall correction coefficients. 6th international workshop on precipitation in urban areas, Pontresina, Switzerland, December 2003.
[2] R. Lamb, A. Crossley, S. Waller, 2009. A Fast Two-Dimensional Floodplain Inundation Model. Proceedings of the ICE - Water Management 162(6), 363-370.
[3] A. Crossley, R. Lamb, S. Waller, P. Dunning, 2010a. Fast 2D Flood Modelling using GPU Technology. European Geosciences Union, General Assembly, Vienna, Austria, May 2010.
[4] A. Crossley, R. Lamb, S. Waller, 2010b. Fast solution of the shallow water equations using GPU technology, BHS International Symposium, Newcastle, UK, July 2010.
[5] H. Tabari,, M.T. Taye and P. Willems, 2014. Bijsturing van de Vlaamse klimaatscenario’s voor hydrologische en hydrodynamische impactanalyse inclusief hydrologische extremen, studie uitgevoerd in opdracht van de Afdeling Operationeel Waterbeheer.
[6] VMM, Aanmaak afstromingsgevoelige kaart Vlaanderen, Aalst, Belgium, March 2018.