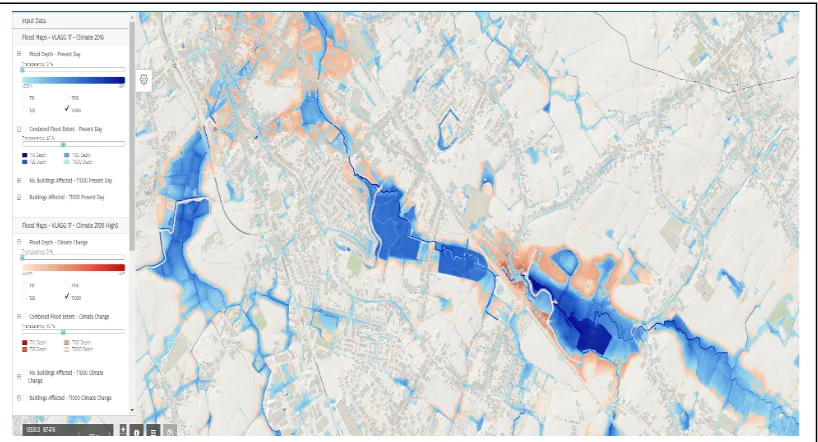
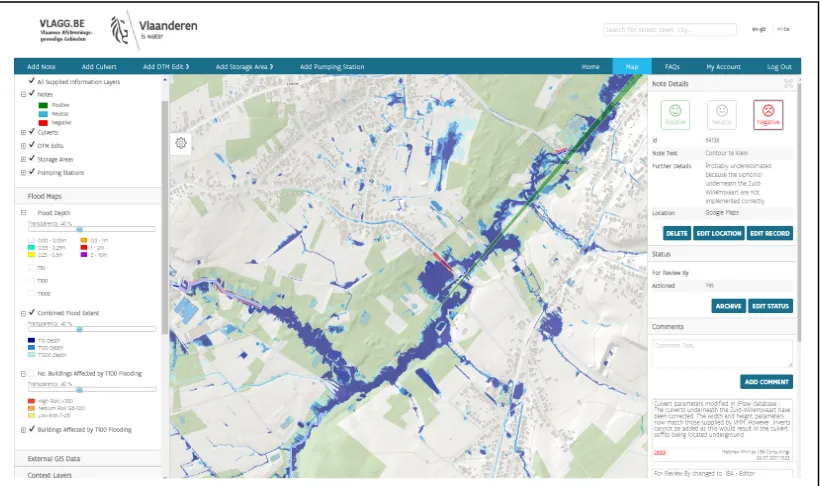
Collaborative Development of High Resolution Pluvial Flood Maps for Flanders
Full text
Figure

Related documents
Nevertheless, in the 1980s, due to the growing number of Canadians capable of work who were receiving welfare benefits, the federal government and the provincial governments
Students are expected to perform in 4 regularly scheduled chorus concerts (informance, winter, spring, and pops—see calendar on choral website).. Again, all students in this
This built on our previously introduced calculation of the absolute magnitude of ΔψM in intact cells, using time-lapse imaging of the non-quench mode fluorescence
Regardless of whether The Reynolds Company suggested the product or developed the product at the purchaser's request, it is the purchaser's responsibility to test and determine
Akut stres bozukluğu için tanı ölçütlerinden biri olan peritravmatik dissosiyasyon ayrıca TSSB için de yordayıcı bir faktör olarak gösterilmiştir.[54] Dissosiyatif
Areas that are subject to flooding (i.e., the 100-year floodplain) have been delineated on Flood Insurance Rate Maps (FIRMs) and the City of Tampa Flood Zone Map.. These maps
A Novel VLSI Architecture for Image Compression Model Using Low power Discrete Cosine Transform.. Vijaya Prakash.A.M
Clients Database Server Switch Management Station Mirrored Port Figure 5 Physical View of Client-Server CRM Application with Monitoring Agent Figure 6 Chart of CRM
