Characterization of Lithium Ion Transport Via Dialysis Process
Full text
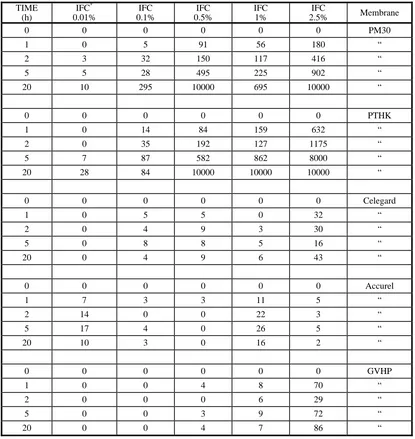
Figure


Related documents
Taken as a whole, they provide good evidence that adult basic skills programmes can increase educational attainment, as measured by receipt of a GED; provide some evidence
For any business, it is crucial that the management know their customers. This paper was written to help the Pattaya tourism industry better understand the nature of their
Patient records were manually reviewed; data collected include patient demographics, mechanism of injury, burn total body surface area (% TBSA), length of hos- pital stay, TBSA
Lateral separation between aircraft using different navigation aids, or when one aircraft is using RNAV equipment, shall be established by ensuring that the derived
Any control scheme in which only the motion of the manipulator end point may be controlled and the computer can control the actuators at the various degrees of freedom to achieve
Time dependence of the relative velocity change in the coda - possibility to discriminate a shallow and a deep perturbation.. Bulk Regime: Diffusion vs Radiative transfer
8. These “Average Times” now represent how quickly your system can react to manual control of boom functions. In Section 4.7 Completing the Installation , this procedure is
