Volume 60, 2019, Pages 161–169
Proceedings of 11th International Conference on Bioinformatics and Computational Biology
Equipping Decoy Generation Algorithms for
Template-free Protein Structure Prediction with
Maps of the Protein Conformation Space
Ahmed Bin Zaman
1and Amarda Shehu
123∗1 Dept. of Computer Science, George Mason University, Fairfax, VA 22030 2
Dept. of Bioengineering, George Mason University, Fairfax, VA 22030
3
School of Systems Biology, George Mason University, Fairfax, VA 22030
Abstract
A central challenge in template-free protein structure prediction is controlling the qual-ity of computed tertiary structures also known as decoys. Given the size, dimensionalqual-ity, and inherent characteristics of the protein structure space, this is non-trivial. The current mechanism employed by decoy generation algorithms relies on generating as many decoys as can be afforded. This is impractical and uninformed by any metrics of interest on a decoy dataset. In this paper, we propose to equip a decoy generation algorithm with an evolving map of the protein structure space. The map utilizes low-dimensional representations of protein structure and serves as a memory whose granularity can be controlled. Evaluations on diverse target sequences show that drastic reductions in storage do not sacrifice decoy quality, indicating the promise of the proposed mechanism for decoy generation algorithms in template-free protein structure prediction.
1
Introduction
The tertiary structure in which the chain of amino acids in a protein folds in three dimensions is key to a protein’s biological activities. The tertiary structure determines to a great extent the molecular partners to which a protein “sticks” and the strength of such interactions. For this reason, elucidating the biologically-active/native structure(s) of a protein molecule is an important first step in understanding its array of activities in the cell and thus its function.
Determination of native protein structure in the wet laboratory has not been able to keep pace with the high-throughput gene sequencing technologies. The latter have contributed mil-lions of uncharacterized protein-encoding gene sequences in genomic databases [3]. In contrast, the number of known structures deposited in the Protein Data Bank (PDB) [2] is an order of magnitude less. The disparity motivates the development of computational approaches to tertiary protein structure prediction (PSP) [8].
The most challenging setting of PSP is the one that operates in the absence of a template, when the target protein sequence has no close or remote homologs with known structure(s) [6].
In such a case, algorithms are needed to explore possible structures of the target sequence (also known as decoys) in a biased manner, guided by the objective to lower the interaction energy that rises from atomic interactions in a structure. Great advances have been made, most notably by Rosetta [7], Quark [18], and others [6], mainly due to domain-specific insight. Recognizing the power of domain-specific insight on structure representation, molecular fragment libraries, and protein energy functions, a growing body of research has adopted such insight and advanced the exploration capabilities of decoy generation under the umbrella of evolutionary computation [12,
13,16,19,20].
Nonetheless, the size, dimensionality, and inherent characteristics of the protein structure space greatly impact the quality of structures, also known as decoys, computed by decoy gen-eration algorithms. The key question on controlling the quality of generated decoys relates to what mechanisms to employ to ensure a broad, sample-based representation of the vast and high-dimensional protein structure spaces and not miss near-native conformations. The current response to this question is to generate as many decoys as can be afforded. This is impractical, particularly, for algorithms that are able to do so in a time-efficient manner. Moreover, it is not informed by diversity or other metrics of interest on a decoy dataset.
Here we present a mechanism to do so. Inspired by related concepts in evolutionary compu-tation, we propose to equip a decoy generation algorithm with an evolving map of the protein structure space. The map utilizes low-dimensional representations of protein structure and serves as a memory with controllable granularity. Evaluation on diverse target shows drastic reductions in storage without sacrificing decoy quality, indicating the promise of the proposed mechanism for decoy generation in template-free PSP.
2
Method
We integrate the proposed mechanism of an evolving map of the protein structure space in an evolutionary algorithm (EA) for decoy generation previously published and evaluated against Rosetta and other decoy generation algorithms [12–14]. While the proposed mechanism can be integrated in any decoy generation algorithm, we do so in the hybrid evolutionary algo-rithm (HEA) proposed in [13] for several reasons. First, the algorithm builds over the Rosetta platform, making use of Rosetta’s domain-specific choices and implementations of molecular fragment replacement, fragment libraries, structure representation, and energy/scoring func-tions. Second, the algorithm has been shown more powerful than Rosetta’s Metropolis Monte Carlo (MMC) decoy generation algorithm in terms of exploration capability [13,14]. Third, while other evolutionary algorithms are available in literature (including multi-objective EAs), the HEA contains basic evolutionary search ingredients that allow it to generate hundreds of thousands of decoys that can be utilized to build a map of the protein structure space. In what follows we first summarize the HEA and then devote the rest of this Section on the proposed map and its integration.
2.1
Summary
Initial Population To construct the initial population, the utilized HEA creates pidentical extended chains (pis the size of the population), making use of Rosetta’s centroid representation, where only heavy backbone atoms and a pseudo-atom representing the centroid of side-chain atoms are modeled per amino acid. A two-stage MMC search is then utilized to randomize these extended chains and encourage the formation of physically-realistic secondary structures (such as helices and sheets). Each stage employs a different Rosetta scoring function for this purpose, gradually adding more energetic constraints. Each move in the MMC search replaces the configuration (dihedral angles) of a fragment (consecutive amino acids) in a structure with a new configuration selected from an a-priori compiled library of fragment configurations. This technique is known as the molecular fragment replacement and is one of the core operations in the Rosetta decoy generation algorithm, as well. The two-stage MMC uses a fragment length of 9 amino acids. The interested reader is pointed to Ref. [13] for more details on the initial population generation and the molecular fragment replacement technique.
Variation and Improvement Operators The employed HEA makes use of a mutation (asexual) operator to vary a parent and obtain an offspring. In the variation operator, a fragment length of 3 amino acids is used to introduce small structural changes over a parent. As a hybrid EA, the HEA further improves offspring via an improvement operator. This mechanism is shown to improve the offspring chances of survival against parents [4,12]. The improvement operator performs a local search that, starting from the offspring, seeks a nearby local (energy) minimum. The local search is greedy, accepting only moves that lower energy. Each move is a molecular fragment replacement (again utilizing fragment length 3) and is evaluated with the Rosettascore3 energy function. Further details can be found in Ref. [13].
Selection Operator The selection operator in the utilized HEA implements an elitism-based truncation selection as follows. All individuals (parents and offspring) are evaluated via Rosetta’s score4 energy function which additionally considers short-range and long-range hydrogen bonding overscore3. The topk% individuals in the parent population are combined with the offspring population; k is the elitism rate. The combined individuals are sorted by theirscore4 (from lowest to highest), and the toppindividuals in the sorted order survive and are selected to constitute the population for the next generation.
Termination Criterion As in prior work that proposes novel decoy generation algorithms, rather than setting an arbitrary number of generations, the termination criterion is formulated in terms of a total budget of energy evaluations; this recognizes the fact that the evaluation of the internal energy of a structure is the most computationally-demanding operation in a decoy generation algorithm. In addition, such a budget allows fair comparisons with other decoy generation algorithms that are not based on evolutionary computation.
2.2
Evolving Map of Protein Structure Space
structurally-diverse individuals that represent different regions of the HEA-probed structure space. The utilization of layers is inspired by robot motion planning algorithms [17] and their adaptations in robotics-inspired algorithms for protein structure and motion modeling [11,15], but their utilization, implementation, and integration in decoy generation algorithms is novel.
Energetic Layer We first define a single dimensional grid over Rosettascore4 energy inter-vals in the range [Emin,0]. We set the upper bound to 0, because structures with positive energy
are highly infeasible; any effective decoy generation algorithm starts producing negative-energy structures very early. Therefore, it is unnecessary to keep structures with positive energies in the map. We set the lower bound Emin to −200; in previous experiments [13,14], we have
observed that thescore4 energy of a generated decoy is comfortably over−200 Rosetta Energy Units (REUs) for diverse target proteins (of different lengths and folds). To ensure high en-ergetic granularity, we set each interval to a small value of 2 REUs, thus totalling 100 energy intervals over the range.
Geometric Layer For each energy interval, we define a 3-dimensional grid over 3 shape-similarity features. A structure is summarized with 3 such features, building over the Ultra-fast Shape Recognition metrics originally proposed in [1]. These features capture the three-dimensional shape of a molecule. They are first momenta of atomic distance distributions from selected points in a tertiary structure. The latter are chosen to be the centroid (ctd), thus giving the first feature (first axis/dimension in the 3d grid), the point farthest from the cen-troid (fct), thus giving the second feature (second axis/dimension in the 3d grid), and the point farthest from fct, thus giving the third feature (third axis/dimension in the 3d grid). These features essentially summarize a structure with 3 coordinates and constitute a low-dimensional representation of a tertiary structure. As these three features are continuous, we discretize them by considering integer levels only. So, each cube on the grid is characterized by 3 integer coordinates, and we consider each individual in a population that falls in the same cube as structurally/geometrically similar.
2.2.1 Layer-based Inclusion of Decoys
The map is built as follows. For each decoy generated, a decision is made to include it in the map or not based on the energetic and geometric layers. When the decoy generation algorithm is an EA (as we utilize in this paper), this decision is made for each parent in the initial population and each improved offspring over the generations. Each decoy is projected into the energy interval (of the 1d energy grid described above) to which it belongs based on itsscore4. Once mapped to an energy interval, the decoy is then mapped to the specific cube in the 3d geometric grid it belongs based on its 3 USR-based features described above. If the cube is empty, this means that the generated decoy represents a new region of the structure space and is included in the map. Otherwise, the decoy has another (energetically and) structurally-similar decoy that has been previously generated by the algorithm. In this case, the specific decoy considered for inclusion in the map does not constitute a new region of the structure space, but it may constitute a better decoy in the region represented by the cube in the 3d grid. So, its score4 energy is compared with that of the other decoy in the same cube.
energy). This mechanism ensures that the map evolves and stores both structurally-diverse and low-energy decoys.
2.3
Implementation Details
In the utilized HEA, the population size is p= 100, and the elitism rate is set to k = 25%, as in work in [13]. Instead of fixing the number of generations, we execute the algorithm for a fixed budget of 10,000,000 energy evaluations. The implementation is in Python, and the HEA interfaces with the PyRosetta library. The budget of 10M energy evaluations translates to 2−9 hours on a 2.6GHz Intel Xeon E5-2670 CPU with 100GB of RAM. The difference in running times depends on the length (number of amino acids) of a given protein sequence. For each of the target/test sequences employed in our evaluations, the program is run 3 times to account for stochasticity.
3
Results
Experimental Setting We employ a benchmark dataset of 12 proteins of varying lengths (ranging from 53 to 123 amino acids) and folds (α, β, and α+β) that are used widely for evaluation [5,13,19,20]. We run the HEA with and without the map 3 times on each target sequence. The individuals in every population in the HEA without the map are collected and referred to as the Original Pool. The decoys in the map (when HEA is equipped with the map mechanism) are referred to as theReduced Pool. As mentioned in Section2.3, we execute our program (HEA without or with the map) 3 times on each target sequence, and the results reported are over all 3 runs combined. Recall that each run spends a computational budget of 10M energy evaluations.
We compare the Original to the Map-reduced Pool in terms of size and quality. For the latter, we focus on distance to the known native structure of a target sequence, since the map will never discard a lower-energy decoy. As is common practice in template-free PSP, we make use of least root-mean-squared-deviation (lRMSD) to measure decoy distance to a known native structure [9]. lRMSD reports an average of the Euclidean distances of corresponding atoms in two given structures once distances due to rigid-body motions (whole-body translation and rotation in three dimensions) are removed. Typically, the comparison focuses on the main carbon atom (CA) of each amino acid. lRMSD increases with sequence/chain length, and a value within 5−6˚A is considered to have captured the native structure.
3.1
Decoy Quality versus Reduction
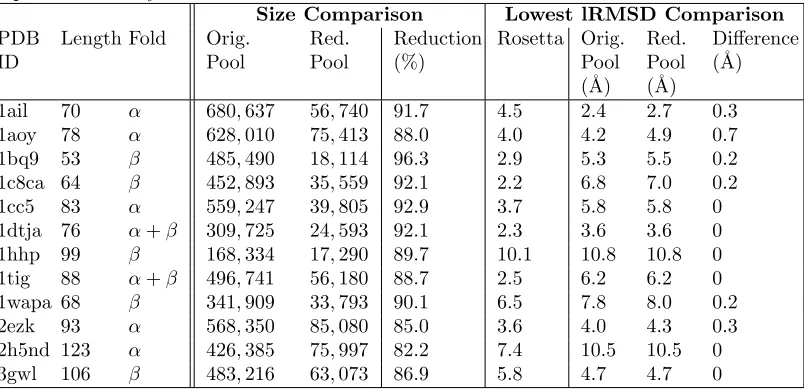
Table 1 shows the lengths and folds of the target sequences, alongside the PDB identifiers (ids) of the known native structure for each target sequence. The number of decoys in the original pool versus in the map (the reduced pool) are juxtaposed in Columns 4-5, and the reduction (as a percentage) in shown in Column 6. The reduction is dramatic. On 6/12 of the test cases, the reduced pool (the map) achieves more than 90% reduction in size. In the other 6 cases, the reduction is more than 80% (with a minimum decrease of 82.2%). The most drastic reduction occurs in the case of the target sequence with PDB ID 1bq9; the reduction in this case is 96.3%, which is nearly a 27-fold reduction over the original pool.
between the two (reporting increases in lRMSD in the reduced pool over the original pool). For reference, the lowest lRMSD obtained by the Rosetta decoy generation algorithm, as reported in [13] (using a longer budget of 54M energy evaluations), is shown for each test case in Column 7. On 6/12 of the test cases, the difference is 0˚A; that is, on 50% of the test cases, the reduction in size comes at no cost to decoy quality. None of the cases have a difference more than 1˚A; the maximum difference is 0.7˚A (for PDB ID 1aoy). This demonstrates that the map retains good quality decoys from the original pool while providing drastic reductions in size.
Table 1: Comparison of Size Reduction versus Quality Retainment in the Original versus the Map-reduced Decoy Datasets
Size Comparison Lowest lRMSD Comparison PDB
ID
Length Fold Orig. Pool
Red. Pool
Reduction (%)
Rosetta Orig. Pool (˚A)
Red. Pool (˚A)
Difference (˚A)
1ail 70 α 680,637 56,740 91.7 4.5 2.4 2.7 0.3 1aoy 78 α 628,010 75,413 88.0 4.0 4.2 4.9 0.7 1bq9 53 β 485,490 18,114 96.3 2.9 5.3 5.5 0.2 1c8ca 64 β 452,893 35,559 92.1 2.2 6.8 7.0 0.2
1cc5 83 α 559,247 39,805 92.9 3.7 5.8 5.8 0
1dtja 76 α+β 309,725 24,593 92.1 2.3 3.6 3.6 0 1hhp 99 β 168,334 17,290 89.7 10.1 10.8 10.8 0 1tig 88 α+β 496,741 56,180 88.7 2.5 6.2 6.2 0 1wapa 68 β 341,909 33,793 90.1 6.5 7.8 8.0 0.2 2ezk 93 α 568,350 85,080 85.0 3.6 4.0 4.3 0.3 2h5nd 123 α 426,385 75,997 82.2 7.4 10.5 10.5 0 3gwl 106 β 483,216 63,073 86.9 5.8 4.7 4.7 0
3.2
Probed Structure Spaces
The structure space probed by the HEA can be compared with the structure space remembered in the map by plotting thescore4 energy of a decoy versus its lowest lRMSD from the native structure. Fig.1does so for each test case, plotting individuals of all populations in the HEA in red, and decoys included/remembered in the map in blue. Examining the plots, it is evident that the map retains decoys from all the regions in the structure space probed by the HEA. The reduced pool (the map) also captures all the local minima well, further making the case that the proposed map mechanism controls the quality of the retained decoys via its energetic and geometric layers.
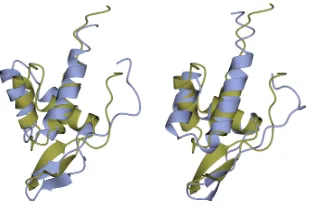
Finally, Fig.2 juxtaposes the best (lowest-lRMSD to native structure) decoy over all indi-viduals in the HEA with the best decoy in the map for the target protein with known native structure under PDB id 1aoy. This target is selected due to the largest difference (0.7˚A) in Table 1. Fig.2shows that the decoys are very similar even in such a case.
4
Conclusion
low-1ail 1aoy 1bq9
1c8ca 1cc5 1dtja
1hhp 1tig 1wapa
2ezk 2h5nd 3gwl
Figure 1: The probed structure space is shown by plotting each decoy via two coordinates, its lRMSD from the known native structure (x-axis) and its Rosetta score4 energy (y-axis). The decoys generated by the algorithm are in red, whereas the decoys retained in the map are in blue.
dimensional representations of protein structure that facilitate computationally-efficient struc-ture comparison and allow storing non-redundant decoys in it. Evaluation on diverse target show that drastic reductions in storage do not sacrifice decoy quality, thus allowing longer-time exploration of the protein structure space.
Figure 2: The lowest-lRMSD decoy over all HEA-generated individuals is shown in blue on the left. The lowest-lRMSD decoy in the map is shown blue on the right. The known native struc-ture (PDB id 1aoy) is drawn in orange. Rendering is performed with the CCP4mg molecular graphics software [10].
Acknowledgements
This work is supported in part by NSF Grant No. 1763233. Computations were run on ARGO, a research computing cluster provided by the Office of Research Computing at George Mason University.
References
[1] P. J. Ballester and W. G. Richards. Ultrafast shape recognition to search compound databases for similar molecular shapes. J Comput Chem, 28(10):1711–1723, 2007.
[2] H. M. Berman, K. Henrick, and H. Nakamura. Announcing the worldwide Protein Data Bank.
Nat. Struct. Biol., 10(12):980–980, 2003.
[3] C. E. Blaby-Haas and V. de Cr´ecy-Lagard. Mining high-throughput experimental data to link gene and function. Trends Biotechnol, 29(4):174–182, 2013.
[4] K. A. De Jong. Evolutionary Computation: a Unified Approach. MIT Press, Cambridge, MA, 2006.
[5] J. DeBartolo, G. Hocky, M. Wilde, J. Xu, K. F. Freed, and T. R. Sosnick. Protein structure prediction enhanced with evolutionary diversity: SPEED. Protein Sci., 19(3):520–534, 2010. [6] A. Kryshtafovych, A. Barbato, K. Fidelis, B. Monastyrskyy, T. Schwede, and A. Tramontano.
Assessment of the assessment: evaluation of the model quality estimates in CASP10. Proteins, 82(Suppl 2):112–126, 2014.
[7] A. Leaver-Fay, M. Tyka, S. M. Lewis, O. F. Lange, J. Thompson, R. Jacak, et al. ROSETTA3: an object-oriented software suite for the simulation and design of macromolecules.Methods Enzymol, 487:545–574, 2011.
[8] T. Maximova, R. Moffatt, B. Ma, R. Nussinov, and A. Shehu. Principles and overview of sampling methods for modeling macromolecular structure and dynamics.PLoS Comp. Biol., 12(4):e1004619, 2016.
[9] A. D. McLachlan. A mathematical procedure for superimposing atomic coordinates of proteins.
Acta Cryst A, 26(6):656–657, 1972.
[10] S. McNicholas, E. Potterton, K. S. Wilson, and M. E. M. Noble. Presenting your structures: the CCP4mg molecular-graphics software. Acta Cryst, D76:386–394, 2011.
[11] K. Molloy and A. Shehu. Elucidating the ensemble of functionally-relevant transitions in protein systems with a robotics-inspired method. BMC Struct. Biol., 13(Suppl 1):S8, 2013.
York, NY, 2013. ACM.
[13] B. Olson and A. Shehu. Multi-objective stochastic search for sampling local minima in the protein energy surface. InACM Conf on Bioinf and Comp Biol (BCB), pages 430–439, Washington, D. C., September 2013.
[14] B. Olson and A. Shehu. Multi-objective optimization techniques for conformational sampling in template-free protein structure prediction. InIntl Conf on Bioinf and Comp Biol (BICoB), pages 143–148, Las Vegas, NV, 2014.
[15] A. Shehu. An ab-initio tree-based exploration to enhance sampling of low-energy protein confor-mations. In J. Trinkle, Y. Matsuoka, and Castellanos J. A., editors,Robotics: Science and Systems V, pages 241–248, Seattle, WA, USA, June 2009.
[16] A. Shehu. A review of evolutionary algorithms for computing functional conformations of protein molecules. In W. Zhang, editor,Computer-Aided Drug Discovery, Methods in Pharmacology and Toxicology. Springer Verlag, 2015.
[17] A. Shehu and E. Plaku. A survey of omputational treatments of biomolecules by robotics-inspired methods modeling equilibrium structure and dynamics. J Artif Intel Res, 597:509–572, 2016. [18] D. Xu and Y. Zhang. Ab initio protein structure assembly using continuous structure fragments
and optimized knowledge-based force field. Proteins: Struct. Funct. Bioinf., 80(7):1715–1735, 2012.
[19] G. Zhang, L. Ma, X. Wang, and X. Zhou. Secondary structure and contact guided differential evolution for protein structure prediction. IEEE/ACM Trans Comput Biol and Bioinf, 2018. preprint.