Modeling hind‑limb kinematics using
a bio‑inspired algorithm with a local search
S. Ivvan Valdez
1, Josué González‑Sandoval
2, Sergio Dueñas‑Jiménez
3, Nancy Elizabeth Franco Rodríguez
4,
Sulema Torres‑Ramos
2and Gerardo Mendizabal‑Ruiz
2*From 5th International Work‑Conference on Bioinformatics and Biomedical Engineering Granada,
Spain. 26‑28 April 2017
Background
Laboratory rats play a critical role in research because they provide a biological model that can be used for evaluating the affectation of diseases and injuries, and for the evalu-ation of the effectiveness of new drugs and treatments [1–3]. In particular, the analysis of locomotion in laboratory rats allows us to understand the motor defects in diseases such as osteoarthrosis [4], Parkinson’s disease, Huntington’s disease, and amyotrophic lateral
Abstract
Background: Laboratory rats play a critical role in research because they provide a biological model that can be used for evaluating the affectation of diseases and injuries, and for the evaluation of the effectiveness of new drugs and treatments. The analysis of locomotion in laboratory rats facilitates the understanding of motor defects in many diseases, as well as the damage and recovery after peripheral and central nervous system injuries. However, locomotion analysis of rats remains a great challenge due to the necessity of labor intensive manual annotations of video data required to obtain quantitative measurements of the kinematics of the rodent extremities. In this work, we present a method that is based on the use of a bio‑inspired algorithm that fits a kinematic model of the hind limbs of rats to binary images corresponding to the seg‑ mented marker of images corresponding to the rat’s gait. The bio‑inspired algorithm combines a genetic algorithm for a group of the optimization variables with a local search for a second group of the optimization variables.
Results: Our results indicate the feasibility of employing the proposed approach for the automatic annotation and analysis of the locomotion patterns of the posterior extremities of laboratory rats.
Conclusions: The adjustment of the hind limb kinematic model to markers of the video frames corresponding to rat’s gait sequences could then be used to analyze the motion patterns during the steps, which, in turn, can be useful for performing quantita‑ tive evaluations of the effect of lesions and treatments on rats models.
Keywords: Genetic algorithm, Local search, Hind limb, Laboratory rats, Kinematics analysis
Open Access
© The Author(s) 2018. This article is distributed under the terms of the Creative Commons Attribution 4.0 International License (http://creat iveco mmons .org/licen ses/by/4.0/), which permits unrestricted use, distribution, and reproduction in any medium, provided you give appropriate credit to the original author(s) and the source, provide a link to the Creative Commons license, and indicate if changes were made. The Creative Commons Public Domain Dedication waiver (http://creat iveco mmons .org/publi cdoma in/zero/1.0/) applies to the data made available in this article, unless otherwise stated.
RESEARCH
sclerosis [5, 6], as well as the damage and recovery after peripheral and central nervous system injury [7].
Current methodologies for the analyses of laboratory rats’ locomotion can be catego-rized as “forced” when the speed of march is imposed on the rat by means of a treadmill (e.g., [8]), or “unforced” when the rat is free to move at any speed on the ground or an activity wheel [7]. In general, forced analysis have the advantage of allowing to perform direct comparisons between the recollected gait variables, since all of the subjects will be moving at similar speeds. However, for some research cases, these strategies may be unsuitable, since the movement of the rats could be different from their normal locomo-tion patterns [9]. For these cases, unforced methods may be a better option with the main disadvantage that the comparison of the gait variables would require a more elabo-rated metric, exclusion of samples, or a normalization of the data.
There currently are qualitative methods for the assessment of locomotion variables, such as the Tarlov scale [10] and the inclined plane test [11], and the Basso, Beattie and Bresnahan (BBB) rating [12]. BBB is the most widely accepted method for assessing loco-motion on unforced-open field tests. The BBB rating consists of a semi-quantitative scale which takes values ranging from zero to twenty one, based on the opinion of an observer regarding the hindlimb movements, joint movements, forelimb and hindlimb coordina-tion, stepping, trunk position and stability, paw placement and tail position. The scale score is divided into three stages: (i) Early stage (score of 0–7): composed of isolated joint movements with little or no hindlimb movement; (ii) Intermediate stage (score of 8–13): intervals of uncoordinated stepping, and (iii) Late stage (score of 14–21): forelimb and hindlimb coordination.
Since the BBB score is determined by a person based on his own experience and exper-tise, the major limitation of the this and other qualitative methodologies is the reduced reproducibility and non-satisfactory sensitivity for some cases of locomotion studies [13].
To overcome this challenge, an automated gait analysis method based on the analysis of paw-floor contact was developed by Hammers et al. [14], which allows the quantifica-tion of a number of locomoquantifica-tion variables regarding the step cycle, pressure applied, and stance phases.
Another approach consists of performing an analysis of the patterns generated by the configuration of the rat’s extremity joints during their movement, either using a forced or an unforced methodology (e.g., [15–18]. These approaches rely on the use of video sequence recording at high speed (i.e., in general above 90 frames per second) that are analyzed through the inspection of the angles between the joints of the extremity of interest obtained by manual annotations of the extremity along the recorded frames. The curves corresponding to changes of the joint angles with respect to time can then be used to compare the gait patterns of different experimental rat groups [7].
However, the great challenge of this approach is the significant amount of effort required for the manual annotation of the frames of the videos. The person who does the annotations may also perform poorly due to lack of experience or fatigue.
hind limb of rats to a binary image corresponding to the segmented marker of an image of the rat while walking. The bio-inspired algorithm combines a genetic algorithm for a group of the optimization variables with a local search for a second group of the optimi-zation variables. Our results indicate the feasibility of employing the proposed approach for the automatic annotation and analysis of the locomotion patterns of the posterior extremities of laboratory rats.
Methods
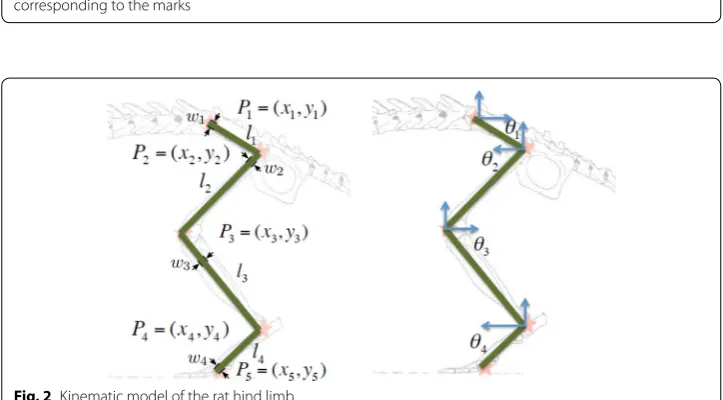
The proposed method is based on the adjustment of a rat hind limb kinematic model to a frame in a rat’s gait video sequence, where the hind limb of the rat has been marked with line-marks corresponding to the the rat’s leg bones ( Fig. 1a). The model consists of points representing the joints named as P1,. . .,P5 , the lengths of each element of the leg
l1,. . .,l4 , and the angle of each element by θ1,. . .,θ4 . Although leg widths are
meaning-less for the kinematic model, there are useful for the sake of fitting the virtual model to the video frames. Thus, they are marked with wi in Fig. 2.
Fig. 1 a Example of marks placed on the skin of the hind limb of a laboratory rat, and b the binary image corresponding to the marks
Given the upper-most point P1=(x1,y1) , the rest of the points can be obtained by:
for n=2...5.
Thus, the hind limb model for a given position can be represented as a fourteen-dimensional vector:
where li , with i∈ {1..4} , are the lengths of the leg elements, and θi and wi are angles and widths of the elements, respectively (Fig. 2).
Therefore, the problem consist of finding a vector of parameters X∗ which produces a
binary image E(x, y) which fits the most (i.e., is the most similar) to a binary image S(x, y) representing the hind limb marks on a given frame (Fig. 1b). A fitting score f(X) can be obtained by:
Where TP is the number of true positives, which are the number of white pixels in E(x, y) that are white in S(x, y). TN is the number of true negatives, negatives, which are the number of black pixels in E(x, y) that are black in S(x, y). P and N are the total number of
positives and negatives in S(x, y). This measure is known, in the context of binary classi-fiers, as accuracy. The maximum value of the objective function is 1.
In this work, we propose to compute the solution X∗ using a two-step method that
consists of a genetic algorithm for finding the values of the initial point (x1,y1) and
lengths and a local search algorithm for the other variables.
Genetic algorithm
We implemented the Elitist Non-Dominated Sorting Genetic Algorithm II (NSGA-II) [19], since it has demonstrated outstanding performance and is currently one of the most widely used evolutionary algorithms. The initial population Zz=0 is generated using aleatory values for the uppermost point P1 and lengths li of the kinematic model.
P1 is selected from the uppermost white pixels. Therefore, we use a single optimization
variable (the index of the pixel), A local search is then performed to find the best angles
(θi) and widths (wi) for the given uppermost point and section lengths. Each individual of the population Xz
c is evaluated on the objective function and the result is established
as the fitness score F. Notice that the evaluation procedure is, actually, the local search procedure. The genetic algorithm provides the initial point and length, while the local search find angles and widths. In contrast with most hybrid algorithms, our global and local procedures affect different optimization variables. After evaluating the population, (1)
xn=xn−1+ln−1(cos(θn−1))
(2)
yn=yn−1+ln−1(sin(θn−1))
(3) X= [x1,y1,l1,l2,l3,l4,θ1,θ2,θ3,θ4,w1,w2,w3,w4]
(4)
the best individual X∗z is selected to be incorporated into the next generation popula-tion Zz+1 (elitism). The rest of the individuals are selected for reproduction using binary
tournament [20], which consists of several comparisons of objective function value
(“tournaments”) among a set of individuals chosen at random from the population. The winner of each tournament (the one with the best fitness) is selected for reproduction.
The reproduction of two selected individuals Xc1z and Xc2z is performed using the
simu-lated binary cross-over(SBX) method [19], which consists of the generation of a random number u in the range of [0, 1] that is is used for determining the contribution β¯ of the
characteristics from each parent to each children as:
where nc=1 . A pair of children Xc1z+1 and Xcz2+1 are then generated according to the
fol-lowing equations:
Finally, to prevent the population from getting stuck in local minimums and maintain diversity in the exploration of the solution space, we employed the polynomial
muta-tion method [21] on which the value of an element of an individual may change with
a probability m. The new value is determined by a polynomial probability distribution:
P(δ)=0.5(ηm+1)(1− |δ|)ηm ; xU
i and xLi are the lower and upper bound of xi
respec-tively. The mutated children together with the elite individual (best-known solution) become the new population. The loop of evaluation, elitism, selection, reproduction and mutation are repeated until a stopping criterion is met. In this work, the stopping crite-rion depends on the consecutive number of generations Nmaxelite in which the elite indi-vidual is not improved.
Algorithm 1 list the steps of the first part of the proposed approach based on the genetic algorithm.
(5)
¯
β=
(2·u) 1
nc+1 ifu<0.5
�
1 2(1−u)
� 1
nc+1
otherwise
(6)
Xcz+11 =1
2
(Xcz1+Xcz2)−β(Xcz2−Xcz1)
Xcz+2 1=1
2
Local search
The local search method intends to find the optimal values of θi and wi for each hind limb segment by searching in a given range of angular values θiinf and θisup , using the
objective function in Eq. 4. The method consists of two stages of refinement, where in each of these, the search is performed with a higher precision in a reduced range.
The first step starts with an initial width of w0=10 . The method performs a search every four degrees of the angle in which the overlap of the line drawn in the image DIi
and the image S(x, y) is maximized, according to Eq. 4. The best angle found is stored in the variable θI.
A second search is performed around this last value, every one degree. For each angle in the second search, we intend to improve the width of the segment looking for a new width. The best angle found is stored in the variable θI , and the best width in the variable
wIIn−1 . Finally, the values of the width and the angle are stored and the limits updated.
Leg pendulum‑like movement computation
A possible way to quantitatively evaluate the gait properties of rats is by comparing the curves that are generated by the movement of the extremities during the steps. One of the curves that can be employed to perform a comparison of hind limbs locomotion is the leg pendulum-like movement (PLM) of the hind limb which cor-responds to the angle between the the 5th lumbar vertebra and fifth metatarsophalan-geal joint (first and last points) [7]. In this work, we computed this angle for each frame, interpolated missing angles in case of non convergence of the algorithm, and then applied a robust weighted moving average filter with an outliers parameter of 6σ.
Results
The genetic algorithm with local search is applied on each frame using a population size of 400, mutation probability of 0.11, crossover probability of 0.9, number of elite individuals preserver through a generation is 3, and value of Nmaxelite=8 as stopping criterion. Figure 3 depicts an example of the best adjusted model on 21 frames corre-sponding to a step of a rat. Note that the kinematic model adjusted by the proposed method is very similar to the segmented marked region.
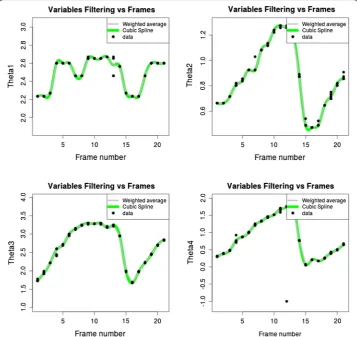
Table 1 depicts the statistics of the variation of the results of five independent execu-tions of the proposed method on 100 randomly selected frames using Bootstrapping and a re-sampling parameter of N=1000 . Figure 4 depicts an example of the computed angles for the four angles in five independent executions (dots), along with a weighted mean (gray line), and a cubic spline interpolation (green line). Note that the computed angles have a small dispersion, which indicates that the algorithm is robust with respect to the variability of the rat’s hind limbs.
The feasibility of the proposed method to be used to perform the quantitative analysis is evaluated by comparing the PLM of the hind limb of each rat’s step obtained with the proposed method (A), with the corresponding curve obtained from the annotations of two observers (O1 and O2) on the image sequences (Fig. 5). Note that, in general the three curves are very similar in the pattern they describe, with exception of some local-ized differences.
The similarity of the PLM curves for each rat step obtained with the proposed method and with the observer’s annotations was assessed by the computation of the Frechet dis-tance [22], which is a measure of similarity between curves that takes into account the location and ordering of the points along the curves. The mean difference between A and O1 was 0.453 ± 0.147, the difference between A and O2 was 0.544 ± 0.25, while
the difference between the O1 vs O2 was 0.298 ± 0.093. We performed a two-sample
T-test with a significance level of 0.05 to determine if the differences in the performance between the automatic method and the human observers was comparable. The results for the comparison of A vs O1 and O1 vs O2, the null-hypothesis was rejected with a value of p=0.068 , which indicate that there are not statistically significant differences
between the performance of the proposed method and Observer one. However, for the case of the comparison comparison of A vs O2 and O1 vs O2, there was not enough statistical evidence to reject the null-hypothesis ( p=0.00524 ) which suggests that the
Fig. 4 From up to down, left to right angles. Dots are θ1,θ2,θ3 and θ4 estimated values from five executions per frame. The gray line is a weighted mean, each value is weighted by the normalized objective function (the normalized objective function values from the five executions sums to one) . The green line is a cubic‑spline interpolation of the weighted mean
Table 1 Statistics of the variation of the results of the adjusted kinematic model employing the proposed method five times on 100 randomly selected frames using Bootstrapping and a re-sampling parameter of N=1000
Variable Mean difference (std) 95%
Confidence interval
l1 (pixels) 2.39 (4.87) 1.95–3.02
l2 (pixels) 1.86 (3.56) 1.56–2.35
l3 (pixels) 3.32 (6.27) 2.65–4.12
l4 (pixels) 12.59 (10.48) 11.41–13.79
θ1 (rad) 0.02 (0.06) 0.018–0.034
θ2 (rad) 0.01 (0.03) 0.013–0.022
θ3 (rad) 0.01 (0.02) 0.013–0.019
differences of the proposed method with respect to the annotations of O2 are greater than the differences of O1 and O2.
Discussion
The obtained results indicate the feasibility of employing the proposed method for the adjustment of the hind limb kinematic model to markers of the video frames corre-sponding to rat’s gait sequences. The obtained joint configuration could then be used to analyze the motion patterns during the steps, which, in turn, can be useful for perform-ing quantitative evaluations of the effect of lesions and treatments on rats models.
In our experiments, we noted that the lengths and widths of the hind limb segments vary with respect to the step cycle instant. For instance, for all executions on frames in Fig. 3, the length’s means and standard deviations are µl = {67.2, 108.09, 94.35, 101.56}
and σl= {5.69, 5.493, 16.00, 16.82} for { l1,l2,l3,l4 } respectively, and the width’s means and
standard deviations are µw= {15.71, 15.56, 15.35, 14.57} and σw= {1.67, 1.62, 1.67, 2.48} for { w1,w2,w3,w4 }, respectively. All measurements are in pixels. This variation could be
explained by the three dimensional movement of the leg which occurs in the direction of the cameras. We believe that it could be possible to estimate the characteristics of this motion by comparing the obtained lengths and widths with the real proportions of these features. Another option could be to employ more than one camera at different known positions, then perform the model fitting, and finally estimate the 3D motion by triangu-lation of the known corresponding points.
Future work includes the addition of a kinematic model for the forelimbs, and the comparison of the results obtained with the proposed method with manual annotations performed by an observer over the same video sequences.
Conclusion
We have presented a method that is based on the use of a bio-inspired algorithm that fits a kinematic model of the hind limb of rats to binary images corresponding to the seg-mented marker of images corresponding to rats’ gait. The obtained results indicate the feasibility of employing the proposed approach for the automatic annotation and analy-sis of the locomotion patterns of the posterior extremities of laboratory rats.
Declarations
Authors’ contributions SV, JS, and ST performed the coding of the proposed method. SV and GM designed the pro‑ posed algorithm and were major contributors in writing the manuscript. SD and NEFR participated in the delimitation of the problem, the conception of the solution, and the training and management of the laboratory rats and acquisition of the data. All authors read and approved the final manuscript.
Author details
1 División de Ingenierías, Universidad de Guanajuato, Carr. Salamanca‑Valle de Santiago km 3.5+1.8, 36885 Salamanca, Guanajuato, México. 2 Departamento de Ciencias Computacionales, Universidad de Guadalajara, Av.Revolución 1500, Guadalajara, Jalisco, México. 3 Departamento de Neurociencias, Universidad de Guadalajara, Sierra Mojada 950, Guadala‑ jara, Jalisco, México. 4 Departamento de Farmacobiología, Universidad de Guadalajara, Blvd. Marcelino García Barragan, 1421 Guadalajara, Jalisco, México.
Acknowledgements
The authors thanks CONACYT and PROMEP for the provided support. Any opinions, findings, conclusions or recommen‑ dations expressed in this material are of the authors and may not reflect the views of the sponsors.
Competing interests
The authors declare that they have no competing interests.
Availability of data and materials
Not applicable
Consent for publication
Not applicable
Ethics approval and consent to participate
All procedures were performed in accordance with the ethical considerations guidelines of the Mexican Official Norm (NOM‑062‑ZOO‑1999) and the National Institute of Health Guide NIH Publication No. 8023 (revised in 1996) for the Care and Use of Laboratory Animals.
Funding
Publication costs were funded by Universidad De Guadalajara.
About this supplement
• fast, convenient online submission •
thorough peer review by experienced researchers in your field • rapid publication on acceptance
• support for research data, including large and complex data types •
gold Open Access which fosters wider collaboration and increased citations maximum visibility for your research: over 100M website views per year •
At BMC, research is always in progress.
Learn more biomedcentral.com/submissions
Ready to submit your research? Choose BMC and benefit from:
Publisher’s Note
Springer Nature remains neutral with regard to jurisdictional claims in published maps and institutional affiliations.
Published: 20 November 2018
References
1. Sandi C, Venero C, Guaza C. Novelty‑related rapid locomotor effects of corticosterone in rats. Eur J Neurosci. 1996;8(4):794–800.
2. Delfs J, Schreiber L, Kelley A. Microinjection of cocaine into the nucleus accumbens elicits locomotor activation in the rat. J Neurosci. 1990;10(1):303–10.
3. Stephan FK, Zucker I. Circadian rhythms in drinking behavior and locomotor activity of rats are eliminated by hypo‑ thalamic lesions. Proc Natl Acad Sci. 1972;69(6):1583–6.
4. Clarke K, Heitmeyer S, Smith A, Taiwo Y. Gait analysis in a rat model of osteoarthrosis. Physiol Behav. 1997;62(5):951–4.
5. Amende I, Kale A, McCue S, Glazier S, Morgan JP, Hampton TG. Gait dynamics in mouse models of parkinson’s disease and huntington’s disease. J Neuroeng Rehabil. 2005;2(1):20.
6. Hampton TG, Amende I. Treadmill gait analysis characterizes gait alterations in parkinson’s disease and amyotrophic lateral sclerosis mouse models. J Motor Behav. 2009;42(1):1–4.
7. Osuna‑Carrasco L, López‑Ruiz J, Mendizabal‑Ruiz E, De la Torre‑Valdovinos B, Bañuelos‑Pineda J, Jiménez‑Estrada I, Dueñas‑Jiménez S. Quantitative analysis of hindlimbs locomotion kinematics in spinalized rats treated with tamox‑ ifen plus treadmill exercise. Neuroscience. 2016;333:151–61.
8. Beare JE, Morehouse JR, DeVries WH, Enzmann GU, Burke DA, Magnuson DS, Whittemore SR. Gait analysis in normal and spinal contused mice using the treadscan system. J Neurotrauma. 2009;26(11):2045–56.
9. Batka RJ, Brown TJ, Mcmillan KP, Meadows RM, Jones KJ, Haulcomb MM. The need for speed in rodent locomotion analyses. Anat Rec. 2014;297(10):1839–64.
10. Tarlov I. Spinal cord compression studies: III. Time limits for recovery after gradual compression in dogs. AMA Arch Neurol Psychiatry. 1954;71(5):588–97.
11. Rivlin AS, Tator CH. Objective clinical assessment of motor function after experimental spinal cord injury in the rat. J Neurosurg. 1977;47(4):577–81.
12. Basso DM, Beattie MS, Bresnahan JC. A sensitive and reliable locomotor rating scale for open field testing in rats. J Neurotrauma. 1995;12(1):1–21.
13. Barros Filho TEPd, Molina AEIS. Analysis of the sensitivity and reproducibility of the Basso, Beattie, Bresnahan (bbb) scale in wistar rats. Clinics. 2008;63(1):103–8.
14. Hamers FP, Lankhorst AJ, van Laar TJ, Veldhuis WB, Gispen WH. Automated quantitative gait analysis during overground locomotion in the rat: its application to spinal cord contusion and transection injuries. J Neurotrauma. 2001;18(2):187–201.
15. Kunkel‑Bagden E, Dai H‑N, Bregman BS. Methods to assess the development and recovery of locomotor function after spinal cord injury in rats. Exp Neurol. 1993;119(2):153–64.
16. Santos P, Williams S, Thomas S. Neuromuscular evaluation using rat gait analysis. J Neurosci Methods. 1995;61(1):79–84.
17. Cheng H, Almström S, Giménez‑Llort L, Chang R, Ögren SO, Hoffer B, Olson L. Gait analysis of adult paraplegic rats after spinal cord repair. Exp Neurol. 1997;148(2):544–57.
18. Möller KÄ, Kinert S, Størkson R, Berge O‑G. Gait analysis in rats with single joint inflammation: influence of experi‑ mental factors. PloS one. 2012;7(10):46129.
19. DEH K, Agrawal S, Pratap A, Meyarivan T A fast elitist non‑dominated sorting genetic algorithm for multi‑objective optimization: NSGA‑II. In: Lecture notes in computer science. Berlin: Springer; 2000. p 849–858.
20. Miller BL, Goldberg DE. Genetic algorithms, tournament selection, and the effects of noise. Complex Syst. 1995;9(3):193–212.
21. Deb K, Goyal M. A combined genetic adaptive search (geneas) for engineering design. Comput Sci Inf. 1996;26:30–45.