R E S E A R C H
Open Access
The
Populus
holobiont: dissecting the
effects of plant niches and genotype on
the microbiome
M. A. Cregger
1†, A. M. Veach
1†, Z. K. Yang
1, M. J. Crouch
1,4, R. Vilgalys
2, G. A. Tuskan
1and C. W. Schadt
1,3*Abstract
Background:Microorganisms serve important functions within numerous eukaryotic host organisms. An understanding of the variation in the plant niche-level microbiome, from rhizosphere soils to plant canopies, is imperative to gain a better understanding of how both the structural and functional processes of microbiomes impact the health of the overall plant holobiome. UsingPopulustrees as a model ecosystem, we characterized the archaeal/bacterial and fungal microbiome across 30 different tissue-level niches within replicatedPopulus deltoidesand hybridPopulus trichocarpa × deltoidesindividuals using 16S and ITS2 rRNA gene analyses.
Results:Our analyses indicate that archaeal/bacterial and fungal microbiomes varied primarily across broader plant habitat classes (leaves, stems, roots, soils) regardless of plant genotype, except for fungal communities within leaf niches, which were greatly impacted by the host genotype. Differences between tree genotypes are evident in the elevated presence of two potential fungal pathogens,Marssonina brunneaandSeptoriasp., on hybridP. trichocarpa × deltoides trees which may in turn be contributing to divergence in overall microbiome composition. Archaeal/bacterial diversity increased from leaves, to stem, to root, and to soil habitats, whereas fungal diversity was the greatest in stems and soils. Conclusions:This study provides a holistic understanding of microbiome structure within a bioenergy relevant plant host, one of the most complete niche-level analyses of any plant. As such, it constitutes a detailed atlas or map for further hypothesis testing on the significance of individual microbial taxa within specific niches and habitats ofPopulus and a baseline for comparisons to other plant species.
Keywords:Populus deltoides,Populus trichocarpa × deltoideshybrid, 16S rRNA, ITS2, Fungal pathogen
Background
Microorganisms are ubiquitous across all environments, yet we are just beginning to understand the role they play within ecosystems and in association with host organisms. Individual plant-associated microorganisms are known to aid in key functions across the entire plant, e.g., water and nutrient acquisition [1], stress response [2], suppression of pathogens [3], and reducing herbivory directly and through priming of host plant defenses [4]. As a result, the collective holobiomes or phytobiomes of plants are gaining increased
attention [5,6]. Although advances are being made in un-derstanding microbiome composition within individual host habitats [7–13], little work has been conducted to hol-istically understand the variation in microbiome compos-ition across the numerous potential microbial niches represented by multiple plant organ and tissue types [5].
Populushas become the model woody perennial organ-ism for researchers interested in testing mechanistic hy-potheses related to plant–microbe interactions.Populusis amenable to experimentation because of its fast growth rates and the ability to be propagated vegetatively.Populus has its full genome sequenced [14, 15]; therefore, the interaction between host genomic information and micro-bial associations is readily discernible. Further, under-standing these interactions may be particularly important socioeconomically as poplar trees currently are cultivated * Correspondence:schadtcw@ornl.gov
†Equal contributors 1
Biosciences Division, Oak Ridge National Laboratory, 1 Bethel Valley Rd, Oak Ridge, TN 37831, USA
3Microbiology Department, University of Tennessee, M409 Walters Life
Sciences, Knoxville, TN 37996, USA
Full list of author information is available at the end of the article
for pulp and paper production [16,17] and have potential as a cellulose-derived biofuel feedstock [14,18–20].
Distinct microbiome composition of the Populus rhizo-sphere and root endorhizo-sphere across environmental gradi-ents [21, 22] and between Populus genotypes or species [23] has been demonstrated. Microbial community isolates fromPopulushave also been shown to enhance the health, growth, and development of their plant hosts [24–26]. Dif-ferentiation between root endosphere and rhizosphere mi-crobial communities is likely due to selection of unique microbial consortia with the ability to penetrate and sur-vive the host environment [21], although the strength of se-lection may differ between microbial groups. However, the degree of microbiome specificity across all plant-associated niches (i.e., soil to canopy) has not been effectively tested withinPopulusgenotypes or between genotypes.
There are known pathogenic organisms that differentially attackPopulusspecies and genotypes (e.g.,P. trichocarpa × deltoides), and pathogen population abundance has been shown to vary among Populusspecies [27] and across ge-notypes within species [28]. Fungal pathogen abundance in Populusleaves has also been shown to be correlated with the co-occurrence of alternate fungal endophyte species that likely act as antagonists and competitors for both space and host resources [28, 29]. Understanding the basis of multi-pathogen resistance and the degree of pathogen in-teractions with the overall phytobiome may aid in the suc-cess of effectively growing Populus for pulp fiber and biofuel feedstock operations and understanding Populus contributions to ecosystem services.
UsingPopulus as a model system, this study seeks to understand how the collective communities of archaea/ bacteria and fungi, or the microbiome, varied across habitats within a tree host from soil to tree canopy and between individual Populus deltoides and Populus trichocarpa × deltoideshybrids (ramets) under identical environmental conditions. We characterized microbial communities across 30 different plant-associated niches covering an extensive number of the aboveground and belowground tissue-level microbial habitats, as well as both shallow and deeper soil habitats (Additional file1: Table S1), using amplicon 16S and ITS2 rRNA gene-targeted Illumina MiSeq sequencing. We hypothesized that due to differing microbial inoculum sources (i.e., air–leaf/stem interface vs. the root–soil interface) and environmental filtering mechanisms (e.g., tissue chem-istry or exudates in roots [30]), microbiome niche-level composition for archaea/bacteria and fungi would vary across the landscape represented by the ecosystem of whole trees. Further, due to differences in susceptibility of different Populus species to fungal pathogen infec-tion, we hypothesized that microbial communities would differ betweenPopulus deltoidesand thePopulus trichocarpa × deltoideshybrid.
Methods
Study location and sampling methods
Trees used in this study were harvested from an experimen-tal cultivar trial in Blount County Tennessee at a site man-aged by the University of Tennessee Institute of Agriculture (UTIA)—East Tennessee Research and Education Center (ETREC) located at 35° 50′39″N/83° 57′36″W. Soils in the area of harvest were verified to be Inceptisols of the Emory Series with transitions from A horizon silt loams to B horizon silt clay loams taking place at approximately 25 cm. Five matched replicates of clonal individuals of P. deltoidesand fiveP. trichocarpa × deltoideshybrid (10 trees total) were selected on the border of adjacent experimental blocks. Trees were harvested on August 14–15, 2014, nearing the end of their third season of growth. Each tree was felled using a chainsaw onto a plastic tarp. The stump, roots, and surrounding soil (approxi-mately 100-cm diameter, 75-cm depth) were removed by a hydraulic tree spade and placed onto a separate tarp for dissection and processing. Thirty different plant-associated habitat types were defined and proc-essed as outlined below across the 10 trees (N= 300; Additional file 1: Table S1 and Figure S1). Sample processing took place in both the field and laboratory. Field processed samples (e.g., soils, leaf swabs) were transported on blue ice and frozen at −80 °C on the same day. Laboratory processed samples were stored in a 4 °C cold room until processing was completed as below.
Host niche definitions and sample preparation
Given our root sterilization procedure used sodium hypo-chlorite which has been shown to remove ~ 98% of mi-crobes on the exterior of roots [31], we were unable to characterize the rhizoplane-associated microbial community. Three stem sections from each annual growth incre-ment, as identified by successive terminal bud scars, were collected and separated in the field, transported on ice, and then stored in a cold room at 4 °C until processed (within 10 days). In the laboratory, each stem and struc-tural root section sample was wiped down with sterile 0.1% Tween 20 solution. Samples from each growth year (1, 2, and 3) were then dissected into three habitat cat-egories: outer stem layer (i.e., bark, cambium, and phloem tissue), living developing xylem, and mature xylem tissue and preserved at−80 °C until DNA extraction.
Leaf samples were collected from terminal (developing leaves, LPI 2–4) and sub-terminal (mature leaves, LPI 7– 10) along multiple branches. The top surfaces (developing and mature upper phyllosphere) and bottom surfaces (de-veloping and mature lower phyllosphere) of each leaf sam-ple were then separately swabbed in the field with wooden applicators moistened with sterile 0.1% Tween 20, and swabs frozen at −80 °C upon arrival to the laboratory, while leaves were stored at 4 °C until processing (within 6 days). Leaf and petioles were then separated and washed (developing whole leaf wash and mature whole leaf wash) and surface-sterilized (developing and mature leaf endo-sphere, developing and mature petiole endosphere) as de-scribed above for roots (Additional file 1: Table S1) and frozen at −80 °C until DNA extraction. Due to storage time differences (i.e., frozen the day of sampling versus stored at 4 °C for several days prior to dissection or pro-cessing), we compared mean differences between signifi-cantly different leaf habitat comparisons (e.g., developing whole leaf phyllosphere [DWL, leaf phyllosphere washes up to 6-days storage] versus upper phyllosphere develop-ing [UPD, leaf swabs frozen at day 0]) for alpha diversity ANOVAs and beta diversity (NMDS scores) ANOVAs. Leaf habitats differed, and had similar mean differences, between those that were sampled in the same timeframe and those sampled at different timeframes (e.g., bacterial diversity DWL vs UPD and DWL vs LEM mean differ-ence = 0.23, p= 0.02). Therefore, storage time differences likely did not significantly alter our results.
DNA extractions and Illumina MiSeq sequencing
All plant tissues (i.e., roots, stems, and leaves) were cut into fine pieces (< 5 mm) prior to DNA extraction. Rhizosphere samples, whole-leaf washes, and upper and lower phyllosphere samples were centrifuged at 10,000 rcf for 10 min, and the supernatant was removed. These sam-ples and bulk soil samsam-ples had 250 mg of material ex-tracted using the MoBio PowerSoil DNA Isolation Kit (MoBio Laboratories, Inc., Carlsbad, CA, USA). All other
tissue types had 50 mg of tissue per extraction and were bead-beaten for 3 min in frozen (liquid nitrogen) blocks using one 5-mm steal bead per extraction (Qiagen, Venlo, the Netherlands). Following these steps, pulverized tissue was extracted using the MoBio PowerPlant Pro DNA Isolation Kit (MoBio Laboratories, Inc., Carlsbad, CA, USA). Stem tissue samples had two replicate extractions per sample to achieve sufficient DNA yields. All extrac-tions were quantified on a NanoDrop 1000 spectrophotom-eter (NanoDrop Products, Wilmington, DE, USA). Aboveground tissues (i.e., leaves and stems) were also puri-fied and concentrated using Zymo DNA Clean and Concentrator-5 Kit (Zymo Research Corporation, Irvine, CA, USA) and quantified again prior to PCRs.
We used a two-step PCR approach to barcode tag tem-plates with frameshifting nucleotide primers [32] with the following modifications. Forward and reverse primer mix-tures were modified to maximize phylogenetic coverage of archaea, bacteria, and fungi (Additional file 1: Table S2), thus allowing full and simultaneous assessment of bacteria, fungi, and archaea due to the increased coverage of our pri-mer sets. Pripri-mers for tagging bacterial amplicons were a mixture of 9 forward and 6 reverse 515F and 806R primers for the 16S rRNA V4 gene region at equal concentrations (0.5 μM; Additional file1: Table S2). Primers for tagging fungal ITS2 rRNA region included a mixture of 11 forward and 7 reverse primers at equal concentration (0.5 μM; Additional file1: Table S2). To inhibit plant material ampli-fication, we added a mixture of peptide nucleotide acid (PNA) blockers oligos (PNA Bio Inc., Thousand Oaks, CA, USA) targeted at plant mitochondrial and chloroplast 16S rRNA genes and plant 5.8S nuclear rRNA gene upstream of ITS2 region primers in fungal PCRs (see Lundberg et al. [32]; Additional file1: Table S2 and Figure S2). The mito-chondrial PNA of Lundberg et al. [32] was adjusted for a 1 bp mismatch inPopulus, whereas the nuclear 5.8S PNA was custom-designed for this study. Thermal cycler condi-tions for the primary PCRs for soils were 5 cycles of 95 °C for 1 min, 50 °C for 2 min, and 72 °C for 1 min. Primary PCR conditions for plant tissues were 5 cycles of 95 °C for 1 min, 78 °C for 5 s, 50 °C for 2 min, and 72 °C for 1 min. Primary PCR products were cleaned with 17μL of Agen-court AMPure beads and eluted in 21μL of nuclease-free water. Secondary PCRs had purified DNA tagged with
bar-coded reverse primers and forward primers
After PCRs, experimental units were pooled based on agarose gel band intensity and purified with Agencourt AMPure XP beads (beads to DNA, 0.7 to 1 ratio; Beck-man Coulter Inc., Pasadena, CA, USA). Illumina MiSeq sequencing was carried out using a 9 pM amplicon con-centration including a 15% PhiX spike with 500 (v. 2; 2 × 250) cycles.
Illumina MiSeq sequence processing
Paired-end sequences (.fastq) were joined and demulti-plexed using QIIME default settings except a Phred qual-ity threshold of Q20 [33]. Forward and reverse primers were then removed using the cutadapt program [34]. For ITS2 sequences, reads were truncated to 200 bp and any sequences less than 200 bp were filtered. Both 16S and ITS2 sequences were quality-filtered (fastq_maxee = 0.5), derepelicated, and had singletons removed in USEARCH [35]. Operational taxonomic units (OTUs) were then clus-tered at 97% similarity after chimeras were removed in USEARCH [35]. Lastly, using QIIME [33], OTUs were classified using BLAST with the Greengenes (V13.8) and UNITE reference databases (V7.1; [36] for archaeal/bac-terial and fungal communities, respectively). Contaminant sequences that were unclassified at domain (bacteria/ar-chaea) or kingdom (fungi), mitochondria, chloroplasts, plant, and protista, were filtered. Complete datasets across habitat comparisons were rarefied at 1000 sequences for bacteria and 2000 for fungi to minimize sample loss (see rarefaction curves—Additional file1: Figures S3–S4). The final full com-munity dataset had 7458 OTUs and 269,000 sequences for bacteria and 9277 OTUs and 546,000 sequences for fungi. After the full dataset was analyzed, leaf, stem, root, and soil compartments were separated to examine differences within these compartments and each rarefied separately to maximize sequence number and minimize sample loss. Leaf, stem, and root samples were rarefied at 500 sequences for bacteria and 1000 sequences for fungi. Soil samples were rar-efied at 35,000 for bacteria and 5000 sequences for fungi. OTU diversity was calculated in QIIME as the complement of Simpson’s Diversity (1−D= 1−Σpi2) withpirepresenting
the frequency of each OTU within a sample.
Statistical analysis
We determined if the relative abundance of dominant fun-gal pathogens differed across leaf tissue habitats and geno-types (OTUs identified asMycosphaerella/Septoria sp. and Marssonina brunnea), and whether dominant (≥0.1%) ar-chaeal/bacterial and fungal phyla differed across broad habitat categories (i.e., leaf, stem, root, and soil), and be-tween genotypes using two-way ANOVA models. We also used two-way ANOVAs to test if both archaeal/bacterial and fungal OTU diversity differed across habitats and be-tween genotypes. Microbial diversity data was arc-sine transformed prior to ANOVAs. Since some phyla’s relative
abundance was skewed, we used log10-transformed data to
meet assumptions of normality prior to statistical analysis. Since multiple tests were run, each type 1 error rate for each ANOVA model was FDR-corrected for multiple com-parisons. ANOVA models were performed inR(aov func-tion, R Project for Statistical Computing, Vienna, Austria).
Microbial community composition was assessed by computing Bray–Curtis dissimilarity matrices and then visualized using non-metric dimensional scaling (NMDS) ordinations to visualize compositional differ-ences. To test whether habitat, genotype, or their interaction had a significant effect on community composition, a permutational multivariate ANOVA (perMANOVA; [37]) with 10,000 permutations was calculated. NMDS and perMANOVA models were performed in Primer-E (Quest Research Limited, New Zealand). We also calculated perMANOVA pairwise comparisons within habitats and genotypes for leaf, stem, root, and soil communities separately for bac-teria and fungi (pairwise.perm.manova in package RVAideMemoire; [38]). Lastly, we performed an indi-cator species analysis [39] using OTU abundance data to determine which OTUs occurred more frequently between habitats (i.e., leaf, stem, root, soil), genotype for all habitats (DD vs. TD), and genotype within a habitat (e.g., leaf DD vs. leaf TD) for bacterial and fun-gal communities (multipatt function in indicspecies package; [39]). After indicator OTUs were detected, an FDR correction was applied for post hoc multiple comparisons of statistical significance.
Results
Microbial community composition shifts across habitat and tree genotype
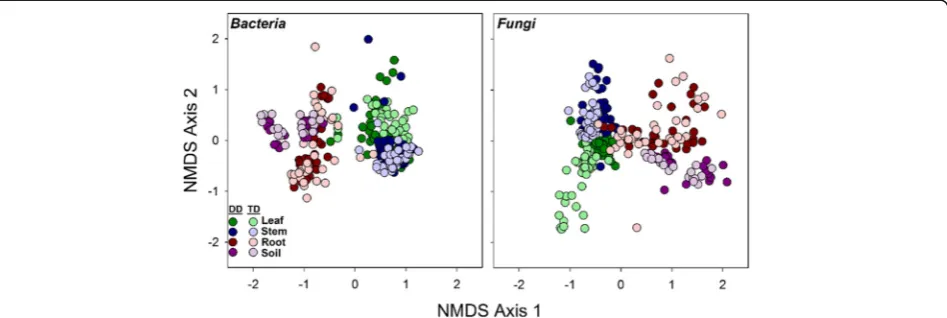
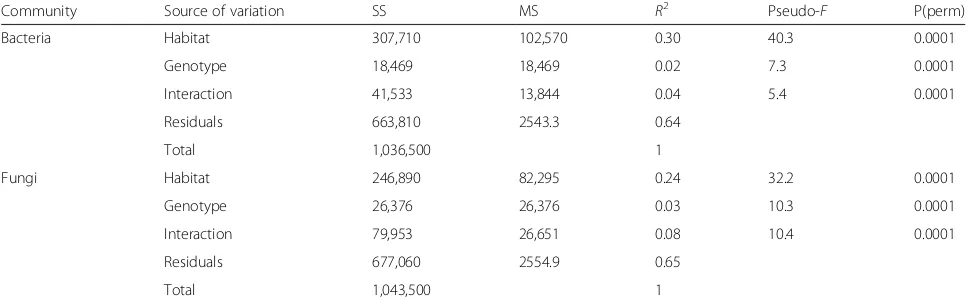
Across the four broad habitats sampled (i.e., leaf, stem, root, soil), we found significant differences in both ar-chaeal/bacterial (R2= 0.30) and fungal (R2= 0.24) commu-nity composition (Fig. 1, Table 1). A small amount of variation in community composition was also explained by genotype (bacterialR2= 0.02, fungalR2= 0.03) and the habitat × genotype interaction (bacterialR2= 0.04, fungal R2= 0.08, Table1). Archaeal/bacterial alpha diversity was greatest in soil habitats and lowest in leaf habitats (Fig.2). Stem and root had similar bacterial alpha diversity esti-mates (p= 0.25). Fungal alpha diversity was greater in stems than in leaf or root habitats (p≤0.01), whereas fun-gal alpha diversity was also greater in soils than roots (Tukey’s HSD, p= 0.05; Fig. 2). Archaeal/bacterial alpha diversity did not differ betweenPopulusgenotypes, but we found significant differences in alpha fungal diversity be-tweenPopulusgenotypes. Fungal diversity was greater in P. deltoidesthan in the hybrid (Fig.2).
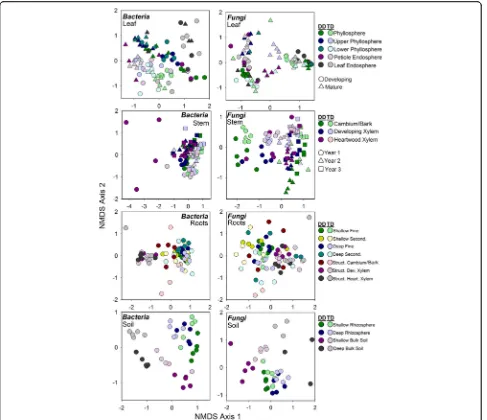
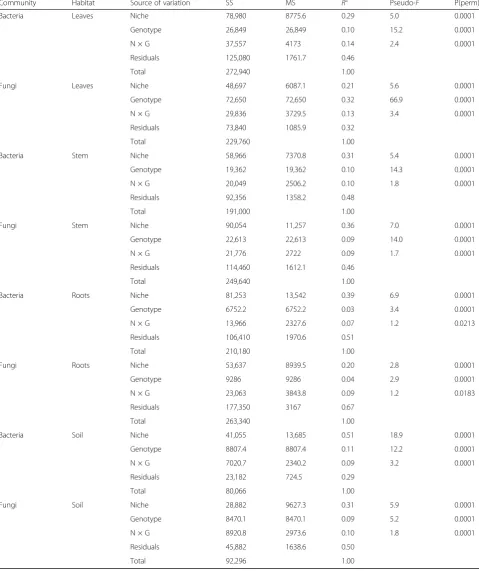
Within each broad habitat, the main effect of finer-scale habitat (within leaf, stem, roots, soils separately referred to as niche in remainder of text; Fig.3) explained more vari-ation than genotype or their interaction (Table 2), except for leaf fungal communities. Genotype explained more variation in leaf fungal community composition than niche (R2= 0.21). Furthermore, across leaf, root, and soil communities, niche was more influential for ar-chaeal/bacterial composition than fungal, whereas in stem communities, niche explained more variation in fungal communities compared to archaeal/bacterial communities (Table 2). The main effect of genotype generally explained similar amounts of variation for ar-chaea/bacteria and fungi across specific niches, except for leaf communities (Table 2). Archaeal/bacterial
diversity also differed among niches within each broad tis-sue/habitat type (e.g., whole-leaf washes had lower diversity than upper phyllosphere in developing tissues), but did not differ between genotypes within each niche across the broad tissue/habitat types (Additional file1: Tables S5–S8). Fungal diversity differed between niches within broad habi-tat types, except roots. Further, niches within leaves, stems, and root communities differed in fungal diversity between genotype (p≤0.04; Additional file1: Tables S9–S11), where P. deltoideshad greater fungal diversity, on average, com-pared to the hybrid (Fig.2).
Phylum level differences across habitat and tree genotype
Twenty-one dominant (≥0.1% relative abundance) ar-chaeal/bacterial phyla, and classes for Proteobacteria, were detected across this study (Additional file 1: Table S12). Twenty of these 21 dominant archaeal/bacterial phyla dif-fered across broad habitats (i.e., leaves, stem, roots, and soil; F3,267= 12.55,p≤0.01, Fig.3). Fusobacteria is the only
dom-inant phyla that did not differ across these habitats (Additional file 1: Table S12). Crenarchaeota, Firmicutes, Nitrospirae, AD3, and WS3 had greater abundance in soils than in roots, stems, and leaves (Tukey’s HSD: p≤0.01). The most common archaeal phyla identified, the Crenarch-aeota, differed significantly across all tested habitats. The Crenarchaeota had 0.3% relative abundance in the leaves, 0.1% relative abundance in the stems, 0.2% abundance in the roots, and 3.0% relative abundance in the soil. Acido-bacteria, Chloroflexi, Planctomycetes, Verrucomicrobia, and Deltaproteobacteria had the greatest abundance in soil ver-sus other habitats, but also had greater abundance in roots than in stems and leaves (Tukey’s HSD:p≤0.01). Gemmati-monadetes had the greatest abundance in soil, and root habitats had greater abundance compared to stem tissues (Tukey’s HSD: p≤0.01). Bacteroidetes had the greatest
abundance in roots and stems compared to leaves and soil habitats, whereas TM7 had the greatest abundance in root habitats compared to all other habitats (Tukey’s HSD: p≤0.01). Actinobacteria and Armatimonadetes had greater abundance in soils, roots, and stems than in leaves, whereas TM6 had greater abundance in soils, roots, and leaves than in stem habitats (Tukey’s HSD: p≤0.01). Phylum FBP had greatest abundance in stem tissues (Tukey’s HSD: p≤0.01). Alphaproteobacteria also had the greatest abundance in stem tissues. Leaves were enriched in Alphaproteobacteria compared to roots and soil and in root tissues compared to soil habi-tats (Tukey’s HSD: p≤0.03; Additional file 1: Table S12). Betaproteobacteria were most abundant in soils and roots than in leaves or stems. Leaves were enriched in Betaproteobacteria compared to stems (Tukey’s HSD: p≤0.03). Gammaproteobacteria were most abun-dant in roots and leaves than in soils and stem habitats (Tukey’s HSD: p≤0.01). Actinobacteria were more abun-dant in P. deltoides-associated tissue/habitats, whereas TM7 were more abundant in the hybrid (p≤0.03).
All six fungal phyla were found in this study (Fig. 4, Additional file 1: Table S12). Basidiomycota, Chytridio-mycota, and Glomeromycota were most abundant in stem habitats (Tukey’s HSD:p≤0.01). Ascomycota were most abundant in leaves and lowest in soils contrary to Rozellomycota and the former Zygomycota, which were most abundant in soils (Tukey’s HSD:p≤0.01). No fun-gal phyla differed in abundance between tree genotypes.
Functional fungal guild and OTU differences across tree genotype
Several functional guilds’relative abundance differed be-tween genotypes. Within soils, one functional guild dif-fered between genotypes. Soil saprotrophs had greater relative abundance in the hybrid genotype compared to
P. deltoides (F1,39= 4.45, p= 0.04), but soil saprotrophs
had, on average, low abundance (0.08%). In roots, un-defined pathogens were greater in the hybrid geno-type (F1,63= 5.96, p= 0.02), but at very low abundance
(undefined pathogens: 0% in P. deltoides, 0.03% in hy-brids). In stems, low-abundance guilds, such as ani-mal pathogens (F1,85= 5.51, p= 0.02) and fungal
parasites (F1,85= 16.66, p< 0.001), were greater in
hy-brids compared to P. deltoides (0.1%, 0.4 vs. 0.03%, 0.03%, respectively), but abundant plant pathogens were approximately 2× greater in P. deltoides com-pared to the hybrid genotype (F1,85= 16.20, p< 0.001;
18.2% mean relative abundance in P. deltoides vs. 8.9% in P. trichocarpa × deltoides). Leaves had greater animal pathogens (F1,81= 4.08, p= 0.05), endophytes
(F1,81= 7.81, p= 0.007), and undefined saprotrophs in
P. deltoides tissue (0.02%, 0.06%, 6.4%) compared to hybrid plants (0.01%, 0.02%, 1.6%, respectively). Inter-estingly, plant pathogen relative abundance did not differ between genotypes in leaf tissues (9.2% P. deltoides, 8.7% hybrids; p= 0.810).
Several OTUs were detected for both bacteria and fungi that significantly differed across habitats and be-tween genotypes (Table3). Across broad habitat categor-ies, there were four OTUs that were indicative of leaf habitats, specifically Pseudomonas sp. and OTUs with highest taxonomic affinity to Ascomycota (p≤0.01). BLASTn confirmed these classifications and identified the Ascomycota OTUs as Marssonina brunnea. One fungal indicator was found for stem habitats, classified in Chytridiomycota using UNITE, but classified as uni-cellular algae in BLASTn, so this OTU may potentially be a contaminant. Three indicator taxa existed for root tissues—Pseudomonas sp.,Codineaopsis sp., and an un-cultured ascomycete (Table 3). The same two fungal OTUs (OTU 2, 14988), which were indicators for leaf
Table 1Permutational multivariate ANOVA results with Bray–Curtis distance matrices implemented to partition sources of variation in this study (habitat, genotype, interaction between habitat and genotype (H × G)) for both archaeal/bacterial and fungal communities. All samples were included therefore the main effect of habitat represents the broad categories of leaves, stems, roots, and soils. Statistical significance (P(perm)) computed based on sequential sums of squares from 9999 permutations
Community Source of variation SS MS R2 Pseudo-F P(perm)
Bacteria Habitat 307,710 102,570 0.30 40.3 0.0001
Genotype 18,469 18,469 0.02 7.3 0.0001
Interaction 41,533 13,844 0.04 5.4 0.0001
Residuals 663,810 2543.3 0.64
Total 1,036,500 1
Fungi Habitat 246,890 82,295 0.24 32.2 0.0001
Genotype 26,376 26,376 0.03 10.3 0.0001
Interaction 79,953 26,651 0.08 10.4 0.0001
Residuals 677,060 2554.9 0.65
tissue (Marssonina brunnea), were also indicators for the P. trichocarpa × deltoides hybrid across all broad habitat categories (relative abundance 7.1 and 13.4%, re-spectively; Table 3). Within leaf communities, several fungal OTUs were indicators for hybrid genotype tissues and were classified asMarssonina brunneavia BLASTn. Further, one fungal OTU, Telletiopsis washingtonensis, was an indicator forP. deltoidesleaf tissue. Lastly, within stem communities, two bacteria OTUs—Curtobacterium flaccumfaciensand Elsinoe banksiae—were indicators for
hybrid stem tissue (Table 2). The relative abundance of
both Septoria sp. and Marssonina brunnea, common
Populuspathogens, differed across leaf niches and geno-types (Additional file1: Tables S3–S4). Notably, both po-tential fungal pathogens were significantly greater in relative abundance in hybrid ramets (Fig.5).
Discussion
This study demonstrates that thePopulusmicrobiome sig-nificantly differs across the soil-root-stem-leaf landscape (Additional file1: Table S12) and at a finer scale (within each of these niches; Fig. 3). Both archaeal/bacterial and fungal community composition shifted more so across habitats than between tree genotype when considering broad habitat classifications (i.e., soils, roots, stems, and leaves; Table1) indicating environmental filtering (e.g., tis-sue specific filters) as a strong selective force for microbial communities across these environments. However, the fungal microbiome within leaf habitats varied more so be-tween genotypes compared to habitat (Table2), likely in-fluenced by the dominance of two fungal pathogens, Marssonina brunneaandSeptoria sp., within leaves (Fig.5 and Table3). These pathogens likely impacted turnover of microbial populations within the susceptible hybrid ra-mets. Bacterial diversity was greater in soils relative to roots, and aboveground habitats, but contrary to this, fun-gal diversity was similar between soils, stems, and leaves, whereas stem fungi had greater diversity compared to leaves and roots (Fig. 2). These results suggest not only that niche-based processes (i.e., habitat selection) largely drive both archaeal/bacterial and fungal community as-sembly across plant tissues, but also that specific mecha-nisms of assembly (e.g., niche partitioning, life history strategies) differ for archaea/bacteria and fungi across the Populus environment. However, due to amplification is-sues with specific tisis-sues (i.e., rarefying at 500 sequences for bacterial communities), conclusions regarding micro-bial diversity may be limited in this particularly study and warrant further validation.
Habitat selection effects
Assembly of plant-associated microbial communities may be driven by niche-based processes, specifically plant gen-etic factors [41], acquisition via tissue-level selection, or stochasticity [42]. We observed significant differences in microbial diversity and community composition across broadly defined habitats (Figs.1,2,3, and 4), and within these habitat categories (Additional file1: Tables S5–S11). This agrees with our hypotheses that microbial communi-ties would vary across the plant niches surveyed and is likely due to differences in regional species pools that colonize the various habitats (e.g., soil for roots, rainfall and aerial dispersal for leaves and stems) and niche parti-tioning as an outcome of microbial life history differences. Fig. 2Simpson’s (1−D) diversity across broad habitats (leaf, stem, root,
The variation attributed to habitat, or plant tissue type, as a control on community composition indicates the strength of biotic (plant selection) or abiotic drivers of microbiome differentiation. Selection of microbial members across habi-tats are likely due to (1) interplay withPopulusbiochemical products [43], (2) mutualistic associations via plant growth-promoting microbes, or (3) large differences in abiotic fac-tors such as nutrient availability and light exposure within aboveground tissues compared to belowground [6]. The lat-ter may be especially relevant for the differences in ar-chaeal/bacterial and fungal diversity across habitats. Fungal species, which are generally more tolerant to desiccation
compared to bacteria, may proliferate under harsh environ-ments (e.g., phyllospheres). Due to stress tolerance, or per-haps more overlap in fungal niche requirements, a greater degree of coexistence may exist for fungal communities within aboveground tissue [44].
Table 2Permutational multivariate ANOVA results with Bray–Curtis distance matrices implemented to partition sources of variation in this study (niche, genotype, interaction between niche and genotype (N × G)) for both archaeal/bacterial and fungal communities. Leaves, stems, roots, and soil communities were analyzed separately; therefore, habitat effects refer to finer-scale niches within these respective broad habitat categories. Statistical significance (P(perm)) was computed based on sequential sums of squares from 9999 permutations
Community Habitat Source of variation SS MS R2 Pseudo-F P(perm)
Bacteria Leaves Niche 78,980 8775.6 0.29 5.0 0.0001
Genotype 26,849 26,849 0.10 15.2 0.0001
N × G 37,557 4173 0.14 2.4 0.0001
Residuals 125,080 1761.7 0.46
Total 272,940 1.00
Fungi Leaves Niche 48,697 6087.1 0.21 5.6 0.0001
Genotype 72,650 72,650 0.32 66.9 0.0001
N × G 29,836 3729.5 0.13 3.4 0.0001
Residuals 73,840 1085.9 0.32
Total 229,760 1.00
Bacteria Stem Niche 58,966 7370.8 0.31 5.4 0.0001
Genotype 19,362 19,362 0.10 14.3 0.0001
N × G 20,049 2506.2 0.10 1.8 0.0001
Residuals 92,356 1358.2 0.48
Total 191,000 1.00
Fungi Stem Niche 90,054 11,257 0.36 7.0 0.0001
Genotype 22,613 22,613 0.09 14.0 0.0001
N × G 21,776 2722 0.09 1.7 0.0001
Residuals 114,460 1612.1 0.46
Total 249,640 1.00
Bacteria Roots Niche 81,253 13,542 0.39 6.9 0.0001
Genotype 6752.2 6752.2 0.03 3.4 0.0001
N × G 13,966 2327.6 0.07 1.2 0.0213
Residuals 106,410 1970.6 0.51
Total 210,180 1.00
Fungi Roots Niche 53,637 8939.5 0.20 2.8 0.0001
Genotype 9286 9286 0.04 2.9 0.0001
N × G 23,063 3843.8 0.09 1.2 0.0183
Residuals 177,350 3167 0.67
Total 263,340 1.00
Bacteria Soil Niche 41,055 13,685 0.51 18.9 0.0001
Genotype 8807.4 8807.4 0.11 12.2 0.0001
N × G 7020.7 2340.2 0.09 3.2 0.0001
Residuals 23,182 724.5 0.29
Total 80,066 1.00
Fungi Soil Niche 28,882 9627.3 0.31 5.9 0.0001
Genotype 8470.1 8470.1 0.09 5.2 0.0001
N × G 8920.8 2973.6 0.10 1.8 0.0001
Residuals 45,882 1638.6 0.50
pathogens, both ascomycetes. Stem tissues were likewise dominated by these groups, but also were enriched in Actinobacteria and Basidiomycota, Chytridiomycota, and Glomeromycota (Additional file 1: Table S12). Gamma-proteobacteria and Actinobacteria, as well as representa-tives of the former fungal Zygomycota, were most abundant in root tissues (Table 2). Many of these same taxa were reported inPopulus trichocarparoots as part of the Populus genome study [14]. Surprisingly, based on fungal guild designations, we found less than 2% of fungi classified as mycorrhizal (both arbuscular and ectomycor-rhizae) across tree genotypes. This result is surprising as both AM and ECM fungi readily colonize poplar tree roots [46]. However, due to plant pathogens dominating plant tissues, albeit primarily stems and roots, their pres-ence may have prevented significant recruitment of bene-ficial mycorrhizae. In addition, chemical cues, such as phenolic compound production, common in Populus, may trigger fungal pathogen growth at low concentrations [47,48] and therefore cause significant species turnover in the microbiome.
Within some of the niches, there were indications that microbial function varied significantly across tissues and be-tween tree genotype. For example, withinPopulus deltoides
first-year heartwood xylem, there was a surprisingly large divergence from other similar stem niches (Fig.3) that was driven by a large number of Firmicutes (~ 20%), of which 11% were from a singleLactobacillusclassified OTU. Mul-tiple studies have suggested that heartwood environments (especially wetwood characteristic of Populus trees) can turn anoxic and harbor organisms capable of fermentation, nitrogen fixation, and methanogenesis [49–52]. However, heartwood formation in these 3-year-old trees was likely in-complete as this event does not generally occur inPopulus until years 3 to 5 depending on rate of growth [53,54]. Our results suggest we may be observing the beginnings of this change and its effects within this understudied microbial niche.
Populusgenotype effects
Between P. deltoides and P. trichocarpa × deltoides ge-notypes, we observed significant differences in both fun-gal diversity and composition within the broad habitat categories that are likely driven by greater fungal patho-gen abundances in the hybrid trees (Fig.2, Fig.5). While cursory examination of the site had revealed characteristic Septoria stem cankers on the trees prior to the study (C. Schadt, personal observation), the high pathogen load and
Table 3Indicator species analysis for bacterial and fungal OTUs across all samples (all samples community) and in leaf and stem communities. No indicator OTUs were detected for root or soil communities. Only dominant OTUs (≥1.0% relative abundance across samples) are given
Community Treatment OTU no. DB classification BLASTn classification Identity percentage/E-value Relative abundance
All samples Leaf 6 Pseudomonas sp. Pseudomonas sp. 100/3e−128 2.2
All samples Leaf 14 Pseudomonas sp. Pseudomonas oryzihabitansstrain* 100/3e−128 1.9
All samples Leaf 2 Ascomycota Marssonina brunnea 100/6e−99 4.3
All samples Leaf 14,988 Ascomycota Marssonina brunnea 100/5e−95 2.2
All samples Stem 16 Chytridiomycota Trebouxia impressa 100/6e−99 1.3
All samples Root 11,331 Pseudomonas sp. Pseudomonas sp. 98/1e−121 1.3
All samples Root 10,451 Codinaeopsis sp. Codinaeopsis sp.** 99/2e−94 1.6
All samples Root 42 Ascomycota Uncultured fungus 98/3e−72 1.1
All samples TD 2 Ascomycota Marssonina brunnea 100/6e−99 4.3
All samples TD 14,988 Ascomycota Marssonina brunnea 100/5e−95 2.2
Leaf DD 66 Exobasidiomycetes Telletiopsis washingtonensis 100/6e−99 1.1
Leaf TD 14,988 Ascomycota Marssonina brunnea 100/5e−95 13.4
Leaf TD 2 Ascomycota Marssonina brunnea 100/6e−99 7.1
Leaf TD 6721 Ascomycota Marssonina brunnea 99/1e−90 1.7
Leaf TD 2744 Ascomycota Marssonina brunnea 99/7e−89 1.1
Leaf TD 3701 Ascomycota Marssonina brunnea 98/7e−89 1.0
Leaf TD 19,038 Ascomycota Marssonina brunnea 100/8e−93 1.0
Stem TD 151 Microbacteriaceae Curtobacterium flaccumfaciensstrain 100/3e−128 1.6
Stem TD 14,143 Sphaceloma protearum Elsinoe banksiae 96/7e−84 2.6
*Representative sequence also had significant alignments withPseudomonas psychrotoleransstrains (identity percentage = 100%, E-value = 3e−128) **Representative sequence also had significant alignments withCodinaea acacieaeandFusariumsp. However, all other high-quality hits were either with
co-occurrence of both Septoria and Marssonina OTU within the hybrid trees was surprising and not recognized prior to the molecular analyses as we had assumed the leaf spots were also caused bySeptoria.P. deltoidesare resist-ant to certain sympatric fungal pathogens due to coevolu-tion in the Eastern USA [55], whereas the hybrid trees are susceptible due to lack of co-occurring pathogens in the Western USA [27]. Indeed, the severity of loss from Sep-toria stem cankers and premature defoliation from the Marssoninaleaf spot are the principle reasons hybrid pop-lar trees have not been commercially viable in the Eastern USA versus the Western USA where hybrids are grown
deltoidesand the hybrid trees (Fig.5) but only manifested disease symptoms in the hybrid. In the hybrid leaf tissues, SeptoriaOTUs were also at a much lower abundance than MarssoninaOTUs (Fig.2) suggesting that these pathogens are both able to colonize and coexist, butMarssoninamay have ecological strategies which allow it to more readily colonize the leaf habitats and proliferate.
Conclusions
The Populus woody plant system provides a relevant
model to examine how microbial communities vary across tissue level niches. Overall, this study demon-strates how niche-based processes, such as environmen-tal filtering or biotic interactions, drive microbiome composition and diversity within tree species. Further, this study indicates the potential importance of microbe-microbe interactions in microbial community compos-ition as indicated by the presence of fungal pathogens which may alter the microorganisms inhabiting the hy-brid Populus trees. However, while we suspect that the pathogens are playing a disproportionate role in struc-turing these communities, future studies will be needed to more carefully address this hypothesis using closely related pathogen-resistant and susceptible Populus genotypes.
Additional files
pvalues for pairwise comparisons in fungal diversity across stem niches. Two-way ANOVA models indicate that fungal diversity differed within habitats (F= 4.568,p< 0.001), and between tree genotypes (F= 6.127,p= 0.015). Table S11.Two-way ANOVA (habitat × genotype)pvalues for pairwise comparisons in fungal diversity across soil niches. Two-way ANOVA models indi-cate that fungal diversity differed within habitats (F= 6.026,p= 0.002), but not between tree genotypes (F= 0.036,p= 0.851).Table S12.Relative abundance of dominant (≥0.1%) archaeal/bacterial and fungal phyla and class for Proteo-bacteria across broad habitat categories and genotypes (mean ± SE). Two-way ANOVA models indicated all bacterial and fungal phyla, except Fusobacteria, dif-fered across habitat (p≤0.01) whereas two bacterial phyla differed between ge-notypes (p≤0.03) as denoted by bolded lettering. Letters denote Tukey’s HSD significant differences for main effects of habitat and genotype.Figure S1. Sam-pling schema for 30 plant niches. Each niche was sampled from five replicate Populus deltoidesclones andP. trichocarpa × deltoideshybrid clones, totaling 300 microbiome samples.Figure S2.Performance of plant nuclear 5.8S rRNA gene targeted peptide nucleic acid (PNA) blocker in select fungal ITS2 amplicon libraries. We used two different tissue types including fine root endosphere (SFR), developing leaf endosphere (LED), as well as rhizosphere soils. These are tested on samples originating fromPopulus deltoides(DD1) and aP. trichocarpa × deltoideshybrid (TD1). Samples with PNA blockers added are indicated by _PNA at the end of name.Figure S3.Rarefaction curves for bacteria across broad habitat classifications (leaves—red, stems—green, roots—blue, soil— or-ange) at 1000 sequences per sample depth.Figure S4.Rarefaction curves for fungi across broad habitat classifications (leaves—red, stems—green, roots— -blue, soil—orange) at 2000 sequences per sample depth. (DOCX 3250 kb)
Acknowledgements
The authors would like to thank Dale Pelletier, Jessica Velez, Sara Jawdy, Lee Gunter, Kenneth Lowe, Tatiana Karpinets, and Renee Johansen for their assistance with the field work, as well as Timothy Rials, The University of Tennessee Institute of Agriculture, and ArborGen Corporation for providing the site access and allowing us to harvest the trees from their field trial.
Funding
This research was sponsored by the Genomic Science Program, U.S. Department of Energy, Office of Science, Biological and Environmental Research, as part of the Plant Microbe Interfaces Scientific Focus Area at ORNL (http://pmi.ornl.gov). Oak Ridge National Laboratory is managed by UT-Battelle, LLC, for the U.S. Department of Energy under contract DEAC05-00OR22725.
Availability of data and materials
The sequence datasets generated during the current study are available at NCBI Sequence Read Archive: 16S-BioProject ID: PRJNA385484 and ITS2-BioProject ID: PRJNA384978.
Authors’contributions
CS designed the study. ZY, RV, and CS collected samples. MAC, AV, MC, and ZY prepared the samples for amplicon sequencing. MAC and AV performed the bioinformatics and statistical analyses. MAC, AV, and CS contributed to statistical interpretation of results. MAC, AV, ZY, GT, RV, and CS wrote the manuscript. All authors read and approved the final manuscript.
Ethics approval and consent to participate Not applicable
Consent for publication Not applicable
Competing interests
The authors declare that they have no competing interests.
Publisher’s Note
Springer Nature remains neutral with regard to jurisdictional claims in published maps and institutional affiliations.
Author details
1Biosciences Division, Oak Ridge National Laboratory, 1 Bethel Valley Rd, Oak
Ridge, TN 37831, USA.2Biology Department, Duke University, 130 Science
Drive, Durham, NC 27708, USA.3Microbiology Department, University of
Tennessee, M409 Walters Life Sciences, Knoxville, TN 37996, USA.4Present
address: Department of Biochemistry & Molecular Biology, Brody School of Medicine, East Carolina Diabetes & Obesity Institute, East Carolina University, Greenville, NC, USA.
Received: 28 July 2017 Accepted: 23 January 2018
References
1. Pii Y, Mimmo T, Tomasi N, Terzano R, Cesco S, Crecchio C. Microbial interactions in the rhizosphere: beneficial influences of plant growth-promoting rhizobacteria on nutrient acquisition process. A review. Biol Fertil Soils. 2015;51:403–15.
2. de Zelicourt A, Al-Yousif M, Hirt H. Rhizosphere microbes as essential partners for plant stress tolerance. Mol Plant. 2013;6:242–5.
3. Berendsen RL, Pieterse CMJ, Bakker PAHM. The rhizosphere microbiome and plant health. Trends Plant Sci. 2012;17:478–86.
4. Pineda A, Soler R, Pozo MJ, Rasmann S, Turlings TCJ. Editorial: above-belowground interactions involving plants, microbes and insects. Front Plant Sci. 2015;6:318.
5. Hacquard S, Schadt CW. Towards a holistic understanding of the beneficial interactions across the Populus microbiome. New Phytol. 2015;205:1424–30. 6. Vandenkoornhuyse P, Quaiser A, Duhamel M, Le Van A, Dufresne A. The
importance of the microbiome of the plant holobiont. New Phytol. 2015; 206:1196–206.
7. Pinto C, Pinho D, Sousa S, Pinheiro M, Egas C, Gomes AC. Unravelling the diversity of grapevine microbiome. PLoS One. 2014;9:e85622
8. Ottesen AR, Pena AG, White JR, Pettengill JB, Li C, Allard S, Rideout S, Allard M, Hill T, Evans P, et al. Baseline survey of the anatomical microbial ecology of an important food plant: Solanum lycopersicum (tomato). BMC Microbiol. 2013;13:114
9. Beckers B, Op De Beeck M, Weyens N, Boerjan W, Vangronsveld J. Structural variability and niche differentiation in the rhizosphere and endosphere bacterial microbiome of field-grown poplar trees. Microbiome. 2017;5:25. 10. Coleman-Derr D, Desgarennes D, Fonseca-Garcia C, Gross S, Clingenpeel S,
Woyke T, North G, Visel A, Partida-Martinez LP, Tringe SG. Plant compartment and biogeography affect microbiome composition in cultivated and native Agave species. New Phytol. 2016;209:798–811. 11. de Souza RSC, Okura VK, JSL A, Jorrin B, Lozano N, da Silva MJ,
Gonzalez-Guerrero M, de Araujo LM, Verza NC, Bagheri HC, et al. Unlocking the bacterial and fungal communities assemblages of sugarcane microbiome. Sci Rep. 2016;6:28774.
12. Leff JW, Del Tredici P, Friedman WE, Fierer N. Spatial structuring of bacterial communities within individual Ginkgo biloba trees. Environ Microbiol. 2015; 17:2352–61.
13. Zarraonaindia I, Owens SM, Weisenhorn P, West K, Hampton-Marcell J, Lax S, Bokulich NA, Mills DA, Martin G, Taghavi S, et al. The soil microbiome influences grapevine-associated microbiota. MBio. 2015;6:e02527-14. 14. Tuskan GA, DiFazio S, Jansson S, Bohlmann J, Grigoriev I, Hellsten U, Putnam
N, Ralph S, Rombauts S, Salamov A, et al. The genome of black cottonwood, Populus trichocarpa (Torr. & Gray). Science. 2006;313:1596–604.
15. Tuskan GA, DiFazio SP, Teichmann T. Poplar genomics is getting popular: the impact of the poplar genome project on tree research. Plant Biol. 2004;6:2–4. 16. Dinus RJ, Payne P, Sewell NM, Chiang VL, Tuskan GA. Genetic modification
of short rotation popular wood: properties for ethanol fuel and fiber productions. Crit Rev Plant Sci. 2001;20:51–69.
17. Tuskan GA. Short-rotation woody crop supply systems in the United States: what do we know and what do we need to know? Biomass Bioenergy. 1998;14:307–15.
18. Sannigrahi P, Ragauskas AJ, Tuskan GA. Poplar as a feedstock for biofuels: a review of compositional characteristics. Biofuels Bioprod Biorefin. 2010;4: 209–26.
19. Ragauskas AJ, Beckham GT, Biddy MJ, Chandra R, Chen F, Davis MF, Davison BH, Dixon RA, Gilna P, Keller M, et al. Lignin valorization: improving lignin processing in the biorefinery. Science. 2014;344:1246843.
20. Rubin EM. Genomics of cellulosic biofuels. Nature. 2008;454:841–5. 21. Gottel NR, Castro HF, Kerley M, Yang ZM, Pelletier DA, Podar M, Karpinets T,
22. Shakya M, Gottel N, Castro H, Yang ZMK, Gunter L, Labbe J, Muchero W, Bonito G, Vilgalys R, Tuskan G, et al. A multifactor analysis of fungal and bacterial community structure in the root microbiome of mature Populus deltoides trees. PLoS One. 2013;8:e76382.
23. Bonito G, Reynolds H, Robeson MS, Nelson J, Hodkinson BP, Tuskan G, Schadt CW, Vilgalys R. Plant host and soil origin influence fungal and bacterial assemblages in the roots of woody plants. Mol Ecol. 2014;23:3356–70. 24. Taghavi S, Garafola C, Monchy S, Newman L, Hoffman A, Weyens N, Barac T,
Vangronsveld J, van der Lelie D. Genome survey and characterization of Endophytic bacteria exhibiting a beneficial effect on growth and development of poplar trees. Appl Environ Microbiol. 2009;75:748–57. 25. Henning JA, Weston DJ, Pelletier DA, Timm CM, Jawdy SS, Classen AT. Root
bacterial endophytes alter plant phenotype, but not physiology. PeerJ. 2016;4: e2606
26. Timm CM, Pelletier DA, Jawdy SS, Gunter LE, Henning JA, Engle N, Aufrecht J, Gee E, Nookaew I, Yang ZM, et al. Two poplar-associated bacterial isolates induce additive favorable responses in a constructed plant-microbiome system. Front Plant Sci. 2016;7:497.
27. Newcombe G, Ostry N. Recessive resistance to Septoria stem canker of hybrid poplar. Phytopathology. 2001;91:1081–4.
28. Busby PE, Newcombe G, Dirzo R, Whitham TG. Genetic basis of pathogen community structure for foundation tree species in a common garden and in the wild. J Ecol. 2013;101:867–77.
29. Busby PE, Peay KG, Newcombe G. Common foliar fungi of Populus trichocarpa modify Melampsora rust disease severity. New Phytol. 2016;209: 1681–92.
30. Badri DV, Vivanco JM. Regulation and function of root exudates. Plant Cell Environ. 2009;32:666–81.
31. Richter-Heitmann T, Eickhorst T, Knauth S, Friedrich MW, Schmidt H. Evaluation of strategies to separate root-associated microbial communities: a crucial choice in Rhizobiome research. Front Microbiol. 2016;7:773 32. Lundberg DS, Yourstone S, Mieczkowski P, Jones CD, Dangl JL. Practical
innovations for high-throughput amplicon sequencing. Nat Methods. 2013; 10:999–1002.
33. Caporaso JG, Kuczynski J, Stombaugh J, Bittinger K, Bushman FD, Costello EK, Fierer N, Pena AG, Goodrich JK, Gordon JI, et al. QIIME allows analysis of high-throughput community sequencing data. Nat Methods. 2010;7:335–6. 34. Martin M. Cutadapt removes adapter sequences from high-throughput
sequencing reads. EMBnet J. 2011;17:10
35. Edgar RC. Search and clustering orders of magnitude faster than BLAST. Bioinformatics. 2010;26:2460–1.
36. Abarenkov K, Nilsson RH, Larsson KH, Alexander IJ, Eberhardt U, Erland S, Hoiland K, Kjoller R, Larsson E, Pennanen T, et al. The UNITE database for molecular identification of fungi - recent updates and future perspectives. New Phytol. 2010;186:281–5.
37. Anderson MJ. A new method for non-parametric multivariate analysis of variance. Aus Ecol. 2001;26:32–46.
38. Herve M. Testing and plotting procedures for biostatistics. In: Package ‘RVAideMemoire’; 2018.
39. De Caceres M, Legendre P. Associations between species and groups of sites: indices and statistical inference. Ecology. 2009;90:3566–74.
40. Nguyen NH, Song ZW, Bates ST, Branco S, Tedersoo L, Menke J, Schilling JS, Kennedy PG. FUNGuild: an open annotation tool for parsing fungal community datasets by ecological guild. Fungal Ecol. 2016;20:241–8. 41. Edwards J, Johnson C, Santos-Medellin C, Lurie E, Podishetty NK, Bhatnagar
S, Eisen JA, Sundaresan V. Structure, variation, and assembly of the root-associated microbiomes of rice. Proc Natl Acad Sci U S A. 2015;112:E911–20. 42. Emerson BC, Gillespie RG. Phylogenetic analysis of community assembly
and structure over space and time. Trends Ecol Evol. 2008;23:619–30. 43. Zamioudis C, Pieterse CMJ. Modulation of host immunity by beneficial
microbes. Mol Plant-Microbe Interact. 2012;25:139–50.
44. Whipps JM, Hand P, Pink D, Bending GD. Phyllosphere microbiology with special reference to diversity and plant genotype. J Appl Microbiol. 2008; 105:1744–55.
45. Peay KG, Kennedy PG, Talbot JM. Dimensions of biodiversity in the Earth mycobiome. Nat Rev Microbiol. 2016;14:434–47.
46. Baum C, Makeschin F. Effects of nitrogen and phosphorus fertilization on mycorrhizal formation of two poplar clones (Populus trichocarpa and P-tremula x tremuloides). J Plant Nutr Soil Sci. 2000;163:491–7.
47. Mendes R, Garbeva P, Raaijmakers JM. The rhizosphere microbiome: significance of plant beneficial, plant pathogenic, and human pathogenic microorganisms. FEMS Microbiol Rev. 2013;37:634–63.
48. Wu HS, Liu DY, Ling N, Bao W, Ying RR, Ou YH, Huo ZH, Li YF, Shen QR. Effects of vanillic acid on the growth and development of Fusarium oxysporum f. sp niveum. Allelopath J. 2008;22:111–21.
49. Knoth JL, Kim SH, Ettl GJ, Doty SL. Biological nitrogen fixation and biomass accumulation within poplar clones as a result of inoculations with diazotrophic endophyte consortia. New Phytol. 2014;201:599–609. 50. Schink B, Ward JC, Zeikus JG. Microbiology of wetwood—role of anaerobic
bacterial-populations in living trees. J Gen Microbiol. 1981;123:313–22. 51. Zeikus JG, Ward JC. Methane formation in living trees—microbial origin.
Science. 1974;184:1181–3.
52. Doty SL, Sher AW, Fleck ND, Khorasani M, Bumgarner RE, Khan Z, Ko AWK, Kim SH, DeLuca TH. Variable nitrogen fixation in wild populus. PLoS One. 2016;11:e0155979
53. Telewski FW, Aloni R, Sauter JJ. Physiology of secondary tissues of Populus. In: Biology of Populus and its implications for management and conservation. Ottawa: NRC Research Press; 1996. p. 301–29.
54. Groover AT, Nieminen K, Helariutta Y, Mansfield SD. Wood formation in Populus. In: Genetics and genomics of Populus. New York: Springer; 2010. p. 201–24.
55. Zhu S, Cao YZ, Jiang C, Tan BY, Wang Z, Feng SS, Zhang L, Su XH, Brejova B, Vinar T, et al. Sequencing the genome of Marssonina brunnea reveals fungus-poplar co-evolution. BMC Genomics. 2012;13:382
56. Ostry ME. Biology of Septoria Musiva and Marssonina-Brunnea in hybrid Populus plantations and control of Septoria canker in nurseries. Eur J For Pathol. 1987;17:158–65.
• We accept pre-submission inquiries
• Our selector tool helps you to find the most relevant journal
• We provide round the clock customer support
• Convenient online submission
• Thorough peer review
• Inclusion in PubMed and all major indexing services
• Maximum visibility for your research
Submit your manuscript at www.biomedcentral.com/submit