R E S E A R C H A R T I C L E
Open Access
Quantifying stability in gene list ranking across
microarray derived clinical biomarkers
Sebastian Schneckener
1, Nilou S Arden
2,3,4and Andreas Schuppert
1,2*Abstract
Background:Identifying stable gene lists for diagnosis, prognosis prediction, and treatment guidance of tumors remains a major challenge in cancer research. Microarrays measuring differential gene expression are widely used and should be versatile predictors of disease and other phenotypic data. However, gene expression profile studies and predictive biomarkers are often of low power, requiring numerous samples for a sound statistic, or vary between studies. Given the inconsistency of results across similar studies, methods that identify robust biomarkers from microarray data are needed to relay true biological information. Here we present a method to demonstrate that gene list stability and predictive power depends not only on the size of studies, but also on the clinical phenotype.
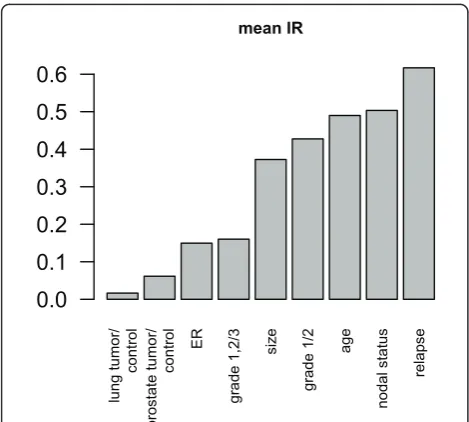
Results:Our method projects genomic tumor expression data to a lower dimensional space representing the main variation in the data. Some information regarding the phenotype resides in this low dimensional space, while some information resides in the residuum. We then introduce an information ratio (IR) as a metric defined by the partition between projected and residual space. Upon grouping phenotypes such as tumor tissue, histological grades, relapse, or aging, we show that higher IR values correlated with phenotypes that yield less robust biomarkers whereas lower IR values showed higher transferability across studies. Our results indicate that the IR is correlated with predictive accuracy. When tested across different published datasets, the IR can identify
information-rich data characterizing clinical phenotypes and stable biomarkers.
Conclusions:The IR presents a quantitative metric to estimate the information content of gene expression data with respect to particular phenotypes.
Background Motivation
The challenge to identify stable tumor prognosis and predictive outcome markers remains critical in clinical cancer research. Many studies rely on microarrays to determine which genes are predominantly indicative of clinical cancer phenotypes or prognosis. However, biolo-gical and technical variations across samples and studies make it challenging to identify true, predictive clinical biomarkers [1,2]. Identification of stable gene expression signatures can facilitate the classification of clinical phe-notypes and their associated physiological states. Histo-logic tumor grade, ER (estrogen receptor) status and predicted risk of relapse are among the currently used labels to distinguish prognosis and treatment regimes.
Our motivation in this study was to determine when stable predictive biomarkers can be identified from mul-tiple microarray studies or meta-analyses.
Dimension Reduction
Results from microarray experiments can be arranged as an nby p matrix withn being the number of samples andpthe number of measured features or probesets.n tends to be much smaller than p. Dimension reduction techniques are widely used to reduce the dimensionality of the data frompto a smaller valued[3,4]. The result-ing projection represents information which classifies cells and tissues relative to physiological states and phe-notypes [5].
Various methods can be used to identify large scale patterns that comprise genomic subspaces. These sub-spaces can then be utilized to extract biologically signifi-cant information from the genome. For example, linear
* Correspondence: [email protected]
1Bayer AG, Bayer Technology Services, 51368 Leverkusen, Germany
Full list of author information is available at the end of the article
projection algorithms such as SVD, PCA, ICA, or factor analysis and less commonly applied nonlinear methods such as non-negative matrix factorization (NMF) can be utilized in mapping and assessing differential behavior across large-scale genomic data [6-11]. The result is a clearer picture of the role differential gene regulation has on cellular phenotypes and the potential to identify predictive genes for disease diagnosis or prognosis. Such analyses are then critical to understanding cellular phy-siology, clinical phenotypes and for predicting the effi-cacy of drugs on diseased cells.
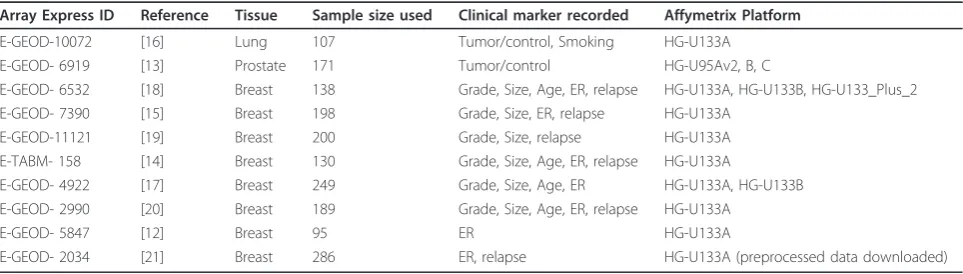
Data sets and Analysis
In our analysis, published data from eight breast cancer studies, one lung cancer and one prostate cancer study were analyzed (Table 1) [12-21]. All redundant samples were removed and all expression values were mapped to corresponding gene symbols. Our analysis was restricted to genes that were present across all studies. The degree of recorded clinical information varies between studies with at most 5 phenotypic variables recorded (Table 1) per study. This allowed for a total of 87 pair-wise com-parisons between studies regarding a specific phenotype. Details on data preparation and available clinical para-meters are described below in the Methods section.
Results
The following section presents the results of the analysis of several publicly available microarray datasets. For each dataset the normalized expression values were pro-jected to a lower dimensional (d= 4) space. Differential expression and corresponding p-values of differential expression were calculated in projected and residual space for a series of phenotypic variables. Hence, for each gene and combination of phenotype and study there are two p-values.
Comparison of different clinical phenotypes
Comparing the p-values of the projected expression value and the residual expression value can bring light
to where information lies in the measured expression data. The information may reside mainly in the residual space, mainly in the projected space, or somewhere in between. A comparison of log10p-value of differential
expression (referred to as lp below) data from lung and breast tissue showing different clinical phenotypes was performed as shown in Figure 1. Data structures shown in Figures 1a, b, and 1c are categorized as data projec-tion Types 1, 2, and 3 (correlated to the informaprojec-tion ratio (IR) which is described in detail in the Methods section) respectively so that they may be easily referred to later in the text to describe the specific type of observed information distribution.
Type 1: The projection of lower dimensionality data, lpp(blue crosses) onto Sn shows high significance (low
lp-values) compared to the residuals lpr (red crosses),
almost all significance from the original data (x-axis) is expressed in lpp, as shown by the distribution of
p-values. The ratio between the lprand lpp(information
ratio) is low (Figure 1a, shows p-values of differential expression between tumor and control tissue).
Type 2: The projection lpp (blue crosses) onto Sn
shows similar p-values compared to the residuals lpr
(red crosses). The information ratio is almost 0.5 (thus half of the information is stored in the residual space) (Figure 1b, showing differential expression smoker-non-smoker).
Type 3: The projection lpp (blue crosses) onto Sn
shows very low absolute values compared to the resi-duals lpr (red crosses). The information ratio is almost 1
(thus most of the information is stored in the residual space). (Figure 1c, shows differential expression between mammacarcinoma leading to post-surgical metastasis and no metastasis). Observe that the p-values are high compared to the other cases. Therefore, the overall information content of the expression data is low with respect to the phenotype.
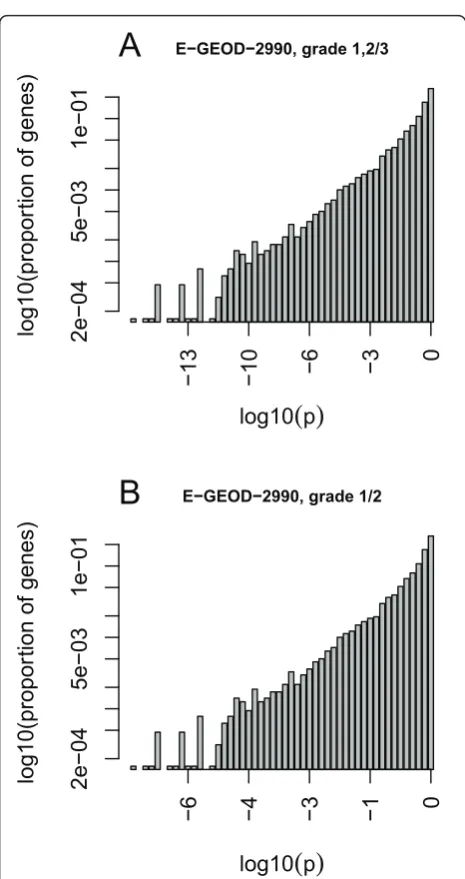
The principal components are sorted in decreasing order of variance explained. The projections of differen-tial expression onto the first principal components
Table 1 Data sets used for this study with ArrayExpress identifiers, literature references and available meta data
Array Express ID Reference Tissue Sample size used Clinical marker recorded Affymetrix Platform
E-GEOD-10072 [16] Lung 107 Tumor/control, Smoking HG-U133A
E-GEOD- 6919 [13] Prostate 171 Tumor/control HG-U95Av2, B, C
E-GEOD- 6532 [18] Breast 138 Grade, Size, Age, ER, relapse HG-U133A, HG-U133B, HG-U133_Plus_2
E-GEOD- 7390 [15] Breast 198 Grade, Size, ER, relapse HG-U133A
E-GEOD-11121 [19] Breast 200 Grade, Size, relapse HG-U133A
E-TABM- 158 [14] Breast 130 Grade, Size, Age, ER, relapse HG-U133A
E-GEOD- 4922 [17] Breast 249 Grade, Size, Age, ER HG-U133A, HG-U133B
E-GEOD- 2990 [20] Breast 189 Grade, Size, Age, ER, relapse HG-U133A
E-GEOD- 5847 [12] Breast 95 ER HG-U133A