R E S E A R C H
Open Access
Probability-based collaborative filtering
model for predicting gene
–
disease
associations
Xiangxiang Zeng
1,2, Ningxiang Ding
1, Alfonso Rodríguez-Patón
2and Quan Zou
3*FromIEEE BIBM International Conference on Bioinformatics & Biomedicine (BIBM) 2016 Shenzhen, China. 15-18 December 2016
Abstract
Background:Accurately predicting pathogenic human genes has been challenging in recent research. Considering extensive gene–disease data verified by biological experiments, we can apply computational methods to perform accurate predictions with reduced time and expenses.
Methods:We propose a probability-based collaborative filtering model (PCFM) to predict pathogenic human genes. Several kinds of data sets, containing data of humans and data of other nonhuman species, are integrated in our model. Firstly, on the basis of a typical latent factorization model, we propose model I with an average heterogeneous regularization. Secondly, we develop modified model II with personal heterogeneous regularization to enhance the accuracy of aforementioned models. In this model, vector space similarity or Pearson correlation coefficient metrics and data on related species are also used.
Results:We compared the results of PCFM with the results of four state-of-arts approaches. The results show that PCFM performs better than other advanced approaches.
Conclusions:PCFM model can be leveraged for predictions of disease genes, especially for new human genes or diseases with no known relationships.
Keywords:Gene–disease association prediction, Latent factor model, Heterogeneous similarity regularization, Biological network
Background
It is a material trial in biology that correctly predicting novel pathogenic genes associated with human diseases. However, detecting gene–disease relationships can be challenging [1].
Many strategies have been proposed to predict gene– disease associations. In general, a prediction method is based on “guilt by association” (GBA) principle [2]. In this principle, novel pathogenic genes are determined on the basis of the associations between such genes and relevant neighboring genes. Approaches integrating diverse data sources have been generally exploited for
predictions of pathogenic human genes. For instance, CIPHER [3], GeneWalker [4], Prince [5], RWRH [6], Katz and CATAPULT [7], inductive matrix completion [8]. A number of varieties of evidence continually ex-ploited for prediction of gene–disease ralationships were studied by Piro and Di Cunto [9]. With a text-mining method Driel et al. detected the relationships of human genes related to diseases determined in the Online Mendelian Inheritance in Man (OMIM) [10, 11]. In pro-tein interaction data, Köhler et al. predicted pathogenic human genes using random walk to regulate similarities. The random walk is verified to be more precise than other methods [12]. For analyzing protein interaction, an approach “network propagation” has also been devel-oped on the basis of random walk [13, 14].
* Correspondence:[email protected]
3School of Computer Science and Technology, Tianjin University, Tianjin,
China
Full list of author information is available at the end of the article
The predictions of gene–disease relationships can be con-sidered as designing a recommender system to commend the items (genes) of interest to a user (disease) on the basis of the preference that a gene possibly encodes a disease. Users related with one another in recommender systems likely experience mutual tastes or share similar interests in accordance with homophily principle [15]. Recommender systems usually rely on collaborative filtering (CF) [16], which depends on prior disposals to predict relationships between users and items. CF has been widely applied effect-ively in many practices [17]. CF has also been adopted in some remarkable advancements by some renowned com-panies, including Amazon [18], TiVo, and Netflix, because of the simplicity and effectiveness of this technique. In CF, users A and B similarly act on or rate other items if these users demonstrate a similar behavior or likewise rate n items [19]. The two main methods of CF are latent factor models and neighborhood models. In latent factor models, evidence of both users and items is integrated. In neighbor-hood models, similarities between users and items are examined. Regarded as optimum methods to obtain more accurate consequences in Netflix prize, latent factor models, such as matrix factorization, have been widely used in recommender systems [20]. Recommender systems have also been used in other models [21–24]. Koren et al. sug-gested a combined model with high prediction accuracy by leveraging the superiorities of both neighborhood and latent factor methods. Recent studies [23, 24] integrated a network-based similarity property between users into advanced matrix factorization recommendation approaches [25].
In this study, we proposed a probability-based collabora-tive filtering model (PCFM) for prediction of gene–disease relationships. As neighborhood models can not cover over-all demonstrated information, latent factor models were chosen for our proposed model. On the basis of traditional latent factor models, we defined an additional probability-based approach which can detect unknown relationships. The prediction of gene–disease associations has been con-sidered a semi-supervised learning problem because of few certified relationships. In this study, this semi-supervised learning problem was translated into an acquainted super-vised learning problem with PCFM. If values in gene– dis-ease association matrix are 0 or 1, predictions are regarded as binary classification problems. The collaborative filtering approach leveraged in the recommender system was de-signed to rate matrix with precise scores. Hence, the models cannot be immediately exploited in the predictions for gene–disease associations. Two models with regul-arization were developed to modify the basic model.
Methods Datasets
Three types of data sets are shown in Fig. 1. We obtained gene–gene relationships from HumanNet [26],
which includes 12,331 human genes. HumanNet with 733,836 linkages is a genome-scale human genes net-work, constructed based on 21 diverse proteomics and genomics evidences, including four species: protein– protein interactions, human mRNA coexpression, com-parative genomics data sets, and protein complex data sets. Different data sets were fused into a functional gene-gene relationship network.
The gene–disease relationships were downloaded from Online Mendelian Inheritance in Man (OMMI), the standard dataset to appraise predictions of pathogenic human genes. OMIM is a authoritative and comprehen-sive compendium of human genes and genetic diseases which is updated daily and freely available on the web-site. The full-text, referenced overviews in OMIM con-tain information on all known mendelian disorders. This standard dataset contains numerous linkages with other genetics resources. OMIM has been developing since it was initiated in the early 1960s, while it was made gener-ally available on the internet starting in 1987. Nowadays, OMIM was developed for the World Wide Web by the National Center for Biotechnology Information (NCBI). With 3209 diseases connecting at least one known gene and 3954 demonstrated linkages, this network is fre-quently leveraged in researches of genes. In our experi-ment, given the existence of orthologous genes in humans and other species [27], we append the gene-disease linkages between orthologous genes and eight nonhuman species diseases. The description of associa-tions between orthologous genes and diseases of eight other nonhuman species can be found in [28].
And the disease–disease similarity associations was downloaded from [28]. This dataset provides similarities between human diseases, which show pertinence
between genes with similar interactive function. The disease-disease association network has a positive influence on prediction for gene–disease associations. This network contains 3209 diseases and 3,165,225 entries. In this network, values of edges measure the degree of similarity.
Latent factor models
Recommender systems involve various input data, including items and users, which often correspond to a matrix. In a rating matrix Rm ×n, mrepresents the num-ber of users, andnrepresents the number of items. The basic latent factor models manage to characterize users and items by using vectors of factors inferred from item-rating patterns. A high accordance exists between user and item factor issues in a recommendation. Latent fac-tor models map items and users to a corporate latent factor space of dimensionality D, in which users are re-lated to matrix U∈ℝm×D, and items are related to matrix V∈ℝn×D. The approximate rating matrix ac-quires the overall interest of users in the characteristics of items and is denoted by
R≈UVT ð1Þ
where U represents the training feature matrix of users in the latent factor space, in which the ith row corre-sponds to the user feature vector ui; and V represents the training feature matrix of items, in which the ith row corresponds to the item feature vectorvi.
The user–item matrix is a very sparse matrix with a large number of undiscovered scores in general. To avoid insignificant calculations, the least square optimization al-gorithm is exploited for recommender systems to settle the problem, and the specific optimization equation is
minU;V
1 2
Xm
i¼1
Xn
j¼1Iij Rij−UiV
T j
2
þλ1
2k kU
2þλ2
2 k kV 2
ð2Þ
where λ1, λ2> 0, and Iij is an indicator function, for
which if Rij is known, Iij= 1, otherwise, Iij= 0. Two dif-ferent approaches are leveraged ordinarily to minimize the objective function: alternating least squares method and stochastic gradient descent method. Alternating least squares rotate by calculating the partial derivatives for factor vectors of users and items, and then the method sets them both equal to zero. Multiple repeti-tions of this process assure that each step decreases the equation until convergence [29]. The stochastic gradient descent method randomly defines an initial value and calculates the related prediction error. The parameters are then modified in the opposite direction of the gradi-ent. This method is popular and successful in many cases [21,30,31]. Although the alternating least squares
method is favorable in systems using parallelization [32] and systems centered on implicit data [33], this method is generally more complex and slower than the stochas-tic gradient descent. Therefore, the latter is exploited in this study.
Semi-supervised learning method
The main difficulty of predicting gene–disease associa-tions can be ascribed to the lack of negative samples in the training process. For the imperfection of gene–disease data, we can obtain two pivotal specialties of our experi-mental data: (1) for every disease, few known genes are re-lated to it; we may know the relevant genes for the disease, but we are unaware of the irrelevant ones; (2) many unlabeled gene–disease pairs exist with the prior in-formation, but most of them are negative associations [7].
We can utilize the semi-supervised learning method for our experiments. Liu et al. searched different var-ieties of approaches to select negative samples [34]. Given that recent studies showed few positive samples in the gene–disease dataset, if we select a sample from the gene–disease matrix, the sample is likely to be a positive one; as a consequence, negative samples can be selected randomly from the training dataset. Mordelet et al. proposed a ProDiGe method to select negative sam-ples by adopting the PU learning framework [35].
In our experiment, we chose the random walk method to select negative samples. If Pgd denotes the probability that genegwalks to human diseased,Pgdis formulated by
Pgd¼SgIGDSd= Sg j jSd
ð3Þ
where Sg and Sd represent the human gene similarity matrix and disease similarity matrix, respectively, and
IGD is an adjacent matrix showing the known associa-tions between human genes and diseases in OMMI. If
NS denotes a negative sample set, and θ is assigned to be the threshold value, then NS= {NS≤θ,NS>θ}. The
negative samples indicating NS≤θ are selected from the
samples with probabilities are less than θ in Pgd, and
NS>θ is selected from the samples with probabilities of
more than θ in Pgd; the number of NS>θ negative
sam-ples is small. We choose negative samsam-ples with probabil-ities of more than θ in Pgd because as the prior information shows, most samples in the gene–disease association matrix are negative samples; therefore, to en-hance the generalizability of this model, few NS>θ
nega-tive samples are joined.
Basic model: probability-based collaborative filtering model
binary scores of 0 or 1. Similarly, alternating least squares cannot work in this experiment.
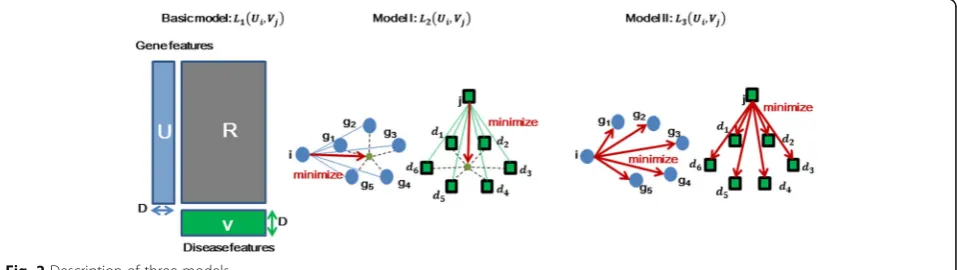
The basic model is shown in Fig. 2. Let P(Y= 1|Ui,Vj) denote the probability that human geneiis related to dis-ease j, and let P(Y= 0|Ui,Vj) denote the probability that this gene is irrelevant to that disease. We define matrix U∈ℝm×DandV∈ℝn×Das the feature matrixes of human genes and diseases in the latent factor space of dimension-alityD. We defineP(Y= 1|Ui,Vj) andP(Y= 0|Ui,Vj) as
P Yij¼1jUi;Vj
¼ 1
exp f Ui;Vj
ð4Þ
P Yij¼0jUi;Vj
¼ exp f Ui;Vj
−1 exp f Ui;Vj
ð5Þ
In Eq. (5), fðUi;VjÞ ¼ Ui−VTj
k k2
2 þϑ, and ϑ is a tiny
positive number; in this experiment, ϑ is set as 0.0001. We can see that, if f(Ui,Vj)→0, P(Yij= 1|Ui,Vj)→1; if f(Ui,Vj)→∞, P(Yij= 0|Ui,Vj)→1.
Ui and Vj is obtained by using the maximum likeli-hood estimate. We define that P(Yij= 1|Ui,Vj) =π(Ui,Vj) and P(Yij= 0|Ui,Vj) = 1−π(Ui,Vj), the likelihood func-tion is
Ym;n
i;j πðUi;Vj
ÞYij
1−πðUi;Vj
Þ1−Yij ð6Þ
The log-likelihood function is
L1ðUi;VjÞ ¼
Pm; n
i; j Yij log πðUi;VjÞ þ 1−Yij
log 1−πðUi;VjÞ
¼Pm; n i; j 1−Yij
log 1−e−fðUi;VjÞÞ−Y ijfðUi;Vj
ð7Þ
The maximum value of L1(Ui,Vj) is calculated, and
then we obtain the estimated value of L1(Ui,Vj).
Subse-quently, the stochastic gradient descent method is used to solve this problem. The formulas updating the gradi-ents ofUiandVjare
∂L1 ∂Ui¼
Xn j V
T j−Ui
Yijþ 1−Yij
1− 1
1−e−f Uð i;VjÞ
0 @ 1 A 2 4 3 5 ð8Þ
∂L1 ∂Vi¼
Xm i Ui−V
T j
Yijþ 1−Yij
1− 1
1−e−f Uð i;VjÞ
0 @ 1 A 2 4 3 5 ð9Þ
Computation of gene–gene similarities
We utilize the relationships between orthologous genes and diseases of nonhuman species to calculate the gene– gene similarities. Vector space similarity (VSS) and Pear-son correlation coefficient (PCC) [36] is exploited to evaluate the gene–gene similarities. The formula of VSS is
Sig ¼
P
j∈I ið Þ∩I gð Þ Rij⋅Rgj ffiffiffiffiffiffiffiffiffiffiffiffiffiffiffiffiffiffiffiffiffi
P j∈I ið Þ∩I gð Þ q
R2
ij⋅
ffiffiffiffiffiffiffiffiffiffiffiffiffiffiffiffiffiffiffiffiffi P
j∈I ið Þ∩I gð Þ q
R2
f j
ð10Þ
I(g)Z denote the diseases of eight other species related to orthologous gene g, let I(i) represent the diseases of eight other species related to orthologous genei, and we define j as the vertexes that I(i) and I(g) have in com-mon.Sigranges from 0 to 1, measuring the level of similar-ity between geneiand gene g.Rijis defined as the linkage between geneiand disease jof other nonhuman species, where value 1 shows correlation and value 0 shows irrele-vance. The definition ofSigisSig ¼ maxjjI i∈ð ÞjmjI jð Þj⋅Sig.
However, in VSS, some genes in I(i) and I(g) which make a larger contribution to predictions are taken into consideration. Thus, a formula using PCC is defined to deal with this deficiency:
Sig ¼
P
j∈I ið Þ∩I gð Þ Rij−Ri
⋅ Rgj−Rg
ffiffiffiffiffiffiffiffiffiffiffiffiffiffiffiffiffiffiffiffiffi P
j∈I ið Þ∩I gð Þ q
Rij−Ri
2
⋅ ffiffiffiffiffiffiffiffiffiffiffiffiffiffiffiffiffiffiffiffiffiPi∈I ið Þ∩I gð Þ q
Rgj−Rg
2
ð11Þ
Where Ri represents the average value of similarities between geneiand overall nonhuman diseases. We map the value of PCC to [0,1] by using the mapping function
f(x) = (x+ 1)/2. Approximately, let the definition ofSigbe Sig¼ maxjjI i∈ð ÞjmjI jð Þj⋅Sig.
Let S′g denote similarities between human genes and diseases of eight other species, and we acquire S″g from HumanNet. With mapping function, we mapS″g to [0,1]. Ultimately, the definition of gene–gene similarities is Sg¼S′gþω⋅normal S″g
n o
, and weight ω is determined
by the significances of S′g and S″g. In our work, ω is larger than 1, for HumanNet is widely believed to be more reliable on account of using prior information.
ModelI: Probability-based collaborative filtering model with integral regularization
We add more prior information in model I, containing gene–gene relationships and disease–disease similarities. The model I is defined as
maxUi;VjL2ðUi;VjÞ ¼L1ðUi;VjÞ−
α1 2
Xm i Ui−
P
g∈G ið ÞSigUg
P
g∈G ið ÞSig
2
−β1 2
Xn j Vj−
P
d∈D jð ÞSjdVd
P
d∈D jð ÞSjd
2 ð12Þ
In this equation, the neighbor genes of gene i is de-noted as G(i), the neighbor genes of diseasejis denoted as D(j), and α1, β1> 0. Sig∈[0, 1] and Sjd∈[0, 1] repre-sents the similarities between human genes and their neighbor genes.
We add two integral regularizations of human genes and diseases in model I:
α1 2
Xm i Ui−
P
g∈G ið ÞSigUg P
g∈G ið ÞSig 2
ð13Þ
β1 2
Xn j Vj−
P
p∈P jð ÞSjpVp P
p∈P jð ÞSjp 2 ð14Þ
We can see that in Fig. 2, we should minimize the two regularizations to make L2(Ui,Vj) maximal. As such, we
should make genei and disease j close to the center of the Euclidean distance between geneiand its neighbors G(i), as well as between diseasejand its neighbors D(j) and Sjd can be gotten from the published dataset, and the computation ofSigwill be specified hereinbelow.
Model II: Probability-based collaborative filtering model with personal regularization
However, while there are big differences between similarities of genes and diseases respectively, model I may give a erroneous result.
A Probability-based collaborative filtering model with personal regularization called model II is defined to cope with this circumstance, and we define model II as
maxUi;VjL3ðUi;VjÞ ¼L1ðUi;VjÞ−
α2 2
Xm i
X
g∈G ið ÞSigUi−Ug2
−β2 2
Xn j
X
d∈P jð ÞSdtVj−Vd 2
ð15Þ
As shown in Fig. 2. α2, β2> 0, and other parameters can be explained similarly Eq. (10).
Model II can adjust the distance between genes or dis-eases in the latent factor space indirectly. Briefly, if gene gis a neighbor of genei, and genefis a neighbor of gene gin model II, the distance betweenUiandUfin a latent factor space will be minimized indirectly as follows:
SigUi−Ug
2
; SgfUg−Uf
2
This formula will finally realize the convergence, reaching a steady status of the transmission process.
And the formulas updating the gradient for the sto-chastic gradient descent approach are
∂L3 ∂Ui¼
Xn j V
T j−Ui
Yijþ 1−Yij
1− 1
1−e−f Uð i;VjÞ
0 @ 1 A 2 4 3 5
−α2 X
g∈G ið ÞSgt Ui−Ug
ð16Þ
∂L3 ∂Vi¼
Xm i Ui−V
T j
Yijþ 1−Yij
1− 1
1−e−f Uð i;VjÞ
0 @ 1 A 2 4 3 5
−β2 X
p∈P jð ÞSpt Vj−Vp
ð17Þ
Results and discussion
Comparing with state-of-arts methods
As a semi-supervised learning problem, prediction for pathogenic genes meets with a“cold start”problem, and we propose PCFM to solve it. For that gene–disease re-lationship network is very sparse, some human diseases exist with no known associated genes. A threefold cross validation is performed to compare the result of our PCFM approach with other state-of-arts methods: Katz [7] and Catapult [7] that are based on numbers of differ-ent paths, Prince [14] that involves global networks, and ProDiGe [35] that integrate numerous biological datasets.
depends on the number of walks of different lengths from one vertex to another. The formula of Katz is
SKatzHs ð Þ ¼C βPHsþβ2ðGPHsþPHsQHsÞ
þβ3
PPTPHsþG2PHsþGPHsQHsþPHsQ2Hs
ð18Þ
In this equation,PHsandQHsrepresent the gene–gene matrix and disease–disease matrix, and β is a constant which can punish long walks. In this way, gene–disease score can be calculated by Katz method.
Catapult is a method which can learn different weights for paths of different lengths. It try to find out a score for each gene–disease pair, which can be treated as learning coefficients for Katz. As a result of lack of known negative examples, Positive-Unlabeled learning (PU learning) approaches is utilized in this method, to establish a negative set, and gene–disease pairs are clas-sified leveraging a biased support vector machine.
ProDiGe is a novel approach based on support vector machine. It learns from positive and unlabeled examples. In order to get more precise prediction, 21 diverse evi-dences of genes and diseases were used for computing gene–gene similarities.
Prince is a comprehensive approach which based on usage of prior information and formulating constraints on the prioritization function that relate to its smooth-ness over the network.
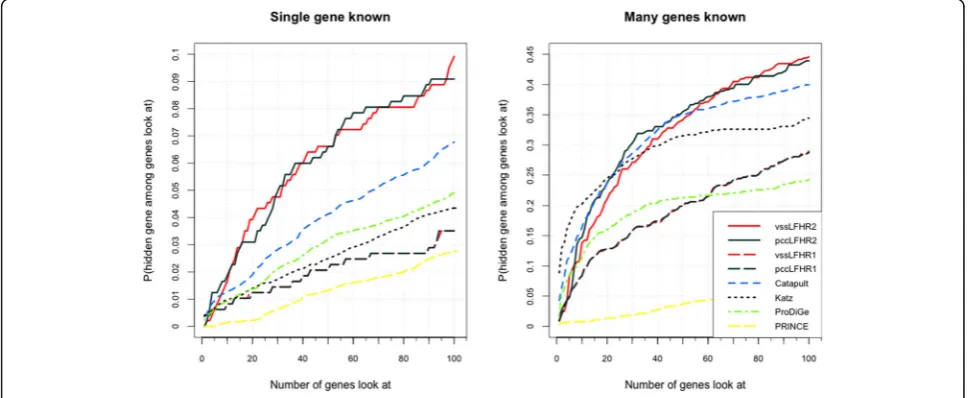
We can see that in Fig. 3, we compare the results of model I and model II with the results of above four state-of-arts approaches. The vertical axis shows the probability that a true gene association is retrieved in the top-k (shown on the horizontal axis) predictions for given disease. In training set, human diseases on the dataset are divided into two parts. One part is associated
with at least one human gene (many known genes), the other part is related to no known genes (single known gene). The dimensionality of latent factor vector is set as D= 10 and the parameters are set as α1 =α2 = 0.5,
β1 =β2 = 0.001 for diseases with many known genes. In Fig. 3, we show the results of two kinds of diseases. The results of Model I (dashed black and dashed red) and model II (solid black and solid red) in PCFM is much better than other advanced approaches.
In Fig. 3, the result of model II is better than the result of Model I, this is likely caused by the lack of distinct groups in genes and diseases. Thus, G. Model II: Probability-based collaborative filtering model with per-sonal regularization can perform better. For the two types of diseases, our method is 4% and 5% more efficient than above advanced methods.
Effect ofaand
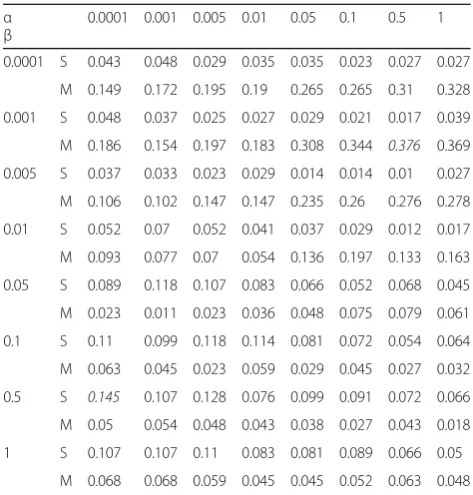
In the PCFM approach,αandβcontrol the significances of gene–gene network and disease–disease network respect-ively. We set diverseα andβfor two types of diseases by using model II. The dimensionality of latent factor vector is set asD= 5 for diseases with single known gene, and is set asD= 30 for diseases with many genes known.
We can see that in Table 1, model II performed better for diseases with many genes known than diseases with single gene known when αis bigger thanβ. And the re-sult is opposite whenβis smaller thanα. If a diseasepis related to certain genes gs(|gs|≥1), the neighbor genes ofgs, which are called Target in Fig. 4, are more likely to be related to disease p. Under the circumstances, disease–disease relationship network is less important than gene–gene relationship network, so bigger αcause better performance. Inversely, for diseases without any associations with human genes, it is tough to detect
related genes. Thus, genes related to neighbor diseases ofpis likely to build a association withp, and bigger will lead to a more outstanding performance.
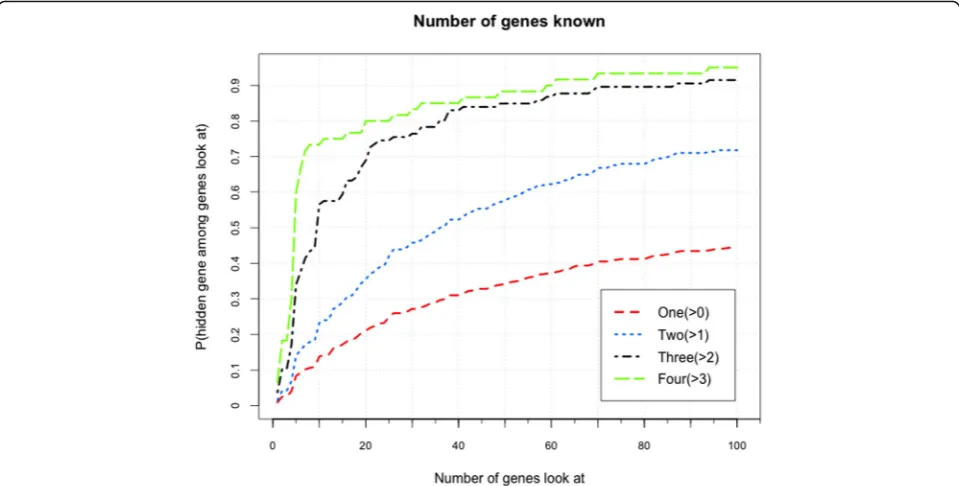
It is assumed that the accuracy of PCFM would be enhanced if a human disease is related to more known genes. Thus, the dimensionality of latent fac-tor vecfac-tor is set as D= 60, and other parameters are set as α1=α2= 0.01, β1=β2= 0.5. We exploit Model II with VSS for prediction of diseases with many known genes. In Fig. 5, we show the performances of diseases with different numbers of several known genes. We can
conclude that more associated known genes would gener-ate a better performance. Particularly, when three or four genes are known to be related to a disease, the predicting accuracy rises extremely fast in the top 10 genes.
Effect of dimensionality D of latent factor vector
The value of dimensionality of the latent factor vector can largely influence the accuracy of the experiment. If the dimensionality is very small, notwithstanding the complexity of calculation is reduced, the model may be underfitting. Thus, poor findings are obtained. By con-trast, if the dimensionality is very large, more time will be spent for calculation, and overfitting of the model may result in poor performance. In our experiment, VSS is used to compute gene–gene similarities. For dis-eases with many known genes, we set α1=α2=0.5 and
β1=β2=0.001; for diseases with single known gene we set
α1=α2=0.05 and β1=β2=0.5. The experimental results are show in Fig. 6. Lower dimensionality is better than higher dimensionality for diseases with single known gene because of insufficient available training data. As such, the model is overfitting and the generalizability is reduced. For diseases with many known genes, the result improves when the dimensionality increases. At D = 80, PCFM is 7% better than Catapult in the top 100 genes. Nevertheless, more time is spent for calculation when dimensionality increases, whereas the accuracy improves gradually. Thus, we should set a suitable value of D to balance the time spent and precision.
Discussion
With the research datasets related to genes and diseases increasing rapidly, a number of calculating strategies, like RWRH and CIPHER, have been developed for pre-diction of gene–disease relationships. Consequently, this
Fig. 4Training process of diseases with single gene known and with many genes known Table 1Effect ofαandβ
α 0.0001 0.001 0.005 0.01 0.05 0.1 0.5 1
β
0.0001 S 0.043 0.048 0.029 0.035 0.035 0.023 0.027 0.027
M 0.149 0.172 0.195 0.19 0.265 0.265 0.31 0.328
0.001 S 0.048 0.037 0.025 0.027 0.029 0.021 0.017 0.039
M 0.186 0.154 0.197 0.183 0.308 0.344 0.376 0.369
0.005 S 0.037 0.033 0.023 0.029 0.014 0.014 0.01 0.027
M 0.106 0.102 0.147 0.147 0.235 0.26 0.276 0.278
0.01 S 0.052 0.07 0.052 0.041 0.037 0.029 0.012 0.017
M 0.093 0.077 0.07 0.054 0.136 0.197 0.133 0.163
0.05 S 0.089 0.118 0.107 0.083 0.066 0.052 0.068 0.045
M 0.023 0.011 0.023 0.036 0.048 0.075 0.079 0.061
0.1 S 0.11 0.099 0.118 0.114 0.081 0.072 0.054 0.064
M 0.063 0.045 0.023 0.059 0.029 0.045 0.027 0.032
0.5 S 0.145 0.107 0.128 0.076 0.099 0.091 0.072 0.066
M 0.05 0.054 0.048 0.043 0.038 0.027 0.043 0.018
1 S 0.107 0.107 0.11 0.083 0.081 0.089 0.066 0.05
M 0.068 0.068 0.059 0.045 0.045 0.052 0.063 0.048
proposed method should be further built up through research on theoretical prediction.
Our study is based on collaborative filtering model, and a probability conversion is defined. Utilizing PCFM, we detected gene–disease relationships, and it is regarded as a semi-supervised learning problem.
Conclusion
Finding out gene–disease relationships is essential for understanding human disease mechanisms. As a result of the lack of negative samples, predicting gene–disease relationships is often regarded as a semi-supervised learning problem, which. Our PCFM approach was pro-posed for prediction of pathogenic human genes and for
getting more precise consequence than other state-of-arts strategies. The problem is changed into a binary classification problem, with consideration that two vertexes would be alike if the Euclidean distance be-tween these vertexes is short in a latent factor space. To leverage comprehensive prior information and get more accurate result, probability conversion is defined in this approach. In this experiment, it is proved that the proposed model is feasible. Accordingly, we can apply PCFM to enhance the efficiency of prediction markedly. In future research, more data resources including gene expression data may be utilized to establish the human gene network and to enhance the precision of prediction.
Acknowledgements
The authors would like to thank Mr. You Li for his valuable support and suggestions in lab during the experiments.
Funding
Publication costs were funded by National Natural Science Foundation of China (no. 61472333, 61772441 and 61272152), Natural Science Foundation of the Higher Education institutions of Fujian Province (no. JZ160400), President Fund of Xiamen University (no. 20720170054), and the European project funded under FP7–FET 612146.
Availability of data and materials
All data generated and analyzed during this study are included in this published article (mentioned in the section“Methods”) and the web sites.
About this supplement
This article has been published as part ofBMC Medical GenomicsVolume 10 Supplement 5, 2017: Selected articles from the IEEE BIBM International Conference on Bioinformatics & Biomedicine (BIBM) 2016: medical genomics. The full contents of the supplement are available online at https://bmcmedgenomics.biomedcentral.com/articles/supplements/ volume-10-supplement-5.
Authors’contributions
XZ wrote the manuscript and coordinated the project. ND performed the experiments. AR revised the manuscript, QZ designed the experiments and gave helpful suggestions. All authors read and approved the final manuscript.
Ethics approval and consent to participate
Not applicable.
Consent for publication
Not applicable.
Competing interests
The authors declare that they have no competing interests.
Publisher’s Note
Springer Nature remains neutral with regard to jurisdictional claims in published maps and institutional affiliations.
Author details
1Department of Computer Science, School of information science and
technology, Xiamen University, Xiamen, China.2Department of Artificial Intelligence, Universidad Politcnica de Madrid (UPM), Madrid, Spain.3School
of Computer Science and Technology, Tianjin University, Tianjin, China.
Published: 28 December 2017
References
1. Giallourakis C, Henson C, Reich M, Xie X, Mootha VK. Disease gene discovery through integrative genomics. Annu Rev Genomics Hum Genet. 2005;6:381–406.
2. Wolfe CJ, Kohane IS, Butte AJ. Systematic survey reveals general applicability of“guilt-by-association”within gene coexpression networks. BMC Bioinform. 2005;6:1.
3. Wu X, Jiang R, Zhang MQ, Li S. Network-based global inference of human disease genes. Mol Syst Biol. 2008;4:189.
4. Köhler S, Bauer S, Horn D, Robinson PN. Walking the interactome for prioritization of candidate disease genes. Am J Hum Genet. 2008;82:949–58. 5. Vanunu O, Magger O, Ruppin E, Shlomi T, Sharan R. Associating genes and
protein complexes with disease via network propagation. PLoS Comput Biol. 2010;6:e1000641.
6. Li Y, Patra JC. Genome-wide inferring gene–phenotype relationship by walking on the heterogeneous network. Bioinformatics. 2010;26:1219–24. 7. Singh-Blom UM, Natarajan N, Tewari A, Woods JO, Dhillon IS, Marcotte EM.
Prediction and validation of gene-disease associations using methods inspired by social network analyses. PLoS One. 2013;8:e58977. 8. Natarajan N, Dhillon IS. Inductive matrix completion for predicting
gene–disease associations. Bioinformatics. 2014;30:i60–8.
9. Piro RM, Cunto FD. Computational approaches to disease-gene prediction: rationale, classification and successes. FEBS J. 2012;279:678–96.
10. Hamosh A, Scott AF, Amberger JS, et al. Online Mendelian inheritance in man (OMIM), a knowledgebase of human genes and genetic disorders. Nucleic Acids Res 2005;33: D514–D517, 2015.
11. Driel MAV, Bruggeman J, Vriend G, Han GB, Leunissen JAM. A text-mining analysis of the human phenome. Eur J Human. 2006;14:535–42. 12. Barabási AL, Gulbahce N, Loscalzo J. "Network medicine: a network-based
approach to human disease." Nature Reviews Genetics 12.1. 2011:56–68. 13. Yu Q, Besenbacher S, Mailund T, Schierup MH. Identifying disease associated
genes by network propagation. BMC Syst Biol. 2014;8(Suppl 1):149–65. 14. Berger B, Peng J, Singh M. "Computational solutions for omics data." Nature
Reviews Genetics 14.5. 2013:333–346.
15. Mcpherson M, Smithlovin L, Cook JM. Birds of a feather: Homophily in social networks. Annu Rev Sociol. 2003;27:415–44.
16. Goldberg D, Nichols D, Oki BM, Terry D. Using collaborative filtering to weave an information tapestry. Commun ACM. 1992;35:61–70. 17. Schafer JB, Dan F, Herlocker J, Sen S. Collaborative filtering recommender
systems. In: The adaptive web, methods and strategies of web personalization; 2007. p. 46–5.
18. Linden G, Smith B, York J. Amazon.Com recommendations: item-to-item collaborative filtering. IEEE Internet Comput. 2003;7:76–80.
19. Su X, Khoshgoftaar TM. A survey of collaborative filtering techniques. Adv Artificial Intellig. 2009;2009. doi:10.1155/2009/421425.
20. Bennett J, Lanning S, Netflix N. The Netflix prize. In: Kdd cup and workshop in conjunction with Kdd; 2009.
21. Koren Y. Factorization meets the neighborhood: a multifaceted collaborative filtering model. In: ACM SIGKDD international conference on knowledge discovery and data mining, Las Vegas, Nevada, Usa, August, 2008, pp. 426-434. 22. Liu F, Hong JL. Use of social network information to enhance collaborative
filtering performance. Expert Syst Appl. 2010;37:4772–8.
23. Ma H, Zhou D, Liu C, Lyu MR, King I. Recommender systems with social regularization. In: Forth international conference on web search and web data mining, WSDM 2011, Hong Kong, China; 2011. p. 287–96.
24. Yang SH, Long B, Smola A, Sadagopan N, Zheng Z, Zha H. Like like alike— joint friendship and interest propagation in social networks. In: International conference on world wide web, WWW 2011, Hyderabad, India, March 28 -April, 2011, pp. 537-546.
25. Koren Y, Bell R, Volinsky C. Matrix factorization techniques for recommender systems. Computer. 2009;42:30–7.
26. Lee I, Blom UM, Wang PI, Shim JE, Marcotte EM. Prioritizing candidate disease genes by network-based boosting of genome-wide association data. Genome Res. 2011;21:1109–21.
27. Remm M, Storm CE, Sonnhammer EL. Automatic clustering of orthologs and in-paralogs from pairwise species comparisons 1. J Mol Biol. 2001;314:1041–1052. 28. KL MG, Park TJ, Woods JO, Cha HJ, Wallingford JB, Marcotte EM. Systematic
discovery of nonobvious human disease models through orthologous phenotypes. Proc Natl Acad Sci. 2010;107:6544–9.
29. Bell RM, Koren Y. Scalable collaborative filtering with jointly derived neighborhood interpolation weights. In: IEEE international conference on data mining; 2007. p. 43–52.
30. Paterek A. Improving regularized singular value decomposition for collaborative filtering. In Proceedings of KDD cup and workshop. 2007:5–8. 31. Takács G, Pilászy I, Németh B, Tikk D. Major components of the gravity
recommendation system. Acm Sigkdd Explorations Newsletter. 2007;9:80–3. 32. Zhou Y, Wilkinson D, Schreiber R, Pan R. Large-scale parallel collaborative
filtering for the Netflix prize. In: Algorithmic Aspects in Information and Management, International Conference, Aaim 2008, Shanghai, China, June 23–25, 2008.Proceedings;2008, pp. 337-348.
33. Hu Y, Koren Y, Volinsky C. Collaborative filtering for implicit feedback datasets. In: Eighth IEEE international conference on data mining; 2008. p. 263–72.
34. Liu B, Dai Y, Li X, Lee WS, Yu PS. Building text classifiers using positive and unlabeled examples. In: Data mining, IEEE international conference on; 2003. p. 179.
35. Mordelet F, Vert JP. ProDiGe: prioritization of disease genes with multitask machine learning from positive and unlabeled examples. Bmc Bioinform. 2011;12:389.