R E S E A R C H
Open Access
Increased adipose tissue expression of TLR8
in obese individuals with or without type-2
diabetes: significance in metabolic
inflammation
Rasheed Ahmad
1*, Shihab Kochumon
1, Reeby Thomas
1, Valerie Atizado
2and Sardar Sindhu
1*Abstract
Background:The innate immune Toll-like receptors (TLRs) 2/4 are important players in chronic low-grade
inflammation called metabolic inflammation in obesity and type-2 diabetes (T2D). While TLR2/4 expression changes associated with metabolic inflammation are known, the adipose tissue expression of endocytic TLR8, which is expressed by all major macrophage subsets, remain unclear. We, therefore, determined the TLR8 mRNA/protein expression in the adipose tissue samples from lean, overweight, and obese individuals with or without T2D.
Methods:Subcutaneous fat biopsy samples were collected from 49 non-diabetic (23 obese, 17 overweight, and nine lean) and 45 T2D (32 obese, ten overweight, and three lean) individuals. TLR8 gene expression was
determined using real-time RT-PCR and TLR8 protein expression was assessed by both immunohistochemistry and confocal microscopy. The changes in TLR8 expression were compared with those of macrophage markers, proinflammatory cytokines/chemokines, and surface TLRs/adapter proteins. The data were analyzed usingt-test/ Mann-WhitneyU-test, Pearson’s correlation, and multiple regression test.
Results:The data show that in obese non-diabetic/T2D individuals, TLR8 gene expression was significantly upregulated as compared with lean individuals which correlated with body mass index (BMI) and body fat percentage in non-diabetic population (P< 0.05). As expected, TLR8 adipose tissue protein expression in non-diabetic/T2D obese individuals was also higher than that of overweight/lean counterparts. In non-non-diabetic/T2D individuals, TLR8 gene expression associated (P< 0.05) with the expression of CD68, CD11c, CD86, and CD163 macrophage markers. Also, in these individuals, TLR8 gene expression correlated positively (P< 0.05) with adipose tissue expression of TNF-α, IL-18, and IL-8 as well as with systemic CRP levels (in non-diabetics). TLR8 expression was also associated with TLR4/TLR2 and MyD88 expression in the adipose tissue.
Conclusions:The elevated adipose tissue expression of TLR8 in obesity/T2D has consensus with inflammatory signatures and may thus represent an immune marker of metabolic inflammation.
Keywords:Adipose tissue, Metabolic inflammation, Obesity, TLR8, Type-2 diabetes
* Correspondence:rasheed.ahmad@dasmaninstitute.org; sardar.sindhu@dasmaninstitute.org
1Immunology & Innovative Cell Therapy Unit, Dasman Diabetes Institute (DDI), Al-Soor Street, P.O. Box 1180, Dasman 15462, Kuwait
Full list of author information is available at the end of the article
© The Author(s). 2016Open AccessThis article is distributed under the terms of the Creative Commons Attribution 4.0 International License (http://creativecommons.org/licenses/by/4.0/), which permits unrestricted use, distribution, and reproduction in any medium, provided you give appropriate credit to the original author(s) and the source, provide a link to the Creative Commons license, and indicate if changes were made. The Creative Commons Public Domain Dedication waiver (http://creativecommons.org/publicdomain/zero/1.0/) applies to the data made available in this article, unless otherwise stated. Ahmadet al. Journal of Inflammation (2016) 13:38
Background
The increasing use of energy-dense foods and overnutri-tion in recent decades has caused the obesity epidemic to escalate to staggering proportions both in young and adult populations worldwide [1]. Obesity is marked by a state of chronic low-grade inflammation, called meta-bolic inflammation, in which circulatory monocytes infil-trate the expanding adipose tissue and are differentiated into the adipose tissue macrophages (ATMs). Macro-phages in lean mice and humans constitute about 5% of the cells in adipose tissue whereas during obesity, they constitute up to 50% of all adipose tissue cells [2]. The increase in macrophage numbers is accompanied by macrophage activation and expression of proinflamma-tory cytokines/chemokines that act by autocrine/para-crine mechanisms and may induce insulin resistance in the peripheral tissues [3]. Tumor necrosis factor (TNF)-α, IL-18, IL-8, and C-reactive protein (CRP) are considered potential risk factors for the development of type-2 diabetes (T2D) and its associated metabolic complications [4, 5].
The pathogen- and nutrient-sensing systems are evolu-tionarily conserved in most species and hence the immu-nometabolic regulation remains strongly integrated. Toll-like receptors (TLRs) play a key role in the initiation of innate immune responses are regarded as the pattern recognition receptors that recognize pathogen-associated molecular patterns expressed by microbial pathogens or danger-associated molecular patterns expressed by cells during conditions like cellular stress or viral infection [6]. The emerging evidence points to the role of TLRs in non-infectious inflammatory conditions such as rheumatoid arthritis, inflammatory bowel disease, asthma, cancer, and obesity [7–13]. TLR signaling, except TLR3, activates mye-loid differentiation factor (MyD)-88 adapter protein which eventually leads to nuclear factor (NF)-κB activation after the macromolecular complex formation including IL1R-associated kinase (IRAK)-1, IRAK-4, tumor necrosis factor-associated factor (TRAF)-6, and IκB kinase complex [14].
TLR8 is associated with sensing of nucleic acids in-cluding single-stranded RNA and short double-stranded RNA that are released within the endosomal compart-ments or by agonists like imidazoquinolines as shown in a mouse model study [15]. Since the TLR8 stimulation was linked to induction of proinflammatory cytokines (TNF-α, IL-1β, IL-6, and IL-12) in peripheral blood mononuclear cells (PBMC), dendritic cells (DCs), and monocytes [16] as well as related with anti-inflammatory IL-10 production [17], we wanted to know if the TLR8 expression was modulated in metabolic disease as has been observed for surface TLRs especially, TLR2 and TLR4. Notably, the changes in the adipose tissue expres-sion of TLR8 in obesity/T2D are not well understood. Herein, we present the data showing increased TLR8
expression in the adipose tissue of obese individuals with or without T2D. We further show that the increased TLR8 expression was concordant with macrophage markers as well as with other inflammatory signatures in the adipose tissue.
Methods
Study population
A total of 49 non-diabetic (27 male and 22 female, aged 25–71 years) and 45 T2D individuals (26 male and 19 female, aged 23–72 years) were recruited in the study through clinics of Dasman Diabetes Institute (DDI), Kuwait. All participants gave written informed consent and the study was approved by DDI ethics committee. Those of age <18 years or with serious lung, kidney, liver, or cardiovascular disease, or the ones with hematologic or immune disorders, pregnancy, malignancy or type-1 diabetes were excluded. The participants were sub-classified based on their body mass index (BMI). The non-diabetic group comprised of nine lean (BMI = 22.47 ± 2.52 kg/m2; 3 male/6 female), 17 overweight (BMI = 28.36 ± 1.10 kg/m2; 11 male/6 female), and 23 obese (BMI = 35.00 ± 3.45 kg/m2; 13 male/10 female) individuals. The T2D group comprised of 3 lean (BMI = 25.47 ± 0.34 kg/m2; 2 male/1 female), 10 overweight (BMI = 27.87 ± 1.70 kg/m2; 6 male/4 female), and 32 obese (BMI = 33.69 ± 2.55 kg/m2; 18 male/14 female) individuals. The comorbidities in non-diabetic individ-uals included milder, early-stage clinical symptoms of hypertension (6), hyperlipidemia (1), coronary artery disease (1), allergy (1), and asthma (2). Similarly, the comorbidities in T2D patients included minor forms of hypertension (18), hyperlipidemia (6), coronary artery disease (2), allergy (2), and asthma (3). The clinico-demographic data of the study participants are summa-rized in Table 1.
Anthropometric and physioclinical measurements
Table 1Patients’characteristics and clinical data (Groups with significant differences are marked by an asterisk; one-way ANOVA)
Parameter Non-diabetic Diabetic
Lean Overweight Obese Lean Overweight Obese
Total number (N) 9 17 23 3 10 32
Male (N) 3 11 13 2 6 18
Female (N) 6 6 10 1 4 14
Age (Yrs.) 25–53 29–71 26–66 48–58 45–59 23–72
Body mass index (kg/m2) 22.47 ± 2.52* 28.36 ± 1.10* 35.00 ± 3.45* 25.47 ± 0.34 27.87 ± 1.70 33.69 ± 2.55 Body fat percentage 27.73 ± 6.09 33.04 ± 4.95 39.09 ± 4.29 32.10 ± 6.22 31.29 ± 6.08 37.33 ± 5.04 Glucose (mmol/L) 4.94 ± 0.72 5.69 ± 1.63 5.24 ± 0.71 5.80 ± 0.42 9.04 ± 2.22 8.71 ± 2.91 Cholesterol (mmol/L) 5.53 ± 1.04 4.87 ± 0.81 5.05 ± 1.14 5.40 ± 2.55 4.91 ± 1.62 5.03 ± 1.23 High-density lipoprotein (mmol/L) 1.70 ± 0.48 1.20 ± 0.19 1.13 ± 0.24 1.14 ± 0.15 1.12 ± 0.40 1.15 ± 0.30 Low-density lipoprotein (mmol/L) 3.53 ± 0.92 3.14 ± 0.74 3.29 ± 1.01 3.70 ± 2.12 2.89 ± 1.37 2.98 ± 1.10 Triglycerides (mmol/L) 0.64 ± 0.25 1.18 ± 0.67 1.44 ± 0.89 1.25 ± 1.25 1.97 ± 0.83 1.89 ± 1.48 HbA1c (%) 5.74 ± 0.49 5.92 ± 1.70 5.68 ± 0.64 6.00 ± 0.28 7.91 ± 1.96 8.27 ± 1.50
Hypertension (N) 0 2 4 0 3 15
Hyperlipidemia (N) 0 0 1 0 2 4
Coronary artery disease (N) 0 0 1 0 1 1
Allergy (N) 0 0 1 0 0 2
Asthma (N) 1 1 0 0 0 3
Therapy Ventolin Nadolol, Zocor, Lipitor, Aspirin
Concor, Lipitor, Aspirin, Diovan, Zyloric
Metfornin, Aspirin Glucophage, Lipitor, Lantus, Zocor, Diovan, NovoRapid, Metformin, Aspirin
NovoRapid, Lantus, Insulin, Aspirin, Concor, Zocor, Mixtard, Tenormin, Glucophage, Metformin, Capoten
Ahmad
et
al.
Journal
of
Inflammati
on
(2016) 13:38
Page
3
of
T L R8 G en e E xp r ess i on ( Fo l d c h a n ge ) Le an Ov
er w
ei g
ht Ob es e 0 1 2 3 4 5
P=0.01
*
P=0.08
N=9
N=17
N=23
Non-Diabetica
B o d y M a s s In d e x (K g /m2)
TLR 8 G e ne E x pr e s s io n (F o ld c h an g e)
1 0 2 0 3 0 4 0 0 2 4 6 8
P=0.01
N=49
r=0.36
TLR 8 G e n e E xp r essi on ( F ol d c ha ng e )1 0 2 0 3 0 4 0 5 0 0
5 1 0 1 5
B o d y F a t P e r c e n t a g e
P=0.02
N=49
r=0.34
b
Non-Diabeticc
Non-DiabeticTLR 8 G e ne E x pr e ssi o n (F o ld c h a ng e ) Le an +O ve r w eig ht Ob es e 0 1 2 3 4 5
N=13
*
P=0.04
N=32
Diabeticd
B o d y M a s s In d e x ( K g /m2)
TLR 8 G en e E xp r essi o n (F o ld ch a n ge )
1 0 2 0 3 0 4 0 0 5 1 0 1 5 2 0
P=0.19
N=45
r=0.20
Diabetice
B o d y F a t P e r c e n ta g e
TLR 8 G e ne E x pr e ss io n ( F o ld c h a n ge )
1 0 2 0 3 0 4 0 5 0 0 5 1 0 1 5 2 0
P=0.54
N=45
r=0.09
Diabeticf
b
n
oi
s
s
er
p
x
E
8
R
L
T
(Non-)
ci
t
e
b
ai
d
Lean adipose tissue Overweight adipose tissue Obese adipose tissue
n
oi
s
s
er
p
x
E
8
R
L
T
(Non-)
ci
t
e
b
ai
d
a
100X 100X 100X
100X 100X 100X
TL
R
8
P
r
o
tei
n
E
x
p
r
es
s
io
n
(I
H
C
St
a
in
in
g
Int
e
n
si
ty)
Le an
Ov er w
eig ht
Ob es
e
0 1 5 0 3 0 0 4 5 0 6 0 0 7 5 0
P=0.005**
P=0.01*
c
N=5
N=5
N=4
B o d y M a s s In d e x (K g /m2)
T
LR
8
Pr
o
te
in
E
xpr
e
ss
ion
(I
H
C
S
ta
in
in
g
In
t
e
n
s
ity
)
2 0 2 5 3 0 3 5 4 0
0 2 0 0 4 0 0 6 0 0 8 0 0
d
r=0.64 P=0.01* N=14
Non-Diabetic Non-Diabetic
Fig. 2(See legend on next page.)
Glycated hemoglobin (HbA1c) was measured by using Variant™ device (BioRad, Hercules, CA, USA). Plasma high sensitivity CRP (hsCRP) levels were measured using ELISA kit (Biovendor, USA). Plasma triglycerides were also measured using commercial kit (Chema Diagnostica, Monsano, Italy). All assays were carried out following instructions as recommended by the manufacturers.
Sample collection
Human adipose tissue samples (~0.5 g) were collected via abdominal subcutaneous fat pad biopsy lateral to the um-bilicus using standard surgical method. The biopsy tissue was further incised into smaller pieces, rinsed in cold PBS, fixed in 4% paraformaldehyde for 24 h and then embedded in paraffin for further use. Adipose tissue samples (~50-100 mg) were also stored at−80 °C in RNAlater until use.
Real-time RT-PCR
Total cellular RNA was purified using RNeasy kit (Qiagen, Valencia, CA., USA) and following the manufacturer’s instructions. Samples (1μg each) were reverse transcribed into cDNA as instructed (High Capacity cDNA Reverse Transcription kit; Applied Biosystems, CA, USA). To perform real-time RT-PCR, cDNA samples (50 ng each) were amplified (40 cycles) using TaqMan® Gene Expres-sion MasterMix (Applied Biosystems, CA, USA) and gene-specific 20× TaqMan gene expression assays as fol-lows: (TLR8) Hs00152972_m1; (CD68) Hs02836816_g1; (CD11c) Hs00174217_m1; (CD86) Hs01567026_m1; (CD 163) Hs00174705_m1; (TNF-α) Hs01113624_g1; (IL-18) Hs01038788_m1; (IL-8) Hs00174103_m1; (TLR2) Hs018 72448_s1; (TLR4) Hs00152939_m1; (MyD88) Hs0157 3837_g1; and (GAPDH) Hs03929097_g1 (Applied Biosys-tems, CA, USA) containing forward and reverse primers and target-specific TaqMan® MGB probe labeled with FAM dye at the 5’end and NFQ-MGB at the 3’end of the probe using 7500 Fast Real-Time PCR System (Applied Biosystems, CA, USA). Each cycle involved denaturation (15 s at 95 °C), annealing/extension (1 min at 60 °C) after UDG (2 min at 50 °C) and AmpliTaq gold enzyme (10 min at 95 °C) activation. The amplified GAPDH expression was used as internal control to normalize in-dividual sample differences. TLR8 gene expression level relative to control (lean adipose tissue) was calculated
using 2-ΔΔCt method and the relative mRNA expression was expressed as fold expression over the average control gene expression taken as one.
Immunohistochemistry
Paraffin-embedded adipose tissue sections (4 μm) were deparaffinized in xylene and rehydrated through descending grades (100, 95 and 75%) of ethanol to water. Antigen was retrieved from samples by boiling in retrieval solution (pH6.0; Dako, Glostrup, Denmark) for 8 min in pressure cooker followed by cooling for 15 min. After PBS washing and blocking in 3% H2O2for 30 min, 5% nonfat milk for 1 h, and 1% BSA solution for 1 h, samples were treated overnight at room temperature with primary antibody (1:800 diluted anti-human TLR8 mouse monoclonal antibody; Abcam® ab85859). After two washes with PBS-0.5% Tween, samples were treated for 1 h with HRP-conjugated goat anti-mouse secondary antibody (EnVision™Kit, Dako, Glostrup, Denmark) and color was developed using 3,3’-diaminobenzidine (DAB) substrate. Specimens were washed in running tap water, coun-terstained with Harris hematoxylin, dehydrated through ascending grades (75, 95, and 100%) of ethanol, cleared in xylene, and mounted in dibutyl phthalate xylene (DPX). For quantitative analysis of TLR8 protein expression, the entire adipose tissue sections (100×; Panoramic Scan, 3D-HISTECH, Hungary) were used to quantify immunohisto-chemical staining in all subdivided sample regions that were outlined using Aperio ImageScope software (Aperio Vista, CA, USA). On average, 700 cells per sample were counted excluding the connective tissue and blood vessels. Aperio-positive pixel count algorithm (version 9) was used for quantitative analysis of TLR8 immunostaining in the re-gions sampled. The number of positive pixels was normal-ized to the number of total (positive and negative) pixels to account for variations in the size of the region sampled. Color and intensity thresholds were established to detect the specific immunostaining as positive and the background staining as negative pixels. Once the conditions were set, all slides were analyzed using same parameters.
Confocal microscopy
Formalin-fixed paraffin-embedded adipose tissue sec-tions (8 μm) were immunolabeled as described before. (See figure on previous page.)
Body M ass Index (Kg/m2)
TL
R
8
P
r
o
t
ei
n
Ex
pr
e
s
s
io
n
(
IHC
S
t
ai
ni
ng
In
t
e
n
s
it
y
)
20 25 30 35 40
0 400 800 1200
Lean adipose tissue Overweight adipose tissue Obese adipose tissue
n
oi
s
s
er
p
x
E
8
R
L
T
)
ci
t
e
b
ai
D(
a
100X 100X 100X100X 100X
100X
b
n
oi
s
s
er
p
x
E
8
R
L
T
)
ci
t
e
b
ai
D(
P=0.0001***
P=0.003**
N=3
N=5 N=5
c
d
Diabetic
r=0.87 P<0.0001*** N=13
Diabetic
T
L
R
8
P
r
ot
e
in
E
xpr
e
ss
io
n
(IH
C
S
ta
in
in
g
In
te
n
s
ity
)
Le an
Ov er w
eig ht
Ob es
e 0
2 0 0 4 0 0 6 0 0 8 0 0 1 0 0 0
Fig. 3(See legend on next page.)
Following antigen retrieval and blocking, samples were treated overnight at room temperature with primary antibody (1:100 diluted anti-TLR8 monoclonal antibody; abcam® ab85859). After two washes with PBS-0.05% Tween, samples were incubated for 1 h with secondary antibody (1:200 diluted goat anti-mouse Alexa Fluor® 647-conjugated antibody; Abcam® ab150115) and washed three times in PBS. Samples were counterstained with 4’ ,6-diamidino- 2-phenylindole (DAPI) (Vectashield, Vector Laboratories, H-1500) and mounted. For image processing and analysis, confocal images were collected (Inverted Zeiss LSM710 spectral confocal microscope, Carl Zeiss, Gottingen, Germany) using EC Plan-Neofluar 40×/1.30 oil DIC M27 objective lens. Samples were excited using a 488 nm diode-pumped solid-state laser and the 405 nm line of an argon ion laser. After laser excitation, optimized emission detection bandwidths were configured using Zeiss Zen 2010 control software.
Statistical analysis
Data were expressed as mean ± SEM values unless other-wise indicated and statistical analysis was performed using GraphPad Prism software (La Jolla, CA, USA) and SPSS for Windows version 19.01 (IBM SPSS Inc. USA). Unpaired Studentt-test and Mann-Whitney U-test were used to compare group means. Correlation and stepwise multiple regression were performed to determine associ-ations between different variables. One-way ANOVA was used to identify groups that had significant differ-ences. AllP-values <0.05 were considered significant.
Results
Increased adipose tissue TLR8 gene expression in diabetic/non-diabetic obese individuals
Whereas the changes in TLR2/TLR4 expression in the adipose tissue are regarded as important actors in meta-bolic inflammation, the changes in the adipose tissue expression of endocytic TLR8 in obesity/T2D remain unclear. To this end, we found that in non-diabetic indi-viduals, TLR8 mRNA expression in the adipose tissue was significantly upregulated in obese as compared with lean counterparts (P= 0.01) (Fig. 1a) and this increase correlated positively with phenotypes of corpulence, such as BMI (r= 0.36, P= 0.01) (Fig. 1b) and body fat
percentage (r= 0.34, P= 0.02) (Fig. 1c). The adipose tis-sue TLR8 mRNA expression was also found to be higher in obese T2D patients as compared with lean/overweight population (P= 0.04) (Fig. 1d). The expression of TLR8 in the diabetic cohort did not associate with parameters of corpulence including BMI (r= 0.19, P= 0.19) (Fig. 1e) and body fat percentage (r= 0.09,P= 0.54) (Fig. 1f ) and, instead, it showed an association with the metabolic parameters including glycemia and glycated hemoglobin (HbA1c) levels. (Additional file 1).
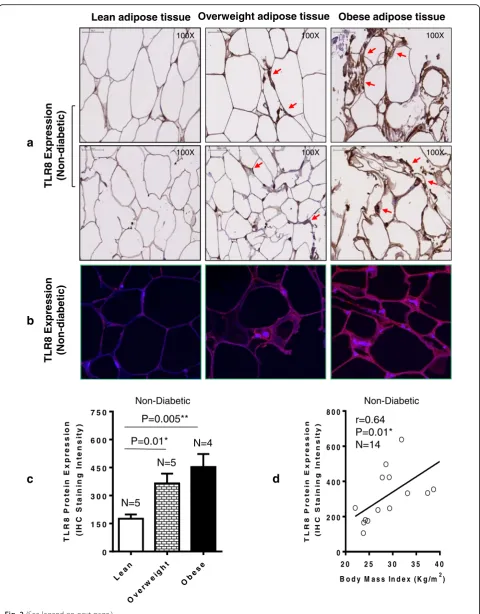
Elevated adipose tissue TLR8 protein expression in obesity
We further asked whether the TLR8 protein expression was also elevated in the adipose tissue in obesity. As expected, we found that the adipose tissue TLR8 protein expression in 14 non-diabetic individuals as analyzed by immunohistochemistry (shown for two individuals per group; Fig. 2a) and confirmed by confocal microscopy (shown for one individual in each group; Fig. 2b) was significantly elevated in both obese (P= 0.005) and overweight (P= 0.01) subjects as compared with lean controls (Fig. 2c). The elevated TLR8 protein expression in this cohort was also found to correlate with BMI (r= 0.64, P= 0.01) (Fig. 2d). Similarly in 13 T2D indi-viduals, the adipose tissue TLR8 protein expression determined by immunohistochemistry (shown for two in-dividuals per group; Fig. 3a) and confirmed by confocal microscopy (shown for one individual in each group; Fig. 3b) was found to be elevated in obese (P= 0.0001) and overweight (P= 0.003) as compared with lean coun-terparts (Fig. 3c); and TLR8 protein expression associated with BMI in diabetic cohort (r= 0.87,P< 0.0001) (Fig. 3d). As shown in Additional file 2, overall, a highly significant positive correlation was found between gene and protein expression of TLR8 (r= 0.86,P< 0.0001).
TLR8 gene expression correlates with monocyte/ macrophage markers in the adipose tissue
We next asked if the increased TLR8 mRNA expression in the adipose tissue was concordant with a local inflam-matory profile marked by an increased expression of monocyte/macrophage markers. In this regard, we found that in non-diabetic individuals, the adipose tissue TLR8 (See figure on previous page.)
T L R 8 G e n e E x p r e s s io n ( F o ld c h a n g e )
C D 163 G en e E xp r e ssi on (F ol dc h a n ge )
0 5 1 0 1 5 2 0
0 2 4 6 8
T L R 8 G e n e E x p r e s s i o n ( F o l d c h a n g e )
C D 6 8G e n e E x pr es s i on (F o ld c h a n ge )
0 5 1 0 1 5
0 2 4 6 8 1 0 T L R 8 G e n e E x p r e s s i o n
( F o l d c h a n g e )
CD6 8 G e n e E x p r e s s i o n (F ol d c ha n ge )
0 2 4 6 8
0 4 8 1 2 Non-Diabetic Diabetic
a
P<0.0001 N=45 r=0.72 T L R 8 G e n e E x p r e s s i o n( F o l d c h a n g e )
C D 1 1 cG e n eE xp r essi o n (F o l d c ha ng e )
0 2 4 6 8
0 5 1 0 1 5 2 0 2 5
T L R 8 G e n e E x p r e s s i o n ( F o l d c h a n g e )
CD 8 6G e n eE x p re s s i o n ( Fo l d c h a n ge )
0 2 4 6 8
0 2 4 6 8 1 0
T L R 8 G e n e E x p r e s s i o n ( F o l d c h a n g e )
C D 163 G en e E xp r essi o n (F o l dc h a n g e )
0 2 4 6 8
0 2 4 6 8
b
c
d
Non-Diabetic Non-Diabetic Non-DiabeticT L R 8 G e n e E x p r e s s i o n ( F o l d c h a n g e )
CD1 1 cG e n eE x p r essi o n (F o l d c ha ng e )
0 5 1 0 1 5
0 5 1 0 1 5 2 0 2 5 3 0
3 5 Diabetic
T L R 8 G e n e E x p r e s s i o n ( F o l d c h a n g e )
CD 8 6G e n eE x p r e s si o n (F ol d c ha ng e )
0 5 1 0 1 5
0 2 4 6 8 1 0
e
f
g
Diabetich
DiabeticP<0.0001 N=49 r=0.60 P<0.0001 N=49 r=0.61 P<0.0001 N=49 r=0.75 P=0.0001 N=49 r=0.52 P<0.0001 N=45 r=0.61 P=0.0002 N=45 r=0.52 P<0.0001 N=45 r=0.77
Fig. 4(See legend on next page.)
gene expression correlated positively with the gene ex-pression of CD68 (r= 0.60,P< 0.0001) (Fig. 4a), CD11c (r= 0.61, P< 0.0001) (Fig. 4b), CD86 (r= 0.75,P< 0.0001) (Fig. 4c), and CD163 (r= 0.52, P= 0.0001) (Fig. 4d). Also in T2D patients, TLR8 gene expression correlated po-sitively with CD68 (r= 0.61, P< 0.0001) (Fig. 4e), CD11c (r= 0.52, P= 0.0002) (Fig. 4f), CD86 (r= 0.77, P< 0.0001) (Fig. 4g), and CD163 (r= 0.72,P< 0.0001) (Fig. 4h). While analyzing in a total population of 94 individuals (49 non-diabetic and 45 non-diabetic), the adipose tissue expression of macrophage markers CD68, CD86, and CD163 associated positively with BMI (P< 0.05) (Additional file 3); however, CD11c did not associate with BMI (r= 0.12, P= 0.21) (data not shown).
Increased TLR8 gene expression in obese adipose tissue associates with an inflammatory profile
We further wanted to know if the elevated TLR-8 gene expression in obese adipose tissues was in agreement with the increased expression of inflammatory cyto-kines/chemokines and related markers. To this end, we found that in non-diabetic persons, the adipose tissue TLR8 mRNA expression associated positively with gene expression of TNF-α (r= 0.45,P= 0.001) (Fig. 5a), IL-18 (r= 0.29, P= 0.04) (Fig. 5b), IL-8 (r= 0.46, P= 0.001) (Fig. 5c), and plasma CRP levels (r= 0.36, P= 0.02) (Fig. 5d). In T2D patients, TLR8 gene expression co-rrelated with TNF-α (r= 0.31, P= 0.04) (Fig. 5e), IL-18 (r= 0.53,P= 0.0001) (Fig. 5f), and IL-8 (r= 0.47,P= 0.001) (Fig. 5g); whereas, no correlation was found with plasma CRP levels (r=−0.04,P= 0.81) (Fig. 5h).
TLR8 expression in the adipose tissue is linked with TLR2/ TLR4 and MyD88 expression
The innate immune TLRs have potential to play direct or indirect roles in obesity- or T2D-associated metabolic inflammation and, therefore, we asked whether the adi-pose tissue TLR8 gene expression was linked with the expression of other immunometabolic TLRs such as TR2 and TLR4 as well as with downstream MyD88 adapter protein. To this effect, we found that TLR8 gene expression in non-diabetic individuals was positively as-sociated with the adipose tissue gene expression of TLR2 (r= 0.55,P< 0.0001) (Fig. 6a), TLR4 (r= 0.28, approaching the level of statistical significance withP= 0.06) (Fig. 6b), and MyD88 (r= 0.55, P< 0.0001) (Fig. 6c). Similarly, in
T2D patients as well, TLR8 gene expression was associ-ated with that of TLR2 (r= 0.76, P< 0.0001) (Fig. 6d), TLR4 (r= 0.66, P< 0.0001) (Fig. 6e), and MyD88 expres-sion (r= 0.52,P= 0.0002) (Fig. 6f).
Additionally, within-group correlations of the TLR8 gene expression with other inflammatory markers in the adipose tissue were also determined and the data are summarized in Additional file 4.
Discussion
The emerging evidence supports that immune and meta-bolic systems are tightly integrated and the innate im-mune TLRs can be directly or indirectly activated by overnutrition leading to metabolic inflammation. Re-garding the adipose tissue changes in TLR8 expression in obesity/T2D, our data show that in non-diabetic obese individuals, the upregulated TLR8 mRNA ex-pression correlated with corpulence-related phenotypes including BMI and body fat percentage. However, the altered TLR8 expression did not associate with corpu-lence phenotypes in T2D individuals that happen to be more heterogeneous due to presence of dyslipidemia and related complications. Instead, TLR8 gene expres-sion in this cohort was associated with metabolic traits e.g. glycemia and HbA1c levels. It is not clear whether hyperglycemia could upregulate TLR8 expression, and a few studies both in humans and mice have shown the link between hyperglycemia and TLR2/4 induction and upregulation [18, 19]. Our data also show elevated TLR8 protein expression in the adipose tissue in obesity with/ without T2D and, notably, a good agreement (r= 0.86,
P< 0.0001) was found between gene and protein ex-pression of TLR8. Although, the global exex-pression of TLR8 detected in the adipose tissue may relate to a variety of cells present in this compartment, it is mainly expressed by monocytes/macrophages, mast cells, and myeloid den-dritic cells [20]. The increased TLR8 expression detected by immunohistochemical staining was found on in-flammatory cell aggregates that were visible as crown like structures (CLS) surrounding the degenerating adipocytes in obese adipose tissue samples (arrow heads point to CLS).
Next, we found that the increased TLR8 gene expres-sion in the adipose tissues in obesity/T2D paralleled with enhanced expression of monocyte/macrophage markers such as CD68, CD11c, CD86, and CD163. The (See figure on previous page.)
Fig. 4TLR8 gene expression in the adipose tissue of non-diabetic/diabetic individuals correlates with monocyte/macrophage markers. The adipose tissue gene expression of TLR8 and monocyte/macrophage markers (CD68, CD11c, CD86, and CD163) in 49 non-diabetic (ND) and 45 type-2 diabetic (T2D) individuals was determined by using quantitative real-time RT-PCR as described in Methods. The representative data from three independent determinations show that TLR8 gene expression correlated positively/significantly with the local expression of (a) CD68[ND](r= 0.60,P< 0.0001);
(b) CD11c[ND](r= 0.61,P< 0.0001); (c) CD86[ND](r= 0.75,P< 0.0001); (d) CD163[ND](r= 0.52,P= 0.0001); (e) CD68[T2D](r= 0.61,P< 0.0001); (f)
a
b
c
d
e
f
g
h
Fig. 5(See legend on next page.)
CD68, CD11c, and CD86 are markers of inflammatory or M1-type macrophages and CD163 is a hemoglobin-haptoglobin scavenger receptor. We found that the adi-pose tissue expression of these markers was associated with corpulence phenotype i.e. BMI which meant that obesity could be a positive modulator of monocyte/macro-phage influx into the adipose tissue which is known to se-crete chemotactic adipokines including CC-chemokine ligand (CCL)-2 or macrophage chemoattractant protein
(MCP)-1 as shown earlier by a diet-induced obesity study in mice [21]. Our data showing elevated macrophage markers expression in the adipose tissue in obesity/T2D are corroborated, at least in part, by other studies as well [2, 22, 23]. Of note, Devevre et al. reported three distinct monocytic populations in human obesity named as clas-sical, intermediate, and non-classical monocytes while a 2–4 fold increased expression of TLR4/TLR8 was found in all three subsets [24]. These observations partially (See figure on previous page.)
Fig. 5Increased adipose tissue TLR8 gene expression correlates with typical inflammatory markers. The adipose tissue gene expression of TLR8 and signature inflammatory cytokines/chemokines (TNF-α, IL-18, and IL-8) was determined in 49 non-diabetic (ND) and 45 type-2 diabetic (T2D) individuals using quantitative real-time RT-PCR while plasma high-sensitivity C-reactive protein (CRP) levels were determined using commercial ELISA kit and following the manufacturer’s recommendations. The representative data from two independent determinations show that TLR8 mRNA expression was associated with the expression of (a) TNF-α[ND](r= 0.45,P= 0.001); (b) IL-18[ND](r= 0.29,P= 0.04); (c) IL-8[ND](r= 0.46,P= 0.001);
(d) Plasma CRP[ND](r= 0.36,P= 0.02); (e) TNF-α[T2D](r= 0.31,P= 0.04); (f) IL-18[T2D](r= 0.53,P= 0.0001); and (g) IL-8[T2D](r= 0.47,P= 0.001). (h) TLR8
gene expression in T2D patients did not correlate with plasma CRP levels (r=−0.04,P= 0.81). Due to missing plasma samples, TLR8 correlation with plasma CRP levels is shown for 38 ND and 32 T2D individuals
T L R 8 G e n e E x p r e s s i o n ( F o l d c h a n g e )
T L R 2G e n eE x p r e s s io n (F o ld c h a n g e )
0 5 1 0 1 5
0 2 4 6 8 1 0
T L R 8 G e n e E x p r e s s i o n
( F o l d c h a n g e )
M y D 8 8 G en e e xp r e ss io n (F ol d c h a n ge )
0 5 1 0 1 5
0 1 2 3 4
T L R 8 G e n e E x p r e s s i o n ( F o l d c h a n g e )
TLR 4 Ge n e Ex p r e ss ion (F o ld c h a n g e )
0 5 1 0 1 5
0 1 2 3 4
T L R 8 G e n e E x p r e s s i o n ( F o l d c h a n g e )
My D 8 8 G e n e e x pr e s s io n (F ol d c h an g e )
0 5 1 0 1 5
0 1 2 3 4
T L R 8 G e n e E x p r e s s i o n ( F o l d c h a n g e )
TL R 2G e n eE x p re s si on (F o ld c ha ng e )
0 5 1 0 1 5
0 2 4 6 8 1 0 Non-Diabetic P<0.0001 N=49 r=0.55
T L R 8 G e n e E x p r e s s i o n
( F o l d c h a n g e )
TLR 4 G e n e E xp r e ssi o n (F ol dc h a ng e )
0 5 1 0 1 5
0 1 2 3 4 Non-Diabetic P=0.06 N=49 r=0.28 Non-Diabetic Diabetic P<0.0001 N=49 r=0.55 Diabetic P<0.0001 N=45 r=0.76 Diabetic P<0.0001 N=44 r=0.66 P=0.0002 N=45 r=0.52
a
b
c
d
e
f
support our data showing enhanced TLR8 expression in the obese adipose tissue.
We also found that TLR8 gene expression was positively associated with inflammatory cytokines/chemokine ex-pression in the adipose tissue as well as with circulatory levels of inflammatory biomarker CRP. The white adipose tissue is a site for excessive energy storage and active bio-synthesis of adipokines that act via autocrine/paracrine mechanisms in adipocyte-macrophage crosstalk to amplify the local and systemic inflammatory responses in obesity/ T2D [25]. The proinflammatory cytokines TNF-αand IL-18 are known to be elevated in obesity/T2D [26, 27] while IL-8 or CXC chemokine ligand (CXCL)-8 is an inflam-matory protein and increased circulatory numbers of IL8-expressing monocytes were also reported in human obesity [24]. CRP is a typical systemic inflammatory marker and its increased levels were linked with obesity, blood pressure, and hyperlipidemia [28]. The proinflam-matory bioactive proteins TNF-α, IL-18, and IL-8 are intertwined through cross-regulatory mechanisms. TNF-α was found to regulate IL-8 in human adipose tissue [29] and IL-18 in human adipocytes [30] whereas, IL-18 in-duced IL-8 and IL-1β in human monocytes in a TNFα -dependent mechanism [31]. Our data showing increased TNF-α, IL-18, and IL-8 expression in obesity are in agree-ment with studies showing induction of these proinflam-matory proteins in obese humans [32, 33]. Our data further show an association between these inflammatory adipokines and TLR8 expression in the adipose tissue; however, CRP levels in T2D individuals did not correlate with TLR8 gene expression and we speculate that this discrepancy may be due to T2D-associated comorbid fac-tors such as liver dysfunction, central adiposity, hypergly-cemia, and insulin resistance. This line of argument is supported by the observation that studies on plasma CRP levels in T2D patients show heterogeneity in their findings [34, 35]. Also, we cannot rule out plausible effects of anti-diabetic pharmacologic interventions on systemic levels of CRP [36]. Multiple stepwise linear regression analysis of our data revealed that CD11c, CD86, and IL-8 independ-ently predicted TLR8 gene expression in the non-diabetic while CD11c predicted TLR8 gene expression in the diabetic subjects. Additionally, analysis of the within-group associations of TLR8 gene expression with other inflammatory markers in the adipose tissue indicates that obesity- and T2D-associated inflammatory changes in-cluding macrophage infiltration, upregulated expression of proinflammatory cytokines/chemokines, increased surface TLRs (TLR2/4) and downstream adapter protein MyD88 may be linked, at different levels, to the induction/upregu-lation of TLR8 in the adipose tissue.
The altered TLR expression observed in metabolic disease conditions is likely to have pathological co-nsequences. We show that TLR8 gene expression was
positively associated with TLR2, TLR4, and MyD88 expression in the adipose tissue. The upregulation of TLRs and inflammatory cytokine production have been also reported by previous studies in humans [13, 37]. TLR2/4 bind to free fatty acids in addition to other known ligands and MyD88 is a downstream adapter protein which is involved in TLR-mediated signaling except TLR3 [38]. While several studies point to a link between TLR upregulation and metabolic inflammation [13, 37, 39], our data add the adipose tissue changes in endocytic TLR8 as an immune marker to the growing list of novel correlates of metabolic inflammation. Hu-man TLR8 is a part of the nucleic acid-sensing TLRs that recognize viral ss/ds RNAs [40] and bacterial RNA [41]; however, TLR8 agonist(s) associated with obesity/ T2D are still not known. Therefore, TLR8 expression changes need to be further investigated with regard to putative agonists like cellular RNAs and alarmins (e.g. HMGB1) which are known to be released during lipolysis in morbid obesity [42]. Besides, the present study is also limited by certain factors as follows: (1) small cohort size for each BMI group; (2) the lack of data expressing func-tional changes in relation to altered TLR8 expression in the adipose tissue; and (3) the data represent TLR8 global changes in the adipose tissue in obesity/T2D and hence selective expression of TLR8 in adipocytes and macro-phages remains unknown.
Conclusions
Taken together, the present data show significantly ele-vated TLR8 mRNA and protein expression in the adipose tissue in obesity/T2D. Based on consensus with other inflammatory markers, TLR8 expression changes in the obese adipose tissue may represent a novel molecular signature of metabolic inflammation.
Additional files
Additional file 1:Correlation between TLR8 gene expression in the adipose tissue and glycemia/HbA1c levels. The adipose tissue TLR8 gene expression in 45 type-2 diabetic individuals (32 obese, 10 overweight, and three lean) was determined by quantitative real-time RT-PCR and fasting blood glucose (mmol/L) and glycated hemoglobin (HbA1c) (%) levels were determined using commercial kits as recommended by the manufacturers. The data show that TLR8 gene expression correlated positively with (A) glycemia (r= 0.31,P= 0.04) and (B) HbA1c levels (r= 0.34, P= 0.02). (PDF 15 kb)
Additional file 2:Correlation between TLR8 gene and protein expression in the adipose tissue. The adipose tissue TLR8 gene and protein expression was determined in 21 individuals (15 non-diabetic and 6 diabetic) classified as five lean, eight overweight and eight obese by using quantitative real-time RT-PCR and immunohistochemistry, respectively. TLR8 relative mRNA expression was measured as fold change over the average of control gene expression assumed as one. TLR8 protein expression was mea-sured as staining intensity which was quantified using Aperio-positive pixel count algorithm (version 9). The number of positive pixels was normalized to the number of total (positive and negative) pixels to account for variations in the size of the regions sampled. Color and intensity thresholds were
established to detect the immunostaining as positive and background staining as negative pixels. The positive correlation between TLR8 gene and protein ex-pression was found to be highly significant (r= 0.86,P< 0.0001). (PDF 8 kb) Additional file 3:Correlation between macrophage markers expression in the adipose tissue and body mass index. The adipose tissue gene expression of various monocyte/macrophage markers including CD68, CD86, and CD163 in 94 individuals (49 non-diabetic and 45 type-2 dia-betic) was determined by using quantitative real-time RT-PCR as described in Methods. The data show significant positive associations between body mass index (BMI) and adipose tissue gene expression of (A) CD68 (r= 0.26, P= 0.007), (B) CD86 (r= 0.20,P= 0.04), and (C) CD163 (r= 0.27,P= 0.005) macrophage markers. (PDF 115 kb)
Additional file 4:Within-group correlations of TLR8 expression with other inflammatory markers in the adipose tissue. (DOCX 22 kb)
Abbreviations
ATMs:Adipose tissue macrophages; BMI: Body mass index; CCL-2: CC chemokine ligand-2; CLS: Crown-like structures; CRP: C-reactive protein; CXCL-8: CXC chemokine ligand-8; DAB: 3,3’-Diaminobenzidine; DAPI: 4’,6-Diamidino- 2-phenylindole; DCs: Dendritic cells; DPX: Dibutyl phthalate xylene; HbA1c: Glycated hemoglobin; hsCRP: High-sensitivity CRP; IRAK: IL-1R-associated kinase; MCP-1: Macrophage chemoattractant protein-1; MyD88: Myeloid differentiation factor-88; NFκB: Nuclear factor kappa B; T2D: Type-2 diabetes; TLRs: Toll-like receptors; TNF-α: Tumor necrosis factor-alpha; TRAF: Tumor necrosis factor-associated factor
Acknowledgments
We are grateful to Drs. Eman Al Shawaf and Hossein Arefanian from platelet islet biology and transplantation unit for help with confocal microscopy and Sriraman Devarajan from tissue bank unit for assistance with multiple regression analysis of the data.
Funding
This study was supported by Kuwait Foundation for Advancement of Sciences (KFAS) (Grant #: RA2010-003).
Availability of data and material
The following‘Additional data files’(supplementary material) are included.
Authors’contributions
SS planned experiments, analyzed and interpreted the data, prepared graphs, edited and wrote the manuscript, SP, RT, and VA performed experiments, collected and analyzed the data; KB reviewed and critically commented on manuscript, and RA conceived the idea, guided research study, provided material support, procured funds, edited and approved the manuscript for submission. All authors have read and approved the final manuscript.
Competing interests
The authors declare that there is no conflict of interest involved.
Consent for publication
We, the authors are responsible for the submission of this article and we accept the conditions of submission and the BioMed Central Copyright and License Agreement as described in the Journal of Inflammation policy.
Ethical approval and consent to participate
This study was approved by the ethics research committee of Dasman Diabetes Institute and all participants gave written informed consent for participation in the study.
Author details
1Immunology & Innovative Cell Therapy Unit, Dasman Diabetes Institute (DDI), Al-Soor Street, P.O. Box 1180, Dasman 15462, Kuwait.2Tissue Bank Core Facility, Dasman Diabetes Institute (DDI), Al-Soor Street, P.O. Box 1180, Dasman 15462, Kuwait.
Received: 14 June 2016 Accepted: 5 December 2016
References
1. Ng M, Fleming T, Robinson M, Thomson B, Graetz N, Margono C, et al. Global, regional, and national prevalence of overweight and obesity in children and adults during 1980–2013: a systematic analysis for the global burden of disease study 2013. Lancet. 2014;384:766–81.
2. Weisberg SP, McCann D, Desai M, Rosenbaum M, Leibel RL, Ferrante Jr AW. Obesity is associated with macrophage accumulation in adipose tissue. J Clin Invest. 2003;112:1796–808.
3. Gutierrez DA, Puglisi MJ, Hasty AH. Impact of increased adipose tissue mass on inflammation, insulin resistance, and dyslipidemia. Curr Diab Rep. 2009;9:26–32.
4. Nakamura A, Shikata K, Hiramatsu M, Nakatou T, Kitamura T, Wada J, et al. Serum interleukin-18 levels are associated with nephropathy and atherosclerosis in Japanese patients with type 2 diabetes. Diabetes Care. 2005;28:2890–5.
5. Esser N, Legrand-Poels S, Piette J, Scheen AJ, Paquot N. Inflammation as a link between obesity, metabolic syndrome and type 2 diabetes. Diabetes Res Clin Pract. 2014;105:141–50.
6. Akira S, Uematsu S, Takeuchi O. Pathogen recognition and innate immunity. Cell. 2006;124:783–801.
7. Iwahashi M, Yamamura M, Aita T, Okamoto A, Ueno A, Ogawa N, et al. Expression of toll-like receptor 2 on CD16+ blood monocytes and synovial tissue macrophages in rheumatoid arthritis. Arthritis Rheum. 2004;50:1457–67. 8. Roelofs MF, Joosten LA, Abdollahi-Roodsaz S, van Lieshout AW, Sprong T,
van den Hoogen FH, et al. The expression of toll-like receptors 3 and 7 in rheumatoid arthritis synovium is increased and costimulation of toll-like receptors 3, 4, and 7/8 results in synergistic cytokine production by dendritic cells. Arthritis Rheum. 2005;52:2313–22.
9. Cario E, Podolsky DK. Differential alteration in intestinal epithelial cell expression of toll-like receptor 3 (TLR3) and TLR4 in inflammatory bowel disease. Infect Immun. 2000;68:7010–7.
10. Sabroe I, Whyte MK, Wilson AG, Dower SK, Hubbard R, Hall I. Toll-like receptor (TLR) 4 polymorphisms and COPD. Thorax. 2004;59:81. 11. Rakoff-Nahoum S, Medzhitov R. Toll-like receptors and cancer. Nat Rev
Cancer. 2009;9:57–63.
12. Kim SJ, Choi Y, Choi YH, Park T. Obesity activates toll-like receptor-mediated proinflammatory signaling cascades in the adipose tissue of mice. J Nutr Biochem. 2012;23:113–22.
13. Dasu MR, Devaraj S, Park S, Jialal I. Increased toll-like receptor (TLR) activation and TLR ligands in recently diagnosed type 2 diabetic subjects. Diabetes Care. 2010;33:861–8.
14. Baccala R, Hoebe K, Kono DH, Beutler B, Theofilopoulos AN. TLR-dependent and TLR-independent pathways of type I interferon induction in systemic autoimmunity. Nat Med. 2007;13:543–51.
15. Hemmi H, Kaisho T, Takeuchi O, Sato S, Sanjo H, Hoshino K, et al. Small anti-viral compounds activate immune cells via the TLR7 MyD88-dependent signaling pathway. Nat Immunol. 2002;3:196–200.
16. Gorden KB, Gorski KS, Gibson SJ, Kedl RM, Kieper WC, Qiu X, et al. Synthetic TLR agonists reveal functional differences between human TLR7 and TLR8. J Immunol. 2005;174:1259–68.
17. Ghosh TK, Mickelson DJ, Fink J, Solberg JC, Inglefield JR, Hook D, et al. Toll-like receptor (TLR) 2–9 agonists-induced cytokines and chemokines: I. Comparison with T cell receptor-induced responses. Cell Immunol. 2006; 243:48–57.
18. Dasu MR, Devaraj S, Zhao L, Hwang DH, Jialal I. High glucose induces toll-like receptor expression in human monocytes: mechanism of activation. Diabetes. 2008;57:3090–8.
19. Kaur H, Chien A, Jialal I. Hyperglycemia induces toll like receptor 4 expression and activity in mouse mesangial cells: relevance to diabetic nephropathy. Am J Physiol Renal Physiol. 2012;303:F1145–50.
20. Hornung V, Rothenfusser S, Britsch S, Krug A, Jahrsdorfer B, Giese T, et al. Quantitative expression of toll-like receptor 1–10 mRNA in cellular subsets of human peripheral blood mononuclear cells and sensitivity to CpG oligodeoxynucleotides. J Immunol. 2002;168:4531–7.
21. Lumeng CN, Deyoung SM, Bodzin JL, Saltiel AR. Increased inflammatory properties of adipose tissue macrophages recruited during diet-induced obesity. Diabetes. 2007;56:16–23.
23. Fjeldborg K, Christiansen T, Bennetzen M, JM H, Pedersen SB, Richelsen B. The macrophage-specific serum marker, soluble CD163, is increased in obesity and reduced after dietary-induced weight loss. Obesity. 2013;21:2437–43.
24. Devevre EF, Renovato-Martins M, Clement K, Sautes-Fridman C, Cremer I, Poitou C. Profiling of the three circulating monocyte subpopulations in human obesity. J Immunol. 2015;194:3917–23.
25. Jung UJ, Choi MS. Obesity and its metabolic complications: the role of adipokines and the relationship between obesity, inflammation, insulin resistance, dyslipidemia and nonalcoholic fatty liver disease. Int J Mol Sci. 2014;15:6184–223.
26. Moller DE. Potential role of TNF-alpha in the pathogenesis of insulin resistance and type 2 diabetes. Trends in Endocrinol metab. 2000;11:212–7. 27. Bruun JM, Stallknecht B, Helge JW, Richelsen B. Interleukin-18 in plasma and
adipose tissue: effects of obesity, insulin resistance, and weight loss. Eur J Endocrinol. 2007;157:465–71.
28. Greenfield JR, Samaras K, Jenkins AB, Kelly PJ, Spector TD, Gallimore JR, et al. Obesity is an important determinant of baseline serum C-reactive protein concentration in monozygotic twins, independent of genetic influences. Circulation. 2004;109:3022–8.
29. Bruun JM, Pedersen SB, Richelsen B. Regulation of interleukin 8 production and gene expression in human adipose tissue in vitro. J Clin Endocrinol Metab. 2001;86:1267–73.
30. Wood IS, Wang B, Jenkins JR, Trayhurn P. The pro-inflammatory cytokine IL-18 is expressed in human adipose tissue and strongly upregulated by TNFalpha in human adipocytes. Biochem Biophy Res Commun. 2005; 337:422–9.
31. Puren AJ, Fantuzzi G, Gu Y, Su MS, Dinarello CA. Interleukin-18 (IFNgamma-inducing factor) induces IL-8 and IL-1beta via TNFalpha production from non-CD14+ human blood mononuclear cells. J Clin Invest. 1998;101:711–21. 32. Stepien M, Stepien A, Wlazel RN, Paradowski M, Banach M, Rysz J. Obesity
indices and inflammatory markers in obese non-diabetic normo- and hypertensive patients: a comparative pilot study. Lipids Health Dis. 2014;13:29. 33. Kim CS, Park HS, Kawada T, Kim JH, Lim D, Hubbard NE, et al. Circulating
levels of MCP-1 and IL-8 are elevated in human obese subjects and associated with obesity-related parameters. Int J Obes. 2006;30:1347–55. 34. Lee CC, Adler AI, Sandhu MS, Sharp SJ, Forouhi NG, Erqou S, et al.
Association of C-reactive protein with type 2 diabetes: prospective analysis and meta-analysis. Diabetologia. 2009;52:1040–7.
35. Pradhan AD, Manson JE, Rifai N, Buring JE, Ridker PM. C-reactive protein, interleukin 6, and risk of developing type 2 diabetes mellitus. JAMA. 2001; 286:327–34.
36. Putz DM, Goldner WS, Bar RS, Haynes WG, Sivitz WI. Adiponectin and C-reactive protein in obesity, type 2 diabetes, and monodrug therapy. Metabolism. 2004;53:1454–61.
37. Ahmad R, Al-Mass A, Atizado V, Al-Hubail A, Al-Ghimlas F, Al-Arouj M, et al. Elevated expression of the toll like receptors 2 and 4 in obese individuals: its significance for obesity-induced inflammation. J Inflamm. 2012;9:48. 38. Tsan MF, Gao B. Endogenous ligands of toll-like receptors. J Leukoc Biol.
2004;76:514–9.
39. Ospelt C, Brentano F, Rengel Y, Stanczyk J, Kolling C, Tak PP, et al. Overexpression of toll-like receptors 3 and 4 in synovial tissue from patients with early rheumatoid arthritis: toll-like receptor expression in early and longstanding arthritis. Arthritis Rheum. 2008;58:3684–92.
40. Blasius AL, Beutler B. Intracellular toll-like receptors. Immunity. 2010;32:305–15. 41. Davila S, Hibberd ML, Hari Dass R, Wong HE, Sahiratmadja E, Bonnard C, et
al. Genetic association and expression studies indicate a role of toll-like receptor 8 in pulmonary tuberculosis. PLoS Genet. 2008;4:e1000218. 42. Gunasekaran MK, Viranaicken W, Girard AC, Festy F, Cesari M, Roche R, et al.
Inflammation triggers high mobility group box 1 (HMGB1) secretion in adipose tissue, a potential link to obesity. Cytokine. 2013;64:103–11.
• We accept pre-submission inquiries
• Our selector tool helps you to find the most relevant journal
• We provide round the clock customer support
• Convenient online submission
• Thorough peer review
• Inclusion in PubMed and all major indexing services
• Maximum visibility for your research
Submit your manuscript at www.biomedcentral.com/submit