R E S E A R C H
Open Access
A multi-source domain annotation
pipeline for quantitative metagenomic and
metatranscriptomic functional profiling
Ari Ugarte
1†, Riccardo Vicedomini
1,2†, Juliana Bernardes
1and Alessandra Carbone
1,3*Abstract
Background: Biochemical and regulatory pathways have until recently been thought and modelled within one cell type, one organism and one species. This vision is being dramatically changed by the advent of whole microbiome sequencing studies, revealing the role of symbiotic microbial populations in fundamental biochemical functions. The new landscape we face requires the reconstruction of biochemical and regulatory pathways at the community level in a given environment. In order to understand how environmental factors affect the genetic material and the dynamics of the expression from one environment to another, we want to evaluate the quantity of gene protein sequences or transcripts associated to a given pathway by precisely estimating the abundance of protein domains, their weak presence or absence in environmental samples.
Results: MetaCLADE is a novel profile-based domain annotation pipeline based on a multi-source domain annotation strategy. It applies directly to reads and improves identification of the catalog of functions in microbiomes. MetaCLADE is applied to simulated data and to more than ten metagenomic and metatranscriptomic datasets from different environments where it outperforms InterProScan in the number of annotated domains. It is compared to the state-of-the-art non-profile-based and profile-based methods, UProC and HMM-GRASPx, showing complementary predictions to UProC. A combination of MetaCLADE and UProC improves even further the functional annotation of environmental samples.
Conclusions: Learning about the functional activity of environmental microbial communities is a crucial step to understand microbial interactions and large-scale environmental impact. MetaCLADE has been explicitly designed for metagenomic and metatranscriptomic data and allows for the discovery of patterns in divergent sequences, thanks to its multi-source strategy. MetaCLADE highly improves current domain annotation methods and reaches a fine degree of accuracy in annotation of very different environments such as soil and marine ecosystems, ancient metagenomes and human tissues.
Keywords: Domain annotation, Metagenomic, Metatranscriptomic, Functional annotation, Probabilistic model, Environment, Motif
Background
Ecosystem changes are often correlated with the pres-ence of new communities disturbing their stability by importing new metabolic activities [1–4]. Very often, such communities, their functional behaviour and their
*Correspondence:[email protected]
†Ari Ugarte and Riccardo Vicedomini contributed equally to this work.
1Sorbonne Université, UPMC-Univ P6, CNRS, IBPS, Laboratoire de Biologie Computationnelle et Quantitative - UMR 7238, 4 Place Jussieu, 75005 Paris, France
3Institut Universitaire de France, 75005 Paris, France
Full list of author information is available at the end of the article
mutual interactions are hard to identify and analyse [5–9]. Unraveling their structure and determining what they functionally do is crucial for understanding their metabolic dynamics and activities.
Computational studies improving the detection of the functional preferences of environmental communities are important for gaining insight into ecosystem changes [10–15]. Ideally, they shall quantitatively relate genetic information with environmental factors in order to under-stand how these factors affect the genetic material and the dynamics of the expression from one environment to another, from one community to another. Therefore,
they demand the development of appropriate tools to zoom in metabolic activities and to compare environ-ments in detail being as precise as possible in evaluating the quantity of genetic material (gene protein sequences or transcripts) associated to a given function.
Over the past years, a lot of effort has been devoted to the creation of integrated systems for the computational analysis of metagenomic (MG) and metatranscriptomic (MT) datasets. Several pipelines conducting data pre-processing, assembly, taxonomic characterisation, gene finding, protein-coding gene annotation and pathway reconstruction, such as MinPath [16], ShotgunFunc-tionalizeR [17], CAMERA [18], CoMet [19], IMG/M [20, 21], MetaPath [22], PICRUSt [23], Genometa [24], MetaPathway [25], COGNIZER [26], MG-RAST [27,28], MEGAN [29] and MOCAT2 [30], have been pro-posed [31]. For functional characterisation, protein gene annotation remains a fundamentally difficult task that still needs to be improved in order to better understand the billions of sequences that remain functionally unanno-tated [32, 33]. One difficulty comes from the fact that most environmental coding sequences present no or very weak similarity with known sequences and that many of them might be new genes with novel functions. In prac-tice, they often do not match reference databases or they match with very low significance scores [34], leading to a poor functional annotation [32]. A second difficulty is that environmental coding sequences are fragmented and annotation of partial information becomes harder due to a much reduced sequence length. In this respect, since protein-coding sequences might be too long compared to reads, in environmental sequence classification, one can either realise a simultaneous alignment and assembly of reads using reference proteins or probabilistic protein sequence profiles [35–37] hoping to improve the sen-sitivity to detect significant matches, or can focus on annotating protein domains directly on sequencing reads [38]. Indeed, domains are functional units, much shorter than proteins: even though their sizes vary from a few tens up to several hundreds of amino acids, 90% of the known domains are smaller than 200 aa with mean size of 100 aa [39–41]. Despite their short length, they are sufficiently precise to inform us about the potential functional activity of the communities. In particular, direct read annota-tion will become increasingly important in the future, due to its contribution in the design of computation-ally efficient and precise assembly algorithms [42]. With the production of larger and larger MG/MT datasets and the exploration of new environments (possibly gather-ing many unknown species), contig reconstruction might become even more challenging if realised without the help of domain annotation.
Here, we introduce MetaCLADE, a new generation method for the annotation of protein domains in MG/MT
reads. MetaCLADE uses a multi-source annotation strategy [43], where each known domain is represented by a few hundred probabilistic models and an intelligent algorithmic strategy filters the high number of hits pro-duced by the models, retaining only the most reliable ones. These models, called clade-centered models (CCMs), span regions of the protein sequence space that are usu-ally not well represented in a model based on a global sequence consensus (SCM) [44–47]. They might highlight motifs, structural or physico-chemical properties charac-teristic of divergent homologous sequences. Hence, if a domain is associated to many divergent homologs, CCMs are expected to describe properties that could be missed by the SCM representing a global consensus. For this reason, CCMs should help in finding diverged homolo-gous sequences in species that might be phylogenetically distant.
The great improvement in annotation obtained with the multi-source strategy compared to the mono-source strategy, employed by the two most commonly used anno-tation tools HMMer [47] and HHblits [48,49], was proven for CLADE in [43,50] for genomes and, more generally, for datasets of complete coding sequences. Many differ-ent validation tests have been developed in [43], where, in particular, it has been shown that many of the anno-tations realised with CLADE based on domains present in Pfam24 and considered false positives by Pfam24 were finally validated by the Pfam27 release, this augment-ing the confidence on CLADE annotation of protein sequences. With the introduction of MetaCLADE, how-ever, we push forward this idea and we show that CCMs can also be used to successfully annotate fragmented coding sequences in MG/MT datasets, where domain divergence and species variability might be very large. Under the hypothesis that the most populated functional classes define community preferences, the high-quality quantification of domains in reads reached with Meta-CLADE allows us to infer domain functional classification and the functional importance of species in a commu-nity. Differences in domain counts for specific functional classes can also be used to compare and characterise environments.
two main contributions. First, it introduces a novel def-inition for a domain-specific bi-dimensional gathering threshold based on a probability space constructed using a naive Bayes classifier. Second, it simplifies the hit selec-tion so that domain annotaselec-tion would be less sensitive to sequencing errors and hit length.
In order to show how MetaCLADE performs with respect to known domain annotation methods, we realised multiple comparative analyses of MG/MT datasets and demonstrated that MetaCLADE improves domain annotation and provides an improved resolution of the functional activity of a community, while clar-ifying preferences and missing functional features. We compared MetaCLADE against InterProScan [51, 52], a tool that combines different protein signature recogni-tion methods and different domain databases; UProC [38], a fast and sensitive algorithm that applies directly to raw reads; and the profile-based assembler HMM-GRASPx [37]. These are either new or most commonly used metagenomic annotation tools and, as they are based on Pfam, we can fairly compare MetaCLADE to them. We used several datasets, based on either real or simulated MG/MT sequences, with different characteristics, such as read length (100 bp versus 200 bp) and non-uniform species relative abundance. The simulated datasets have been generated either from known complete genomes or, more realistically, from MG datasets.
Results
Protein domains found in short MG and MT reads can be used as precise markers of the functional activity of an environment. We show that MetaCLADE highly improves current annotation methods and reaches a very fine degree of accuracy in annotation.
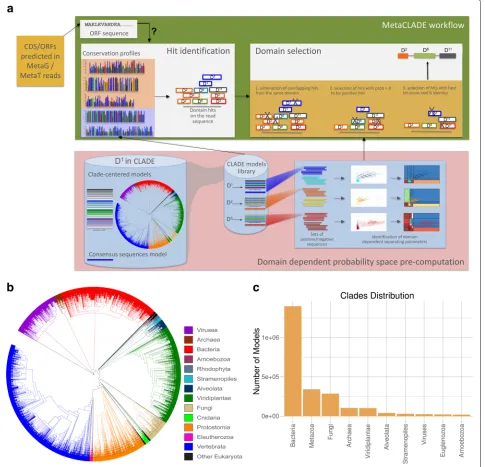
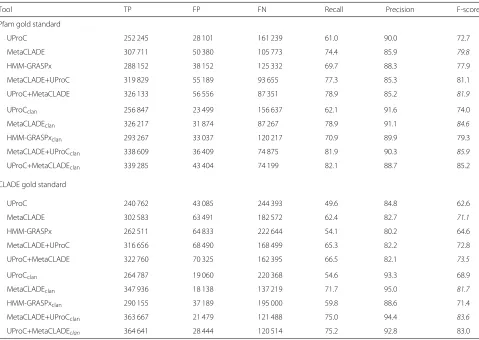
MetaCLADE workflow is illustrated in Fig.1a. It takes a dataset of reads (with an average size between 100 and 500 nucleotides) in input and searches for domains using a library of more than two million probabilistic mod-els (CCMs and SCMs) [43] associated to almost 15,000 Pfam domains. For each domain, hundreds of CCMs have been generated from homologous sequences representing the entire phylogenetic tree of life. The spread of species whose sequences were used for CCM construction is illus-trated by the phylogenetic tree in Fig.1b, where each leaf corresponds to a different species. In contrast, the dis-tribution of models constructed from sequences coming from different clades of the phylogenetic tree is illus-trated in Fig.1c. We note that the total number of models constructed from bacterial species is higher than from eukaryotes and even higher than from archaea. Indeed, a species contributes to at most one model for a domain and can be used for constructing several models for dif-ferent domains. As an example, the number of species considered for Bacteria and Viridiplantae is roughly the
same (Fig.1b) while the number of models constructed from bacterial sequences is an order of magnitude higher than those from Viridiplantae (1.3e+6 vs 1e+5, see Fig.1c).
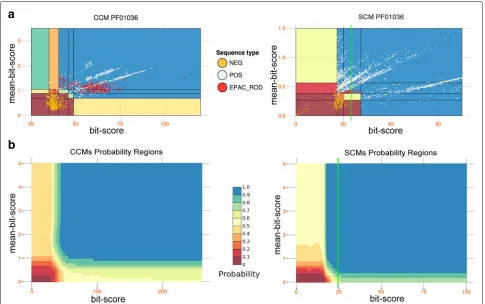
Given a read, a large number of domain hits is pro-duced from the large number of models. MetaCLADE filters them according to three main criteria, applied one after the other to obtain the most likely annotation for each read. The first selection criteria filters out all over-lapping hits for the same domain by using the match best score. Note that for any domain identified in a region of the read, it keeps exactly one domain hit per region. Also, note that a read might contain more than one non-overlapping occurrence of the same domain. This filter constitutes the first rough selection eliminating redundant hits and keeping different domains. The second crite-ria is the heart of the selection step and filters out most hits by keeping only those having a very high proba-bility of being true hits. Probabilities are estimated in MetaCLADE through a pre-computed step that divides the sequence space of each domain in probability regions describing whether a hit (possibly a fragment of a domain) can be accepted with a certain confidence or not. This fil-ter might eliminate all hits associated to a given domain. Finally, the third step selects hits that might be asso-ciated to very similar domains. Often, the hit matches produced by models associated to similar domains are overlapping. MetaCLADE carefully evaluates them and selects the hit with a highest sequence identity to the con-sensus sequence of the model and the highest bit-score (see “Methods” section).
A main important methodological point in Meta-CLADE concerns the explicit estimation of the likelihood of a hit to be a true domain. This estimation is partic-ularly sensitive to the length of the hit, that in MG and MT data might be very small; namely, for each domain, MetaCLADE defines a two-dimensional gathering thresh-old (GA) by combining bit-score and mean-bit-score of the domain hit and by identifying multiple regions in the two-dimensional sequence space that, with a high prob-ability, contain reliable annotations for short sequences. All computational details of the approach (i.e., algo-rithms, statistical models and parameter thresholds) are described in the “Methods” section. Differences between MetaCLADE and CLADE are listed in the “Discussion” section.
Fig. 1The MetaCLADE workflow.aThe MetaCLADE workflow is described in the rectangular green box: the two MetaCLADE main steps are illustrated in white boxes. MetaCLADE input data is constituted by (i) a set of reads to be annotated where ORFs have been already identified and (ii) the CLADE model library. The CLADE model library is used to identify all domain hits for a ORF. The large set of identified hits is then combined with gathering thresholds pre-computed for each domain model (pink box), to realise the second main step in MetaCLADE (right white box):
overlapping domain hits are selected based on three filtering features. The output of the workflow is an annotation of the ORF, possibly constituted by several domains. The figure illustrates the best expected annotation of a ORF, that is a domain with, possibly, some domain fragments
surrounding it. The rectangular pink box illustrates the pre-computed step. For each domain, the CLADE library contains several hundreds of models
that are used in MetaCLADE to identify the hits. For domainD1, considered in the blue cylinder on the left, the model library contains the consensus
model (blue coloured line, bottom) and hundreds of CCMs generated from sequences that are spread through the phylogenetic tree of species. Coloured lines represent models constructed from sequences coming from phylogenetic clades coloured on the same colour tone. The blue box on the right illustrates the pre-computation of the domain-specific parameters for the discrimination of positive (light blue, yellow and dark red) from negative (blue, orange and red) sequences. Dots in the plots correspond to sequences. The sequence spaces defined by bit-scores and mean-bit-scores (white plots) and the probability spaces (plots where probabilities are associated to regions) obtained by the naive Bayes classifier
are given.bPhylogenetic tree of species that generated the CCMs used in MetaCLADE [43].cHistogram reporting the number of CCMs available in
on five ocean MT samples. Five more environmental samples, produced with 454 GS FLX Titanium technol-ogy, demonstrated that MetaCLADE annotation highly improves over InterProScan (run with different libraries). One more environmental sample, produced with Illumina HiSeq 2000 technology, confirmed MetaCLADE’s good performance on datasets of much shorter reads.
To compare MetaCLADE against two state-of-the-art annotation tools designed for short sequences, HMM-GRASPx and UProC, we used environmental samples, a simulated dataset previously employed to evaluate HMM-GRASPx, and two datasets simulated directly from MG sequences. These datasets are different in terms of aver-age read length and species coveraver-age, and they highlight the complementarity of MetaCLADE compared to UProC with respect to reads of shorter (100 bp) and longer (200 bp) size. They help to show that a combination of the two tools can improve performances even more.
Comparison of MetaCLADE and HMMer on a simulated metagenomic dataset
We simulated a 454-read dataset from 56 fully sequenced genomes—belonging to archaea and bacteria—and accounting for a total size of 187 Mbp (NCBI’s accession numbers and genome sizes are shown in Additional file1: Table S2.) Genomes have been fragmented with MetaSim [53] and the outcoming clones have been parsed with FlowSim [54], to simulate realistic insertion and deletion errors expected during DNA sequencing. FlowSim was used with the error model of the “454 Titanium FLX” sequencing platform (error rate∼ 1%). This resulted in about 500,000 reads, with an average size of 523 bp, that were given as input to MetaCLADE.
Even though 454 is becoming nowadays a sequencing platform less and less used, we considered it in order to compare MetaCLADE to HMMer on reads that are not short. Indeed, HMMer was previously shown not to perform well on short fragments [38].
The performance of MetaCLADE and HMMer on the aforementioned ORFs was computed on a ground-truth defined as follows: from each genome, we considered its CoDing Sequence (CDS) in NCBI and retained only those also defined by Swiss-Prot (June 2016 release). CDS regions were further enriched with the available Pfam domain annotation (version 29). Then, the set of true pos-itives has been defined by those ORFs overlapping such Pfam annotations.
Predictions made by MetaCLADE and HMMer have been compared on two levels by considering or not as true positives (or true negatives) the predictions which fell into the same Pfam clan [55] or InterPro family [56]. In the clan-oriented annotation, MetaCLADE and HMMer were able to obtain an F-score of 98.57 and 99.56 respectively. However, MetaCLADE was able to identify more domains
(86.2%) than HMMer (74.8%). Instead, if the compari-son does not take into account the clans, the F-scores fall down to 95.22 and 98.16 (with 83.3 and 73.8% of recovered domains) for MetaCLADE and HMMer, respectively. In both these analyses, we notice that MetaCLADE presents a higher number of false positives and false negatives with respect to HMMer. This is expected as Swiss-Prot’s annotations—which we used to define the ground-truth— are based on Pfam and hence on HMMer. A synthesis of the comparison is reported in Additional file1: Table S3.
Finally, it is interesting to point out that the 13.8% of MetaCLADE’s missed domains belonged to very small fragments, with an average length of 38 aa. The distribu-tion ofEvalues for domains annotated by MetaCLADE is plotted in Additional file1: Figure S6A (a similar analy-sis which considers the TrEMBL annotation is available in Additional file1: Figure S6B).
Functional annotation of large oceanic metatranscriptomic samples
Domain identification allows to highlight the main func-tional activities of a community through the identifica-tion of the funcidentifica-tions supported by the most abundant domains, but also to compare communities and organ-isms. A more accurate zooming into functional activities hopefully leads to capture missing features of communi-ties’ behaviour.
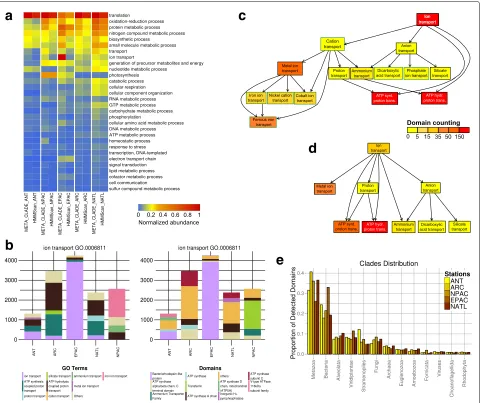
The functional annotation of domains in the five oceans MT datasets in [57] demonstrates a sharp difference in relative abundance of domains found by MetaCLADE compared to HMMer (hmmscan) (Fig.2a). MetaCLADE shows that the larger amount of domains it detects falls coherently in functional classes of interest for spe-cific environments, reaching a much better resolution of sign ificant terms among all Metagenomic GO-Slim functional classes. Certain functional classes, such as “translation”, are overrepresented for both MetaCLADE and HMMer, as expected. Others are characteristic of certain environmental conditions, and they are only detected by MetaCLADE. The numerical comparison involving all Metagenomic GO-Slim functional classes (partly visualised by the heat-map in Fig.2a) is reported in Additional file 1 (see the “Methods” section for the normalisation procedure).
a
c
b
e
d
Fig. 2Functional analysis of MT data collected on five ocean sites.aComparative table of domain abundance classification. Rows represent the Metagenomic GO-Slim functional classes that are the most represented, in at least one of the ocean samples. The level of domain abundance
(entries of the table; normalised domain abundance,NS
Idefined in the “Methods” section, is rescaled here in the interval [0,1]) for Antarctic (ANT),
North Pacific (NPAC), Equatorial Pacific (EPAC), Arctic (ARC) and North Atlantic (NATL) samples that are described. Samples are arranged in five columns reporting, for each functional class, the level of abundance obtained with MetaCLADE and HMMer. The colour bar ranks high levels of abundance in dark red and low levels in blue. The ranking of Metagenomic GO-Slim functional classes (from top to bottom in the table) is fixed by the average abundance of a domain in the five samples detected by MetaCLADE. Note that only the most abundant subset of GO-Slim classes is
reported.bMetaCLADE analysis of domains belonging to the GO-term “ion transport” (GO.0006811). Results are displayed by GO-terms association
(left) and by domain name (right). Column heights correspond to the estimationNS
I of domain abundance relative to each sampleSand functional
classI(see the “Domain abundance” section in the “Methods” section). For each environmental sample, the abundance of the first five most
represented domains in the sample is plotted (note that each column has five colours.)cHierarchical tree graph of GO-terms for “ion transport”
obtained with MetaCLADE and described inbfor the ANT sample. The count of domains classified with a given GO-term in ANT is represented by
the colour of the associated box. The colour scale represents the number of domains identified for a GO-term. Red corresponds to>150 domain
hits. Each box in the tree graph is coloured independently of its position in the tree graph because each domain is associated to a single box. There
is no cumulative effect in the counting.dHierarchical tree graph of GO-terms for “ion transport” obtained with HMMer. The GO-terms are associated
to domains identified by HMMer in the ANT sample, compared toc.eDistribution of species originating CCMs used to annotate the five MT
datasets. Due to the different number of reads in the datasets (and hence, the variable number of identified domains), we report the proportion of species, organised in clades, for each dataset
Note the red colour, representing the highest abun-dance, given to the node “ion transport” in the Meta-CLADE tree graph of Fig. 2c compared to the yellow
domains: it contains six nodes (corresponding to distinct GO-terms) more than the HMMer tree graph. The set of domains for the GO-term “metal ion transport”, for instance, is represented by just one node of 44 identi-fied domains in the HMMer tree graph (Fig. 2d), while it is detailed by a more complex MetaCLADE tree graph of 165 identified domains, associated to iron ion, nickel cation, cobalt ion and ferrous iron transport GO-terms (Fig.2c). This association to specific functional roles of the identified domains can help biologists to better char-acterise the metabolic regimes of the sample. Overall, MetaCLADE uniformly annotates more domains and with a more specific functional association than HMMer. The same tree graph analysis was realised for all Metage-nomic GO-Slim functional classes, and the functional variability, through which annotated domains span within each tree graph, was estimated by counting the num-ber of nodes (corresponding to distinct GO-terms) in the MetaCLADE and HMMer tree graphs. The values of the analysis are reported in Additional file 2, and they confirm, at large scale, that MetaCLADE annota-tion provides a more refined funcannota-tional descripannota-tion than HMMer.
In Fig.2a, some functional classes appear as the most represented in exactly one environmental sample. This is the case for the pyrophosphates in NATL, the transfer-rin and the ammonium transporter in NPAC. Others are shared by several samples. They might be present in the remaining samples as well, but relatively less represented (as for the bacteriorhodopsin-like domains in EPAC and ANT discussed above, for instance, illustrated in Fig.2b). This comparative information is crucial for zooming in the functional activity of an environment.
Finally, one should notice the distribution of species providing the homologous sequences generating CCMs used by MetaCLADE to annotate domains in the five oceanic samples (Fig. 2e). These eukaryotic read sequences were mostly annotated by “eukaryotic” CCMs generated from Metazoa and Alveolata domain sequences. A large contribution from other organisms, such as Bacteria, is also present as expected. We notice a large presence of annotations from “bacterial” CCMs for EPAC. These annotations mostly concern three domains (bacteriorhodopsin-like, S-adenosyl-L-homocysteine hydrolase and cyclosome subunit 3—Apc3 domains) covering together the 12% of all EPAC CCM annotations and the 38% of all “bacterial” CCM annotations for EPAC. These are the domains whose “bacterial” CCMs cover alone more than the 1% of all CCM annotations; note that the bacteriorhodopsin-like domain alone covers more than 25% of “bacterial” CCM annotations for EPAC. The list of domains that have been annotated by MetaCLADE with bacterial/eukaryotic/archaea/viral CCMs is given in Additional file3. See also Additional file4.
Identification of divergent domains by conserved small motifs
MetaCLADE multi-source annotation strategy is used with the purpose of identifying very divergent domain sequences lying in reads. In fact, CCMs are probabilis-tic models that describe closely specific sequences and they can capture conserved patterns that are specific of homologs niches and that are missed by SCMs. As a consequence, CCMs for a domain have the possibility to describe domain sequences in greater detail and span a greater space of homologous sequences, possibly very divergent. For instance, in Fig.3a, we consider the con-servation profile of the sequence alignment associated to a CCM used in the annotation of the rhodopsin-like domain in MG fragments, missed by HMMer as dis-cussed above, but whose expression is expected in the Equatorial Pacific [58, 59]. With this and other CCMs, MetaCLADE could annotate 371 sequences in EPAC that could not be detected by HMMer in [57] due to the strong sequence divergence (Fig. 3d). The conservation profile of the alignment of the 371 environmental sequences is reported in Fig. 3b. It is very conserved and corre-sponds to a portion of the rhodopsin-like domain. This conserved pattern makes the third of the length of the entire domain. The rest of the sequence is divergent and remains with no annotation. One can visually appreci-ate the stronger similarity of the CCM profile (Fig. 3a) to the MG sequences (Fig. 3b) compared to the Pfam SCM profile (Fig. 3d) of the bacterial-like rhodopsin. Indeed, 48 positions of the CCM profile versus 25 of the Pfam SCM profile match the alignment of the MG sequences (that is, given a position, the most represented amino acid in the MG profile is one of the first three best represented amino acids in the CCM/SCM profile at that position).
Note that the motif identified by MetaCLADE in the eukaryotic MG sample was recently identified in the dinoflagellate Prorocentrum donghaiense [60] (Fig. 3c) with an alignment comprised by homologs fromOxyrrhis marinaand bacteria. The conserved positions, character-istic of the dinoflagellate sequence [60], are recovered in the alignment of our MG sequences, confirming Meta-CLADE functional annotation.
MetaCLADE demonstrated that its algorithmic strategy allows for the identification of conserved small motifs in MG samples and opens up the possibility of a systematic characterisation of environmental motifs.
Improved annotation of MG/MT datasets compared to InterProScan
a
b
c
d
Fig. 3Conserved motif in bacterial rhodopsin sequences annotated by MetaCLADE in the MT dataset EPAC.aConservation profile of the
MetaCLADE CCM fragment generated by theGeodermatophilus obscurus(strain ATCC 25078/DSM 43160/JCM 3152/G-20; Actinobacteria) sequence
of the rhodopsin-like domain used by MetaCLADE to annotate environmental sequences in EPAC [57]. An orange dot is located above all positions
in the profile when one of the three top residues with the highest frequency appears as highest frequency residue in the corresponding position of
the conservation profile inb.bProfile generated from the alignment of 371 environmental sequences annotated by MetaCLADE with CCMs of the
rhodopsin-like domain and missed by HHMer. The letter height in the logo is proportional to the number of sequences in the alignment that
contain the letter at a specific position, and the letter thickness is proportional to the number of gaps in the alignment at that position.cRhodopsin
fragment sequence from the dinoflagellateProrocentrum donghaiensefound in the NR database and matching, withEvalue 3e−22 and sequence
identity 78%, the longest environmental sequence among the 371 annotated by MetaCLADE. Note that the fragment has been aligned to the
profile inbfor a visual inspection of conserved positions.dConservation profile HMM of the Pfam bacterial rhodopsin domain PF01036 (fragment).
As inc, positions are aligned with the profile inbfor best visualisation. An orange dot is located above a position in the profile when one of the
three top residues with the highest frequency appears as highest frequency residue in the corresponding position of the conservation profile inb
see Additional file1). For these datasets, the sequenced reads had been pre-processed with the EBI Metagenomics pipeline [67] leading on which the annotation has been realised.
These datasets differ in number of reads and difficulty (measured by the number of annotated domains that could be identified). The performances of InterProScan
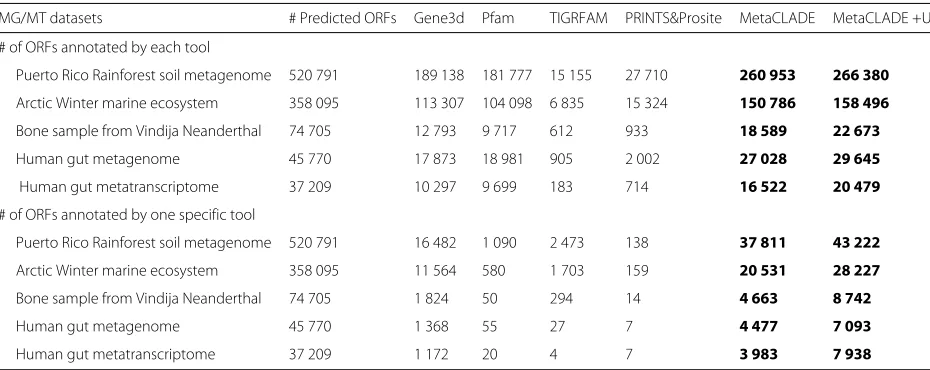
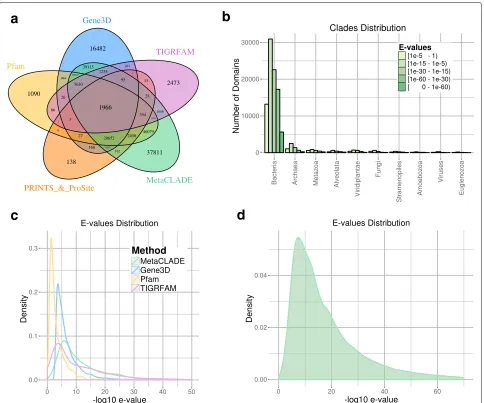
on the five domain libraries differ greatly (Table 1). The first observation comes from the number of anno-tated domains shared by the five libraries, which is very reduced, indicating the complementarity of their domain models (see Fig. 4a for the Puerto Rico Rain-forest dataset and Additional file 1: Figures S7A-S10A for the other four datasets). One observes that Pfam
Table 1# of ORFs annotated by five different domain annotation tools
MG/MT datasets # Predicted ORFs Gene3d Pfam TIGRFAM PRINTS&Prosite MetaCLADE MetaCLADE +UProC
# of ORFs annotated by each tool
Puerto Rico Rainforest soil metagenome 520 791 189 138 181 777 15 155 27 710 260 953 266 380
Arctic Winter marine ecosystem 358 095 113 307 104 098 6 835 15 324 150 786 158 496
Bone sample from Vindija Neanderthal 74 705 12 793 9 717 612 933 18 589 22 673
Human gut metagenome 45 770 17 873 18 981 905 2 002 27 028 29 645
Human gut metatranscriptome 37 209 10 297 9 699 183 714 16 522 20 479
# of ORFs annotated by one specific tool
Puerto Rico Rainforest soil metagenome 520 791 16 482 1 090 2 473 138 37 811 43 222
Arctic Winter marine ecosystem 358 095 11 564 580 1 703 159 20 531 28 227
Bone sample from Vindija Neanderthal 74 705 1 824 50 294 14 4 663 8 742
Human gut metagenome 45 770 1 368 55 27 7 4 477 7 093
Human gut metatranscriptome 37 209 1 172 20 4 7 3 983 7 938
a
b
c
d
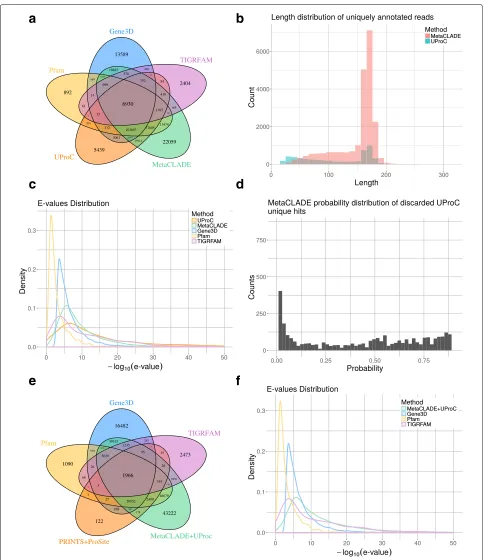
Fig. 4Read annotations of the Puerto Rico Rainforest MG dataset obtained with InterProScan and MetaCLADE.aDomain annotation of the five tools: Pfam (yellow), Gene3D (blue), TIGRFAM (purple), PRINTS&ProSite (orange) and MetaCLADE (green). The Venn diagram representing the
number of reads annotated by one or several tools is reported.bDistribution of species originating CCMs used to annotate the dataset with
MetaCLADE.cDistributions ofEvalues associated to the sets of domains identified in an exclusive manner by each tool. For instance, for
MetaCLADE, we considered 37,811 domains (seea).Evalues are plotted on thex-axis using a−log10scale.dDistribution ofEvalues associated to
all domains identified by MetaCLADE. As inc,Evalues are plotted on thex-axis using a−log10scale
and Gene3D annotate the largest number of domains, together with MetaCLADE that largely agrees with them. In Fig.4a, for instance, over 260,000 domains annotated by MetaCLADE, only 38,811 are identified exclusively by MetaCLADE, while all others are found by at least another tool. TIGRFAM and PRINTS&ProSite (the union was considered) annotate the least, and their annotation is largely covered by other libraries. In particular, notice that MetaCLADE annotates a large number of reads that are missed by InterProScan for all five datasets. Table1 reports the number of ORFs annotated by each library (top) and those exclusively annotated by a single library (bottom). MetaCLADE shows a high number of uniquely
annotated by Gene3D. In fact, Gene3D uses theE value threshold 1e−4 which is for most domains too permis-sive. Domains were exclusively identified by Gene3D with an average E value of 1e−7, while domains exclusively identified by MetaCLADE have an average E value of 1e−12.
We note that all the 2473 domains annotated exclusively by TIGRFAM correspond to signatures/domains that are unknown to Pfam (version 27, for which CCMs have been generated) and therefore to MetaCLADE.
Identification of motifs in short reads: the example of ABC transporters
MetaCLADE is also suitable for technologies producing very short reads like Illumina HiSeq 2000 sequencing sys-tem. We analysed the predicted ORFs left without anno-tation by InterPro from one run of the O’Connor lake dataset. The dataset contains 1,315,435 input reads and 1,211,131 predicted ORFs, with an upper bound on the missed ORFs of 104,304. InterProScan annotated 273,903 ORFs, leaving unannotated 937,228 ORFs. The two sets of predicted and unannotated ORFs have a mean ORF length of 123 bp, with a minimum of 100 bp and a maximum of 135 bp. MetaCLADE analysed the 937,228 unannotated ORFs and succeeded to annotate 57,356 of them. The distribution of E values for MetaCLADE annotations is shown in Additional file1: Figure S11. The list of the most abundant identified domains is given in Additional file1: Table S6. The domain ranked first is the ABC transporter type 1.
The presence in the MG dataset of annotated sequences presenting some sequence similarity to the known ABC transporters is an indicator of potential metabolic activ-ities that we wish to discover. To support confidence on this identified group of sequences, we scanned them to see if we could find motifs that are known to charac-terise the ABC transporter domain (https://www.ebi.ac. uk/interpro/entry/IPR000515). For this, we considered all 1109 environmental sequences annotated as ABC trans-porter type 1 by MetaCLADE (Additional file1: Table S6) and selected the ones with anEvalue smaller than 1e−4. There are 945 sequences with an average length of 36.9 residues. We ran MEME [68] on them to find the 10 most significant motifs. Among these motifs, we identi-fied theEAAmotif, a 20 amino acid-conserved sequence known to occur in ABC transporter type 1 (https:// www.ebi.ac.uk/interpro/entry/IPR000515) (See motif 9 in Additional file 1: Table S7; strictly speaking, we found a portion of the known EAAmotif, where the submotif EAA− − −−Goccurs [69].). The consensus sequences of the 10 motifs (for example,FNLLGDGLRDALDPRfor motif 1 andGAILTEAALSFLGLGfor motif 9 in Additional file1: Table S7) were used as query to search the NR database. For all consensus sequences, most of the hits found
(> 95%) matched ABC transporters. In rare cases, BLAST [70] retrieved, in addition to the great majority of ABC transporters, other transport systems permeases or hypo-thetical proteins.
The presence of known motifs favourably supports the finding, and MetaCLADE proves to be able to extract use-ful functional information even from very short reads. In this respect, Additional file 1: Table S6 shows that MetaCLADE annotations can substantially change the estimations of domain abundance in MG samples com-pared to estimations realised with HMMer. This confirms what was already observed for the ocean MT datasets, where MetaCLADE allowed for a more precise functional comparison.
Sensitivity of MetaCLADE on the distribution of species generating the models
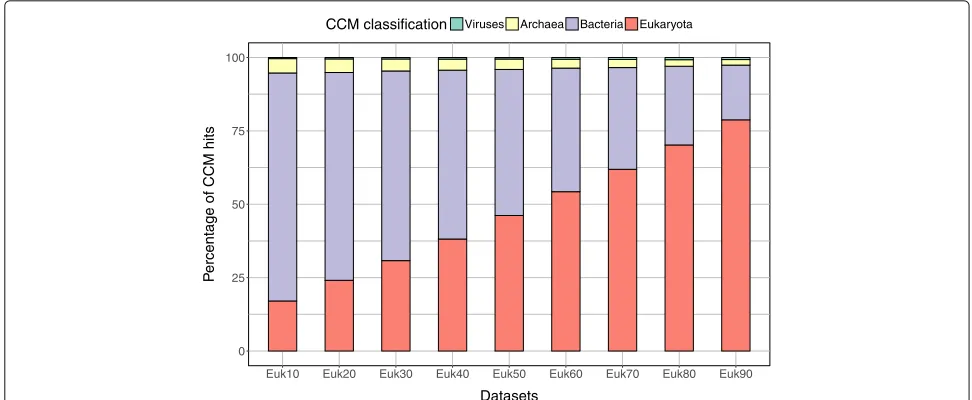
To analyse MetaCLADE’s sensitivity on the distribution of species from which models have been generated com-pared to species where reads come from, we verified the distribution of species generating models used for the annotation of nine simulated datasets of reads. These datasets contain short fragments coming from species belonging to bacteria, viruses, archaea and eukaryotes. Specifically, they are constructed by gradually increment-ing (by 10%) the number of eukaryotic sequences in them (see the “Methods” section). The nine resulting datasets have been annotated with MetaCLADE, and the origin of the CCMs used is reported in Fig.5. As expected, in the annotation process, MetaCLADE tends to use mod-els close to the communities represented in the dataset; namely, the number of models generated from eukary-otic sequences used for annotation is proportional to the quantity of eukaryotic reads in the datasets. This observa-tion holds true for real datasets as illustrated in Figs.2e and4b(see also Additional file1: Figures S7B-S10B).
Comparison with UProC
Fig. 5Distributions of species whose sequences generated models for MetaCLADE annotation. Analysis of nine simulated datasets named “Eukx”
containingx% of reads coming from eukaryotic sequences. For increasing values ofx, one observes a proportionally higher number of CCMs
coming from eukaryotes (red) that have been used for the annotation of the dataset. The proportion of bacteria (violet), archaea (yellow) and viruses (green) is reported for each dataset
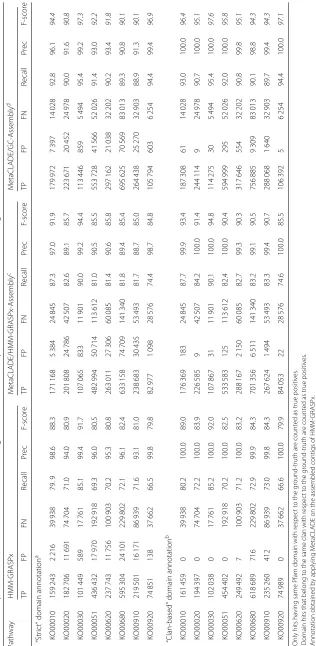
not concern very small reads but rather reads with larger size>50 aa, and particularly>150 aa. TheEvalue den-sity distribution curve of UProC annotations (see Fig.6c and “Methods” section) highlights reasonably lowEvalues showing a high confidence in most UProC domain anno-tations. The second best curve is MetaCLADE’s curve, placed on its left, followed by the InterProScan curves.
A quite large number of reads exclusively predicted by UProC is also predicted by MetaCLADE but not selected by MetaCLADE because of its probability threshold set at 0.9. More precisely, they cover less than 50% of the UProC exclusively predicted reads. By looking at the confidence of these domain predictions, a large number of these pre-dicted reads have very low probability (see Fig.6d). This observation suggests that, for these domains, the CLADE’s library does not cover properly the spread of evolutionary variability of the domains.
In Additional file1: Figures S12-S15, we report the anal-ysis of the other four MG and MT datasets. All these datasets confirm that most uniquely annotated UProC reads are very short (< 50 aa) compared to reads uniquely annotated by MetaCLADE (see Additional file1: Figures S12B-S15B). The density curves of the UProC’s associated E values occupy the right-hand side of the plots (see Additional file 1: Figures S12C-S15C) with a peak that indicates an optimal average E value for UProC reads. Moreover, from the distribution of domain lengths for uniquely annotated reads in Additional file1: Figure S16, we observe that, depending on the dataset, for a given domain, the read multiplicity can be much larger for MetaCLADE than for UProC. The reason is anchored on the way UProC and MetaCLADE handle
sequence information. Indeed, if the space of sequences in the FULL Pfam dataset associated to a domain spans well over diversified homologous sequences, then UProC, which exploits all FULL Pfam sequences, can produce highly confident predictions. If the number of Meta-CLADE models is small compared to the number of diversified FULL Pfam sequences, it might represent well only a part of the diversification and fail in predicting homology on the unrepresented pool of sequences. In contrast, if the FULL Pfam dataset does not span well over the entire set of homologous sequences, then Meta-CLADE might be able to reach those diverged sequences that cannot be reached by UProC by exploiting its probabilistic models.
A first comparison with HMM-GRASPx using an assembly-based approach
a
b
c
d
e
f
Fig. 6Read annotations of the Puerto Rico Rainforest MG dataset obtained with InterProScan, UProC and MetaCLADE.aDomain annotation of five tools: Pfam (yellow), Gene3D (blue), TIGRFAM (purple), UProC (orange) and MetaCLADE (green). The Venn diagram representing the number of
reads annotated by one or several tools is reported.bLength distribution of reads annotated exclusively by either UProC or MetaCLADE.c
Distributions ofEvalues associated to the sets of domains identified in an exclusive manner by each tool. For instance, for MetaCLADE, we
considered 22,059 domains (seea).Evalues are plotted on the x-axis using a−log10scale.dDistribution of probabilities associated to those
exclusive UProC domain annotations that have been detected by MetaCLADE but discarded because of the probability threshold 0.9.eVenn
assembly approach, based on the construction and annotation of a gene catalog [71,72], where input reads are assembled using a canonical assembly pipeline, ORFs are predicted and putative gene sequences are clustered in order to create a non-redundant set (i.e. the gene catalog). The latter was annotated with MetaCLADE. Reads were finally mapped back to the catalog and the annotation transferred accordingly. Unmapped reads were also separately annotated with MetaCLADE. We compared MetaCLADE based on both assembly approaches against HMM-GRASPx.
To assess annotation performances, the experiment was run on the dataset used in [37] which was augmented in order to better reflect the size of modern metagenomic datasets. More precisely, a set of 20 million paired-end reads was generated from a simulated marine dataset with uneven coverage and read length of 100 bp. A total of 303 Pfam domain families that are involved in some important metabolic pathways were selected as input for HMM-GRASPx and MetaCLADE as in [37] (details are reported in the “Methods” section).
The results of our comparison are reported in Table2 showing that MetaCLADE always outperforms HMM-GRASPx regardless of the assembly method considered. MetaCLADE, however, performed better considering the gene catalog as a reference. The same observation still holds when clans are evaluated, that is when domain hits of the same clan (with respect to the gold standard) are counted as true positives.
The same comparison had also been carried out on a simulated dataset of about 10 million 200-bp paired-end reads (keeping the same average coverage and compo-sition of the 100-bp read dataset). Here again, Meta-CLADE outperformed HMM-GRASPx (Additional file1: Table S13), especially when considering HMM-GRASPx’s assembly as a reference for MetaCLADE. As a matter of fact, the lower number of reads led to a more fragmented gene catalog and a lower performance of MetaCLADE on these assembled sequences. However, it was not possible to increase the read number (e.g. to 20 million) due to the excessive amount of computational resources (more than 128 GB of RAM) demanded by HMM-GRASPx. In fact, the application of HMM-GRASPx seems limited to datasets of modest size (in terms of both read and profile number).
Overall, even though MetaCLADE achieved very good performances in this assembly-based scenario, we should emphasise that it had been specifically tailored to work with relatively short fragments. Nevertheless, it can def-initely benefit from read assembly (possibly in com-bination with CLADE [43] for the treatment of long sequences). For this reason, we envisage the intro-duction of a preliminary assembly phase in a future implementation of our tool.
Comparison with HMM-GRASPx and UProC on datasets of 100- and 200-bp reads
To investigate further MetaCLADE performance with very short reads, characterising the growing number of Illumina sequencing MG datasets available, we gener-ated two sets of sequences, 100 bp (1,226,882 reads) and 200 bp (682,380 reads) long, from the Guerrero Negro Hypersaline Microbial Mats dataset (GNHM; see Additional file1). GNHM was used in [38] to demonstrate UProC performance on short reads versus profile-based methods and, indeed, in [42], it was shown that profile hidden Markov models substantially lose sensitivity on shorter reads. The two datasets have been evaluated by considering the annotations obtained either with Pfam (version 27) or with CLADE domain library (also based on Pfam27).
Table 3 shows a slightly better performance of UProC compared to HMM-GRASPx and MetaCLADE on GNHM for 100-bp reads with a gold standard set by Pfam annotation. The behaviour becomes less sharp when the gold standard is CLADE, characterised by a larger num-ber of domains. In particular, when clans are considered, MetaCLADE and UProC produce comparable F1-scores, of 57.7 and 58.9 respectively. As 200-bp reads are con-cerned, MetaCLADE outperforms UProC and HMM-GRASPx regardless of whether clans are considered or not. Notice the high F-scores reached by Meta-CLADE, 84.6 and 81.7 versus 74 and 68.9 reached by UProC on the two gold standards when clans are considered (Table 4). It is also interesting to notice that for the 200-bp reads, MetaCLADE iden-tifies a much larger number of true positives and a smaller number of false negatives than UProC, for both gold standards and independently on whether clans are considered or not. In particular, when consider-ing the gold standard set by CLADE and clans, Meta-CLADE identifies 80,000 domains more than UProC, and a smaller number of false negatives and false positives.
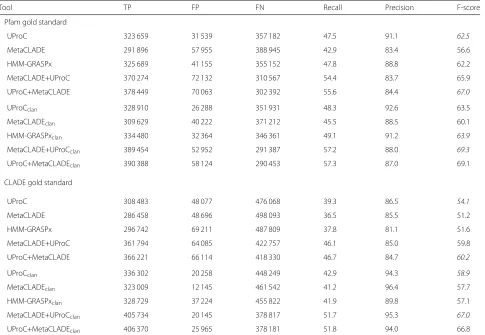
Table 3Comparison of UProC, HMM-GRASPx and MetaCLADE on the Guerrero Negro Hypersaline microbial Mat project (100-bp reads)
Tool TP FP FN Recall Precision F-score
Pfam gold standard
UProC 323 659 31 539 357 182 47.5 91.1 62.5
MetaCLADE 291 896 57 955 388 945 42.9 83.4 56.6
HMM-GRASPx 325 689 41 155 355 152 47.8 88.8 62.2
MetaCLADE+UProC 370 274 72 132 310 567 54.4 83.7 65.9
UProC+MetaCLADE 378 449 70 063 302 392 55.6 84.4 67.0
UProCclan 328 910 26 288 351 931 48.3 92.6 63.5
MetaCLADEclan 309 629 40 222 371 212 45.5 88.5 60.1
HMM-GRASPxclan 334 480 32 364 346 361 49.1 91.2 63.9
MetaCLADE+UProCclan 389 454 52 952 291 387 57.2 88.0 69.3
UProC+MetaCLADEclan 390 388 58 124 290 453 57.3 87.0 69.1
CLADE gold standard
UProC 308 483 48 077 476 068 39.3 86.5 54.1
MetaCLADE 286 458 48 696 498 093 36.5 85.5 51.2
HMM-GRASPx 296 742 69 211 487 809 37.8 81.1 51.6
MetaCLADE+UProC 361 794 64 085 422 757 46.1 85.0 59.8
UProC+MetaCLADE 366 221 66 114 418 330 46.7 84.7 60.2
UProCclan 336 302 20 258 448 249 42.9 94.3 58.9
MetaCLADEclan 323 009 12 145 461 542 41.2 96.4 57.7
HMM-GRASPxclan 328 729 37 224 455 822 41.9 89.8 57.1
MetaCLADE+UProCclan 405 734 20 145 378 817 51.7 95.3 67.0
UProC+MetaCLADEclan 406 370 25 965 378 181 51.8 94.0 66.8
The first table considers Pfam27 annotations as gold standard, while the second one uses CLADE27. Each table is made of two sub-tables where we evaluate annotation on exact domains (top) and on clans (bottom). Annotations with domains of the same clan are counted as true positives
Largest values are reported in italics
A measure of the improvement obtained by combining MetaCLADE and UProC
By combining MetaCLADE and UProC, we obtain an improved quality of the functional assignments of sequences of GNHM on both the 100-bp and the 200-bp datasets. Indeed, for the two datasets, we consid-ered the annotation realised by MetaCLADE augmented with UProC annotation on those reads left unanno-tated by MetaCLADE, and called this approach Meta-CLADE+UProC (see the “Methods” section). Vice versa, we considered the annotation realised by UProC aug-mented with MetaCLADE annotation on those reads left unannotated by UProC, and called this approach UProC+MetaCLADE (see the “Methods” section). On both GNHM datasets, for the 100- and 200-bp reads, UProC+MetaCLADE outperformed on exact domain annotation and MetaCLADE+UProC on clan annota-tion. This is expected because UProC, based on word matching, is intuitively similar to very conserved CCMs that are very close to known sequences. Most impor-tantly, the performance of their combination is bringing
a clear improvement in terms of number of correctly predicted domains independently on the gold standard and on the dataset (Tables 3 and 4). In Additional file 1: Figure S17, the precision-recall curve for Meta-CLADE+UProC shows that the addition of unique UProC annotations to MetaCLADE increases the number of false positives and therefore decreases precisions, as also seen in Table3. The advantage in using a combined approach like MetaCLADE+UProC relies on the increase of the recall (since false negatives decrease) counterbalanced by a small decrease in precision (since false positives slightly increase).
The combination MetaCLADE+UProC has been tested also on the Rainforest MG dataset, where it produced a much larger number of read predictions as illus-trated in Fig. 6e, accompanied by a distribution of E values showing high confidence (see Fig. 6f and com-pare it to Fig. 4a, c). MetaCLADE+UProC behaviour
on the other four MG/MT samples in Table 1 is
Table 4Comparison of UProC, HMM-GRASPx and MetaCLADE on the Guerrero Negro Hypersaline microbial Mat project (200-bp reads)
Tool TP FP FN Recall Precision F-score
Pfam gold standard
UProC 252 245 28 101 161 239 61.0 90.0 72.7
MetaCLADE 307 711 50 380 105 773 74.4 85.9 79.8
HMM-GRASPx 288 152 38 152 125 332 69.7 88.3 77.9
MetaCLADE+UProC 319 829 55 189 93 655 77.3 85.3 81.1
UProC+MetaCLADE 326 133 56 556 87 351 78.9 85.2 81.9
UProCclan 256 847 23 499 156 637 62.1 91.6 74.0
MetaCLADEclan 326 217 31 874 87 267 78.9 91.1 84.6
HMM-GRASPxclan 293 267 33 037 120 217 70.9 89.9 79.3
MetaCLADE+UProCclan 338 609 36 409 74 875 81.9 90.3 85.9
UProC+MetaCLADEclan 339 285 43 404 74 199 82.1 88.7 85.2
CLADE gold standard
UProC 240 762 43 085 244 393 49.6 84.8 62.6
MetaCLADE 302 583 63 491 182 572 62.4 82.7 71.1
HMM-GRASPx 262 511 64 833 222 644 54.1 80.2 64.6
MetaCLADE+UProC 316 656 68 490 168 499 65.3 82.2 72.8
UProC+MetaCLADE 322 760 70 325 162 395 66.5 82.1 73.5
UProCclan 264 787 19 060 220 368 54.6 93.3 68.9
MetaCLADEclan 347 936 18 138 137 219 71.7 95.0 81.7
HMM-GRASPxclan 290 155 37 189 195 000 59.8 88.6 71.4
MetaCLADE+UProCclan 363 667 21 479 121 488 75.0 94.4 83.6
UProC+MetaCLADEclan 364 641 28 444 120 514 75.2 92.8 83.0
The first table considers Pfam27 annotations as gold standard, while the second one uses CLADE27. Each table is made of two sub-tables where we evaluate annotation on exact domains (top) and on clans (bottom). Annotations with domains of the same clan are counted as true positives
Largest values are reported in italics
to high confidence E values (Additional file 1: Figures S12F-S15F).
Discussion
MetaCLADE was especially designed to consider the partial information contained in domain fragments, localised in reads. For this, we defined a powerful two-dimensional domain-dependent gathering threshold and we use multiple models to represent each domain, possi-bly characterising small conserved motifs for the domain. In future development, we foresee to improve the tool in several ways (see also [43]):
More domains and new models for an improved MetaCLADE annotation. New CCMs could be added to the library with the hope to reach novel and unrep-resented evolutionary solutions for a domain. An obvi-ous improvement could be obtained by extending the library with the set of new domains included in Gene3D and TIGRFAM. The motifs represented in PRINTS and ProSite could be also considered and the associated
profiles handled in MetaCLADE. Note that MetaCLADE package provides the program to pre-compute gathering thresholds for all domain models. This allows the user to compute appropriate thresholds based on new CCMs.
Constructing a library of conserved small motifs. The search for sequence motifs in an environmental sample might be realised with a computationally costly “all against all” read comparison. Alternatively, starting from the most conserved patterns comprised in CCMs, we can generate a repertoire of significant motifs specific of each domain in order to improve hit selection criteria. A systematic classification of these motifs might lead to datasets of motifs that could be used as environmental signatures of metabolic activities.
to associate a potential functional role to new domains discovered through the pattern.
Annotation of longer sequences. Availability of long reads and read assembly in contigs allow reconstruct-ing longer stretches, and possibly entire, ORF sequences. In this case, one could replace the third filter in Meta-CLADE with DAMA [73], to reconstruct the best domain architecture as done in CLADE.
Reduction of the number of redundant models in MetaCLADE. Some of the probabilistic models in Meta-CLADE library are expected to be redundant, and a suit-able handling of these models, after clustering, should help to increase the speed of the method and to pre-serve the same predictive power. Future development of MetaCLADE will reduce the number of redundant models representing domains.
New criteria to filter overlapping hits in MetaCLADE.
Different domain hits could be selected by exploiting fur-ther the characteristics of the two-dimensional space of sequences pre-computed for the domains. For instance, one could privilege the domain hits with larger bit-score/mean-bit-score distance from the closest negative in the space. These filtering conditions could improve the annotation and need to be tested at large scale.
MetaCLADE differences with CLADE. MetaCLADE has been designed with the purpose of annotating MG and MT reads. It exploits the multi-source annotation strat-egy introduced in CLADE and the CLADE model library, but it handles the models and their output in a differ-ent manner. Indeed, the CLADE pipeline combines the output of its rich database of probabilistic models with a machine-learning strategy in order to determine a set of best predictions for each domain sequence. Then, DAMA [73] is used to find the best domain architecture, by using information on domain co-occurrence and by exploiting multi-objective optimisation criteria.
Neither CLADE machine-learning algorithm nor DAMA are used in MetaCLADE. In fact, the charac-teristics of MG and MT reads, compared to full protein sequences, are their short lengths and the presence of multiple sequencing errors in them compared to full-length ORFs. Hence, they demand the design of a special computational protocol taking into account the particular nature of the data; namely:
1. CCMs cannot be used with tailored GA thresholds as in CLADE. Instead, we introduce an original
bi-dimensional gathering threshold that is specifically designed for evaluating short hits. For each domain, we compute a probability space on
which to evaluate hits. This is done with a naïve Bayes classifier. Note that the computation of such a probability space depends on an appropriate generation of positive and negative sequences on which evaluate models for a domain.
2. CLADE machine-learning algorithm cannot be used for protein fragment identification. Indeed, CLADE works well with the full domain annotation of known
genomes. In its design, it explicitly considersE value,
hit length, consensus on multiple domain hits and clade-specific hits. On the other hand, read
annotation should be less sensitive to sequence errors and hit length and should disregard the species the sequence comes from. In MetaCLADE, we do not use a SVM combining the above characteristics but instead we create a simpler pipeline of hit selection. 3. DAMA, the tool used in CLADE to reconstruct
protein architectures, cannot be used on short reads. Indeed, reads might be long enough to contain at most one adjacent pair of domains and certainly cannot provide information to evaluate the
contextual annotation of a domain within a potential domain architecture. In MetaCLADE, knowledge of adjacent pairs of domains could be considered but we left it for future developments.
Conclusion
MG and MT datasets have been explored mostly to learn about which and in what abundance species are present in the community. Learning about the functional activ-ity of the communactiv-ity and its subcommunities is a crucial step to understand species interactions and large-scale environmental impact. Ecological questions, such as how limited availability of abiotic factors in an ocean shape most abundant genes in a community, or how tempera-ture affects eukaryotic phytoplankton growth strategies, for example, can be approached with an accurate domain annotation and a precise functional mapping. In this respect, one might need to zoom into functional activities and metabolic pathways employed by the environmen-tal communities that might involve non-highly expressed genes. This means searching for lowly abundant domains that, through cooperation, might imply important func-tional effects. In order to capture common and rare entities in a given environment, functional annotation methods need to be as precise as possible in identifying remote homology.
generation of new MG/MT data, unknown sequences will augment in number and probabilistic models are expected to play a major role in the annotation of sequences that span unrepresented sequence spaces. This point is clearly shown in our comparison with UProC, which is based on k-mer recognition, and therefore particularly adapted to the identification of already known domain sequences. By construction, UProC approach cannot be successful on unknown diverged domain sequences, a context where probabilistic domain modelling fully reveals its predictive power.
Methods
This section explains MetaCLADE’s methodology and the datasets used in the analyses. The differences between MetaCLADE and CLADE [43] are presented in the “Discussion” section. The time complexity is explained in Additional file1.
The testing datasets were designed to fit current tech-nological characteristics. We considered that Illumina represents nowadays the dominant technology in most sequencing projects. Currently, the HiSeq and MiSeq platforms are able to produce pair-end reads of 150 bp and 300 bp, respectively (with a much higher through-put for the first one). Such fragments in practice might be even shorter after the required low-quality-base trim-ming. For these reasons, we considered testing datasets of reads of increasing lengths. More precisely, we chose 100 bp and 200 bp as read lengths. However, we also chose to test MetaCLADE on simulated 454 fragments (mean length 523 bp) in order to prove its versatil-ity and to show the annotation improvement as read length increases. This test is particularly important in view of the efforts from current technologies to increase read length.
The multi-source annotation strategy and the CLADE library
Widely used search methods based on sequence-profile and profile-profile comparison, such as PSI-BLAST [45], HMMer [47] and HHblits [49], are based on a mono-source annotation strategy, where a single probabilistic model, generated from the consensus of a set of homol-ogous sequences, is used to represent a protein domain. The mono-source strategy typically performs well when sequences are highly conserved. In this case, the consen-sus model captures the most conserved features in domain sequences and it can be successfully used to find new domains in databases of sequences, sharing the same fea-tures as the original sequence. However, when sequences have highly diverged, consensus signals become too weak to generate a useful probabilistic representation and mod-els constructed by global consensus do not characterise domain features properly.
To overcome this fundamental bottleneck, CLADE [43], a domain annotation tool tailored to full genomes, intro-duced a multi-source annotation strategy, where sev-eral probabilistic models are used to represent a protein domain. For each Pfam domainDi, CLADE considers the FULL set of homologous sequencesSiin Pfam [61] asso-ciated toDi, and for some representative sequencessjin
Si (see below), it constructs a model by retrieving with PSI-BLAST [45] a set of sequences similar to sj from
the NCBI NR database. The probabilistic model gener-ated in this way displays features that are characteristic of the sequence sj and that might be very different for
other sequencessk inSi. The more divergent the
homol-ogous domain sequencessj andsk are, the more models
constructed from these sequences are expected to display different features. It is therefore important for a domainDi
to be represented by several models that can characterise its different pathways of evolution within different clades. These probabilistic models are called clade-centered mod-els (CCMs). The multi-source annotation strategy has proven more efficient than the mono-source annotation strategy when applied to full genomes [43]. In particu-lar, due to their closeness to actual protein sequences, CLADE’s CCMs are shown to be more specific and functionally predictive than the broadly used consensus models.
MetaCLADE is based on the multi-source annotation strategy and employs the CLADE library that includes the Pfam sequence consensus models (SCM) and at most 350 clade-centered models (CCM), with an average of 161 models per domain. The representative sequences associated to these models are selected in order to span most of the tree of life, the underlying idea being that evolutionary patterns can be found in species that are very far apart in the tree. This amounts to more than 2.5 millions probabilistic models.
The MetaCLADE’s pipeline
MetaCLADE’s pipeline is illustrated in Fig.1. It is based on two main steps, dedicated to the identification of domain hits and on their selection, and on a pre-computed learn-ing step settlearn-ing domain-specific two-dimensional thresh-olds used in domain selection.
Identification of domain hits
MetaCLADE takes as input a set of MG/MT sequences to be annotated and the CLADE model library. More specif-ically, the input sequences coming from a dataset of reads are expected to be (subsequences of ) open reading frames (ORFs). Alternatively, one can use MetaCLADE on the six reading frame translations of the reads.
to the match, and by a mean-score, that is the bit-score of the hit divided by its length. These two bit-scores are used to evaluate the likelihood of the hit to repre-sent a true annotation (see the “Selection of domain hits” section; for the computation of the likelihood see the “Pre-computed two-dimensional gathering thresholds for domain identification” section).
The output of this first step of MetaCLADE is a set of hits, each one defined by a domain familyD, a prob-abilistic model M associated to D, a bit-score and a mean-bit-score.
Selection of domain hits
The second step of the pipeline filters the set of hits as follows:
1. All pairs of overlapping hits associated to thesame
domain (i.e. the overlap region covers at least 85% of both hit lengths) are processed with the intention of eliminating their redundancy. Therefore, for each overlapping pair, we retain only the best hit (i.e. with the higher bit score). The filtering is realised independently for CCMs and for SCMs.
2. Based on the probability obtained with the naive
Bayes classifier [74] applied to each Pfam domain (see
the “A naive Bayes classifier sets two-dimensional
thresholds for fragmented domains” section),
MetaCLADE retains only those hits whose bit-score is greater than a domain-specific lower bound
identified by the classifier and whose probabilityp of
being a true positive is greater than 0.9. More precisely, such a lower bound is defined as the smallest bit-score of the negative sequences used by the classifier during
its training (see the “Pre-computed two-dimensional
gathering thresholds for domain identification” section).
3. Hits are filtered according to aranking function
based on the bit-score and the identity percentage computed with respect to the model consensus sequence. Specifically, we associate to each hit a real
number in the interval[ 0, 1]representing the
statistical significance of the bit-score. Such a value is then multiplied by the identity percentage of the hit in
order to define theranking score. Therefore, domain
hits are ordered by decreasing values of their ranking scores and iteratively discarded if they share at least 10 residues with some domain with a higher scoring hit. Eventually, this allows us to provide a small architecture (usually involving up to two domains, due to read length) for each annotated sequence.
Note that in the third point, the ranking score com-bines the (statistical significance of the) bit-score and the percentage identity of the match in a product and that these two values are highly correlated. Indeed, one expects
higher bit-scores to be associated to higher sequence iden-tities. This means that when two matches differ strongly on their bit-scores, the respective products will not be affected by the percentage identity of the matches. On the contrary, it is when the bit-scores are close to each other that the percentage identity of the matches will play a role by favouring matches with higher sequence identity. Intuitively, MetaCLADE prioritises bit-scores while let-ting percentage identity play a discriminative role between very close bit-score values.
The output of this filtering step is the ORF annota-tion with non-overlapping domain hits. Due to the short length of the reads, one expects at most two domains per read, possibly flanked by domain fragments on the right and/or the left. Consequently and in contrast to CLADE, there is no reconstruction of the best architecture with DAMA.
Also, note that the first filter is used to reduce the size of the set of domain hits, possibly huge at the beginning due to redundant predictions of the high number of mod-els. The second filter is used to identify hits having a high probability to be true hits, and it constitutes the core of the filtering process. The third filter is used to identify the best solution, among the ones with highest bit-score, based on motif conservation.
As a consequence of the construction of the probabil-ity space for a domain, the second filter asks for domain hits to have a score greater than the smallest bit-score of the negative sequences in the space. This is because negative sequences considered by the classifier are a selected sampling of the space of negatives (see the “Generation of negative sequences” section below); namely, among all negatives generated by the algorithmic procedure, we selected those that lie further away from the origin and that, in consequence, have the highest statis-tical significance. These selected negative sequences tend to group together further from the origin of the space and to lie at the borderline of regions characterised by posi-tive sequences. Hence, one should properly evaluate the acceptance threshold against this specificity.
Pre-computed two-dimensional gathering thresholds for domain identification
classifier [74] , and the statistical procedure is explained below.
Construction of positive and negative training sets
For each domain, MetaCLADE estimates bit-score and mean-bit-score domain-sensitive thresholds. More pre-cisely, it constructs a sequence space for each domain, by defining a set of positive sequences (i.e. actual frag-ments of the domain) and by generating a set of negative sequences (i.e. sequences wrongly annotated with the domain). Ideally, for each domain, one would like to have a training set comprised of a comparable number of positive and negative sequences.
Definition of positive sequences. The training set of positive sequences was constructed as follows. For each domainDiand for each sequence in the Pfam SEED set of homologous sequences forDi, we created a set of prefixes and suffixes of the sequence to simulate small domain por-tions coming from the beginning or the end of the domain sequence that may be found in MG reads. The maximum sizeMof prefixes and suffixes was set to 30% of the entire domain sequence length and to a maximum of 100 aa. Hence, fragments were determined by increasing lengths n·L, whereLis a constant depending on domain size and n = 1, 2, 3. . .N is a multiplicative factor whereN corre-sponds to the smallest integer such thatM ≤ N·L. For domains of length between 15 and 75 aa, the constantL was set at 5 aa, for sizes> 75 aa it was set to 10 aa, and for sizes< 15 aa it was set to 1 aa. For large domains, >270 aa (this corresponds to one standard deviation away from the mean in the distribution of domain model sizes as reported in Additional file1: Figure S1), we expect that reads may lie somewhere in the middle of the domain and therefore we extracted random sequences from the original sequence that were not already covered by small fragmentations of the extremes. Fragment positions were set by randomly choosing their first position along the middle part of the sequence, and fragment lengths were randomly picked from a normal distribution with mean 50 and standard deviation 25. The number of fragments corresponds to ten.
Generation of negative sequences. In order to define a set of negative sequences for each model (CCM or SCM) associated to a domain, we generate a large amount of decoy sequences and select as negatives those where the original domain is identified by the model (with anEvalue <1 for CCMs and a positive bit-score for SCMs).
The algorithm generates first sequences with two differ-ent methods:
1. A random shuffling of the 2-mers of each SEED sequence
2. The reversal of SEED sequences and checks whether they are negatives or not. If the number of negatives reaches at least the 50% of the positive sequences, then the algorithm stops the search. Otherwise, new sequences are generated with a third method: 3. By constructing a Markov model of order 3 for each
domain and by using it to generate random sequences with positional probabilities
Note that in 3, the space of 160,000 204 4-tuples is evaluated by assigning a probability to appear in a domain sequence to each 4-tuple. This is done with a pseudo-count, by considering each 4-tuple to appear at least once and by counting the number of occurrences n of the 4-tuple in the SEED sequences of the domain. The probability of a 4-tuple is set to 160 000n+1+N, whereN is the total number of 4-tuple occurrences in the SEED sequences. The Markov model of order 3 is defined on these probability estimations.
Only generated sequences whose original domain has been correctly identified by PSI-BLAST (for CCMs) with an E value< 1 or by HMMer (for SCMs) with a posi-tive bit-score are considered as negaposi-tive sequences for the MetaCLADE models (CCMs or SCM, respectively) and are included in their training sets. The usage of differ-ent threshold for the two tools, PSI-BLAST and HMMer, is due to the observation that it is easier to produce negatives with PSI-BLAST than with HMMer; therefore, an E value threshold < 1, much more selective than a positive bit-score, would reduce the large number of accepted negatives for CCMs. The statistical significance and the impact of these thresholds on the space of pos-itive and negative sequences is discussed below (see the “A naive Bayes classifier sets two-dimensional thresholds for fragmented domains” section).