Fuel consumption models of MF285 tractor under various field
conditions
Salim Almaliki
1,2, Reza Alimardani
2*, Mahmoud Omid
2 (1. Department of Agricultural Machinery, University of Basrah, Basrah, Iraq;2. Department of Agricultural Machinery Engineering, College of Agriculture and Natural Resources, University of Tehran, Karaj, Iran)
Abstract: Due to the ascending importance of energy in the world, prediction and optimization of Fuel Consumption (FC) in agricultural tasks is merit to consideration. In this study a Massey Ferguson (MF285) tractor was implemented with a low cost and precise data acquisition system as a means to record and monitor the affectual parameters on FC such as forward speed and instant fuel flow rate during field operation. Field experiments were carried out in the experimental farm of Agricultural Engineering Department of Tehran University, Karaj province, Iran, which had loamy soil texture. A mouldboard plow was used as tillage toll during the experiments at various tillage depths, engine speeds, forward speeds, tire inflation pressures, moisture contents and cone indexes. Acquired data were used to elicit an accurate model for Temporal, Area-specific and Specific Fuel Consumption (TFC, AFC and SFC). Results showed considerable effect of all measured parameters on TFC, AFC and SFC. For instance the TFC, AFC and SFC decreased by 11%, 13% and 56% respectively when the cone index increased from 105 to 1161 kPa. And also augmenting tillage depth from 10 to 20 cm led to 44% increase of TFC while SFC decreased by 164% oppositely. AFC rate was 1.1 liter per cm of tillage depth. Increasing the engine speed from 1200 to 2000 r/min led to increase of TFC, AFC and SFC by 56%, 71% and 46%, respectively. The forward speed was the most influential parameter on TFC, AFC and SFC while the moisture content and tire inflation pressure effects were minor. Models validation was acceptable and the fuel consumption rate could be predicted with accuracy of about 95%.
Keywords: fuel consumption, Massey Ferguson (MF285), modelling, data logging system
Citation: Almaliki, S., R. Alimardani, and M. Omid. 2016. Fuel consumption models of MF285 tractor under various field conditions. Agricultural Engineering International: CIGR Journal, 18(3):147-158.
1 Introduction
1Fuel Consumption (FC) in agricultural vehicles is a
factor that concerns the farmer in order to search for
information about maintenance and optimization of the
vehicle use. Fuel is the source of energy for most of
agricultural vehicles including tractors and provides the
required power for performance and propelling the tractor
to overcome implement draught (Smith, 1993). FC is
directly related to the energy requirements of agricultural
tasks and may be reduced by proper understanding of
how the tractor power is distributed. An improvement in
tractor performance will result in a diminished amount of
Received date: 2016-04-09 Accepted date: 2016-06-25
*Corresponding author: Reza Alimardani, Department of Agricultural Machinery Engineering, College of Agriculture and Natural Resources, University of Tehran, Karaj, Iran. Email: rmardani@ut.ac.ir.
depleted fuel for a certain operation and thereby leads to
both environmental and financial benefits. Ability to
anticipate the performance of tractors during field
operations has been of great interest to scientists,
manufacturers, and users in order to optimize the total
operation (Grisso et al. 2006). Hence predicting tractor FC
can lead to more appropriate decisions on tractor
management. Several studies have been developed for
predicting FC in diverse sections in agricultural
operations which use power like draught, tillage
implements and tire resistance (Al-Janobi, 2000; Sahu
and Raheman, 2006; Serrano et al., 2003, 2007). Grisso et
al. (2006) developed a new method for predicting FC for
individual tractors. Their results showed that about 88%
of the tested tractors had an improved prediction with the
new methodology. The FC during soil tillage operations
varies widely due to various parameters that affect the FC
four wheel drive), tractor size and implements.
Depending on the soil strength the FC increases by 0.5 to
1.5 L/ha per centimeter of ploughing depth (Filipović et
al., 2004; Moitzi et al., 2006). Therefore, tractor FC is
not constant and varies in different situations so it can be
reduced through proper matching of related parameters
(McLaughlin et al., 2008). Reducing fuel consumption
in cropland agriculture is a complex and multifactorial
process, where farm management plays a key role (Safa
et al., 2010). Many researchers believed the increasing of
overall energy efficiency for tractor and implements and
correct matching of tractor and agricultural machinery
can be effective in decreasing FC (Samiei Far et al.,
2015). Engine speed and load characteristics are other
parameters which FC of the tractor is highly depended on.
Usually, the most productive and cost-effective work is
obtained when the engine load is less than 80% of its
rated power and the engine speed does not exceed 80% of
its rated speed (Zoz and Grisso, 2003; Janulevicˇius et al.,
2013).
Fathollahzadeh et al. (2010) developed a fuel
consumption model for a John Deere 3140 tractor at
various working depths of mouldboard plough. They
reported a linear relationship between fuel consumption
and working depth of the mouldboard plough. Reports
from literature indicate that about 20% to 55% of the
available tractor energy is wasted wears at the tractive
device-soil interface. This energy wears the tires and
compacts the soil to a degree that may cause detrimental
crop production (Zoz and Grisso, 2003).Mileusnic´ et al.
(2010) analyzed the FC of new and old tillage systems
and compared them. They reported that by taking
advantage of the new technical solutions in tillage
mechanization systems and the new technological
variants in the tillage process, the systems consume
significantly less energy compared to the older systems.
AL-Hamed et al. (2013) presented an algorithm to
minimize the required energy by a task. The algorithm
uses three-dimensional representations of the field
characteristics to obtain the optimum tracks angle to
minimize energy consumption. Moitzi et al. (2014)
studied the effect of different working depths on FC,
wheel slip, field capacity and specific energy
consumption. Their results showed that the
Area-specific Fuel Consumption (AFC) increased linearly
with working depth for both the mouldboard plough and
the short disc harrow and also wheel slip was
proportional to the FC and reversely proportional to field
capacity performance at all depths. In a separate
experiment they studied the influence of the engine speed
on FC in a universal-cultivator and they reported an
increase of engine speed from 1,513 r/min to 2,042 r/min
which resulted in an increase of 80% for the Temporal
Fuel Consumption (TFC) and 35% for the AFC
(Adewoyin and Ajav, 2013; Moitzi et al., 2006). Efficient
operation of farm tractors includes: (a) maximizing fuel
efficiency of the engine and mechanical efficiency of the
drive train; (b) maximizing attractive advantage of
traction devices; and (c) selecting an optimum travel
speed for a given tractor‐implement system (Grisso et
al., 2008). Therefore, precise and accurate performance
modeling of tractors and implements based on effectual
parameters is crucial for farmers as well as manufacturers
due to increased emphasis on fuel conservation. But
measurement of parameters needs a rather complex and
expensive measurement and also scrutinize
instrumentation. Singh and Singh (2011) developed a
computerized instrumentation system for monitoring the
tractor performance in the field. The system was intended
to be used for the compilation of a database of draft
requirements of tillage implements. However, extraction
of an accurate model required a precise instrumentation
and also a reasonable algorithm for data fusion. On the
other hand, accuracy of instrumentation is proportionally
connected with the expenditure and that will be a limiting
factor. So, a sensible model must compromise between
costs and accuracy i.e. an optimized point for costs and
accuracy of measurement instruments. The objectives
(1) Development of models to predict fuel consumption
(TFC, AFC and SFC) of tractor (Massey Ferguson) at
different conditions (tillage depths, engine speeds,
forward speeds, tire inflation pressure, moisture content
and cone index) utilizing Design Expert software
(www.statease.com).
(2) Implementation of a low cost, precise and
easy-to-install instrumentation package to monitor and
record effective parameters on prediction models include:
actual and theoretical velocities, slippage, FC rate,
drawbar pull and tillage depth.
2 Materials and methods
2.1 Field experiments
Experiments were carried out in the experimental
farm of Agricultural Engineering Department of Tehran
University located in 3 km south west of the Karaj
province. The soil at the experimental site has loamy
texture (31.94% sand, 43.79% silt, and 24.27% clay). In
this research, a conventional tillage system which
includes a mouldboard plow with three furrows (width of
mouldboard was 100 cm) was used for collecting data
from Massey Ferguson tractor (Model MF285) and the
specifications of tractor were shown in Table 1.
2.1 The experiment parameters
The experiments were carried out in the field with
different conditions using three engine speeds, four
tractor forward speeds (as shown in Table 2), three depths
of mouldboard plow and three tire inflation pressures.
These parameters were used at two levels of moisture
contents and four cone indexes of soils as shown in Table
3. All experiments had three replications resulting in a
total of 1293 tests.
Table 2 Measured velocity, m/s
Engine Speed, r/min
Gear
1st 2nd 3rd 4th 1200 0.39 0.56 0.79 1.09 1600 0.48 0.67 0.95 1.28 2000 0.61 0.90 1.2 1.56
Table 3 Input parameters used in experiments
Depth, cm
Inflation pressure, kPa
Engine speed, r/min
Moisture content, %
Cone
index, kPa Gear 10 50 1200
6 160 1
st
15 100 1600 1160 2nd 20 150 2000
23 100 3
rd
930 4th
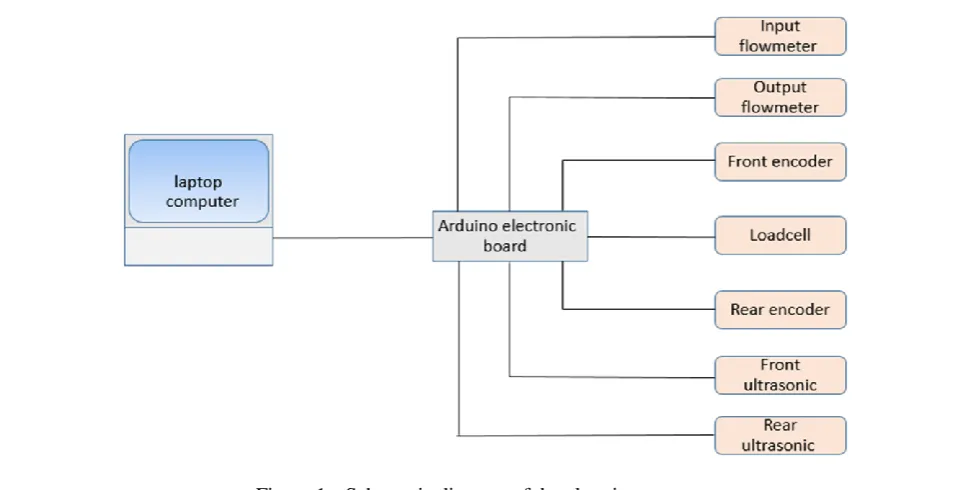
2.3 Transducers and data logging system
An instrumentation package for measuring the
tractor performance was developed. This package
included the data logging system and the transducers for
measuring fuel consumption, actual velocity, theoretical
velocity, drawbar pull and plow depth. The data logging
system consisted of an Arduino electronic board (which is
a simple microcontroller board, open source, more
modern, cheaper, and easier to use than the designs
available at that moment) and portable computer (laptop)
linked via a USB port. Specifications of the
instrumentation used in the package are listed in Table 4.
Data were sampled at 50 ms intervals. Table 1 Specifications of Massey Ferguson MF285
The theoretical velocity-sensing unit was mounted
on the left axle side of the tractor. Sensing unit comprises
of an encoder sensor (Autonics, South Korea) and two
involved gears; an eight teeth gear installed on the
encoder’s shaft and another gear fixed to the inner side of
rear wheel flange which makes 13.125 gear ratio. The
encoder sensor was attached on the rear axle housing,
using a special made nearby mounting bracket. The
encoder sensor generates 360 pulses per revolution and
by taking gear ratio into account, each revolution of rear
tire will produce 4725 pulses. Hence, in accordance with
the rear tire diameter each pulse would indicate 1
millimeter of the tractor movement. The actual velocity
was measured using another encoder (Autonics, South
Korea) fixed to the front wheel flange. As there were
different gear ratios as well as tire size in front wheel,
since the smaller diameter front tire thus each pulse is
equal to 0.6 millimeter of the tractor movement.
The velocity data were sent to the data logging and
processing unit in order to calculate the wheel slippage.
The following Equation was used to calculate the slip
percentage:
(1)
The fuel consumption at each tillage operation was
measured by two flow sensors. The first one
(VISION-1000, Remag, Bern, Switzerland) had a range
of 0.1-2.5 l/minaccommodated between the fuel filter and
the injector pump of the tractor for measuring input fuel
to injector pump and the other (RS256-225) on by-pass
line for measuring the extra fuel returning to the fuel tank.
These sensors were calibrated by counting the generated
pulses during flow of a known volume (100 ml) of diesel
fuel.
In this study, the characteristics of the fuel
consumption of the engine farm tractor were expressed in
three terms as follows:
(1) Temporal Fuel Consumption [TFC (L/h)]:
Which represents the amount of fuel consumed for
the unit of time according to the following Equation:
(2)
where:
fc = amount of fuel consumed, L; T = time taken, h;
(2) Area-specific Fuel Consumption [AFC,
L/ha]: Which represents the amount of fuel
consumed to cover an area of one hectare and
calculated according to the following Equation:
(3)
W= implement working width, m ; Va = actual velocity, m/s;
(3) Specific Fuel Consumption [SFC,
kg/kW.h]: Which represents the amount of fuel Table 4 Specification of instrumentation utilized
Name of transducer Specification Manufacture Use for VISION-1000 0.1- 2.5 l/min (22000 pulse per liter) ±
3%
Remag, Bern, Switzerland
input fuel consumption to injection pump
turbine type model (RS256-225)
0.1-3 l/min 1200 pulse per liter ± 1.5%
China output fuel from injection pump to tank
E5S8-360-6-1- 360 pulses per revolution ±5% Autonics, South Korea
Actual and theoretical velocity.
Load cell model
H3-C3-3.0t-6B-D55 S type 0- 30 kN ±0.1% Zemic-China draft force Ultrasonic distance sensor
(HY-SRF05)
Detection distance: 2 cm-450 cm.
High precision: Up to 0.2cm China depth plowing Electronic board Arduino
Atmega2560
Digital I/O Pins54 (of which 15 provide PWM output)
Analog Input Pins 16 Clock speed 16 MHz
consumed during a specified time on the basis of the
drawbar power available at the drawbar, it was
calculated from the following Equation:
(4)
Pdb = drawbar power required for the implement,
kW.
Drawbar power was evaluated using the relation
between draft and travel speed as follows:
(5)
where, NT is net traction, kN.
The drawbar load cell was an S shaped (Model
H3-C3-3.0t-6B-D55 from Zemic with capacity of 30kN)
mounted between two tractors. The first one was a
Massey Fergusson 285 as puller and the other one was
Massey Fergusson 165 as towed. The force exerted by the
implement is measured by a strain gauge Wheatstone
bridge arrangement. The load cell was calibrated by
means of a hydraulic loading calibration device (Model
INSTRON).
Two ultrasonic distance sensors (HY-SRF05) were
attached to the left side of the frame of the plow to
measure tillage depth accurately in reference of
undistributed and flat terrain. These sensors were fixed at
the front and the rear of the plow’s frame to overcome the
fluctuation that occurs in the horizontal plane of the plow.
The average of sensors distance has been considered as
the depth of the plow. The detailed electronic circuit
diagram for measuring performance parameters and
displaying them on the portable computer screen is given
in Figure 1.
3 Result and discussion
A total of 1293 tests (431 different tests with 3
replications) were performed for finding appropriate
models of fuel consumption including Temporal Fuel
Consumption, Area-specific Fuel Consumption, and
Specific Fuel Consumption for Massey Ferguson tractor
(MF285). After averaging treatments, for choosing more
accurate or more reliable models, a set of different
polynomial models were compared with Design Expert
software. The quadratic model was chosen with respect to
a good trade-off between the highest coefficient of
determination, the lowest standard deviation, P-value and
degrees of freedom. Finally, in order to optimize and
reduce the number of candidate regressors, a stepwise
regression algorithm, as a most widely used variable
selection technique (Montgomery and Runger, 2014), was
3.1 Temporal Fuel Consumption (TFC)
ANOVA Table was carried out using Design Expert
software to determine the level of significance of effect of
the moisture content, tire pressure, cone index, tillage
depth, engine speed and the forward speed on Temporal
Fuel Consumption (Table 6).
Table 6 Analysis of variance table for Temporal Fuel
Consumption
Results indicated each of these parameters had a
highly significant effect on the TFC at various probability
values (lower than 0.05). Also, the results revealed
augmented TFC with increasing the moisture content, tire
pressure, depth of tillage, engine speed and forward speed
whereas the results of TFC were counteractive with
increasing cone index. The Figure 2a-c shows the
interactions influence of the depth of tillage-engine speed,
depth of tillage-forward speed and cone index-engine
speed on TFC. TFC decreased by 11% when the cone
index increased from 105 to 1161 kPa, this is due to
increase of soil strength with increasing cone index which
leads to reducing the energy lost due to slip and rolling
resistance thus reduce fuel consumption. The results
demonstrated a linear relationship between TFC with
depth of tillage and engine speed. TFC increased by 44%
when the depth of tillage increased from 10 to 20 cm while
increasing the engine speed from 1200 to 2000 r/min
increased fuel consumption by 56%. In other hands, the
greatest TFC is reached at a depth of 20 cm and engine
speed of 2000 r/min. This finding is supported by other
researchers (Adewoyin and Ajav, 2013; Moitzi et al.,
2006; Moitzi et al., 2014). The results also showed an
increase of TFC by 61% when the forward speed goes
from 0.39 m/s to 1.56 m/s. The overlap effect between
forward speed and tillage depth on TFC appeared greater
impact on rising of fuel consumption where record 12.23
L/h at forward speed 1.56 m/s and depth 20 cm. Figure 3a
shows the perturbation plot of parameters affecting on
TFC. The perturbation (or trace) plot facilitated to contrast
the impact of all the independent variables at a particular
point, at the midpoint (coded 0) of all the factors, in the
design space. The results revealed that the most influential
factor in fuel consumption is the forward speed, followed
by the engine speed, depth of tillage and cone index, while
the effect of inflation pressure of tire and soil moisture are
the lowest among the effective factors. Figure 3B shows
the scatter plot of actual values of TFC vs. predicted
values using final model.
Source Sum of
Squares df F-Value
p- value Prob > F Model 0.41 9 704.41 < 0.0001 MC 0.00062 1 9.66 0.0020 CI 0.0079 1 122.65 < 0.0001 Pr 0.00029 1 4.55 0.0335 Depth 0.04 1 626.55 <0.0001 Vt 0.08 1 1829.35 < 0.0001 ES 0.12 1 1269.30 < 0.0001 CI-ES 0.00074 1 11.57 0.0007 Depth-Vt 0.0020 1 31.38 < 0.0001 Depth-ES 0.01 1 174.91 < 0.0001 Residual 0.02 422
Cor Total 0.44 431
Table 5 Summary of statistics of reduced quadratic models
Response of interest
Standard
deviation Mean C.V. % R-Squared Adj R-Squared
Degrees of freedom
The appropriate model for the Temporal Fuel
Consumption TFC (Liter/hour) is represented in Equation
6, in which the coefficients are in the coded unit form.
(TFC) -1.06 = +0.38 -0.00015*MC +2.41E-005*CI-
2.15E-005*Pr-0.0079*depth-0.02*Vt
-0.00012*ES-8.90E-009*CI*ES-0.0018*depth*Vt+4.46E
-006*depth*ES. (6)
3.2 Area-specific Fuel Consumption (AFC)
AFC affected significantly with tire inflation pressure,
cone index moisture content, tillage depth engine speed,
and forward speed (Table 7). The results showed a direct
correlation between AFC with both of the moisture content
and the engine speed and the depth of tillage in Figure 4a
to 4d. In terms of AFC increased to 11 liters per hectare
when increasing the depth of tillage from 10 to 20 cm with
an average of 1.1 liter per cm of tillage depth. Furthermore
AFC increased by 71% when increasing the engine speed
from 1200 to 2000 r/min. The results also indicated the
reverse effect for both forward speed and cone index to
AFC. The AFC decreased 2.9 L/ha when increasing the
cone index from 105 to 1160 kPa, this goes back to
increased ability of tractor to take advantage of the
available power at the wheels with the increase in soil
strength. AFC is reduced by 96% when the forward speed
increased from 0.39 to 1.56 m/s where increase in forward
speed leads to reduce the time required to accomplish the
work required (tillage operation). The results also
indicated the effect of interactions among the studied Figure 2 (a) Interaction between Engine Speed-Depth, (b) Theoretical Velocity-Depth and (c) Cone Index-Engine
Speed for the Temporal Fuel Consumption
parameters on AFC where occurred the largest increase in
AFC by 48 liters per hectare with the depth of tillage 20
cm and forward speed 0.39 m/s. In general, the forward
speed is the most influential factor on AFC, followed by
the engine speed, the depth of tillage, tire inflation
pressure and moisture content respectively (Figure 5a).
Moreover, the scatter plot of actual values of AFC vs.
predicted values using final model are displayed in Figure
5b.
Table 7 Analysis of variance table for Area-specific
Fuel Consumption
Source Sum of Square df F-Value p-value Prob > F Model 0.32 10 479.13 < 0.0001 MC 0.00056 1 8.39 0.0040 CI 0.01 1 274.51 < 0.0001 Pr 0.0024 1 36.06 < 0.0001 Depth 0.08 1 1233.57 < 0.0001 Vt 0.19 1 2820.81 < 0.0001 ES 0.11 1 1609.66 < 0.0001 CI×Depth 0.00027 1 4.13 0.0426 Depth×Vt 0.0070 1 104.19 < 0.000 Depth×ES 0.0070 1 104.75 < 0.0001 Vt×ES 0.03 1 526.43 < 0.0001 Residual 0.02 421
Cor Total 0.35 431
`
Figure 4 (a) Interaction between Engine Speed-Depth, (b) Cone Index-Depth, (c) Depth-Theoretical Velocity,
The fitted equation for the Area-specific Fuel
Consumption AFC (liter/hectare) is represented in
Equation 7, in which the coefficients are in the coded unit
form.
(AFC) -0.42 =
+0.22-0.00013*MC+7.90E-006*CI-5.81E-005*Pr-0.006
1*depth+0.25*Vt-2.21E-005*ES+4.23E-007*CI*depth-0
.0032*depth* Vt+3.36E-006 * depth -8.74E-005*Vt * ES.
(7)
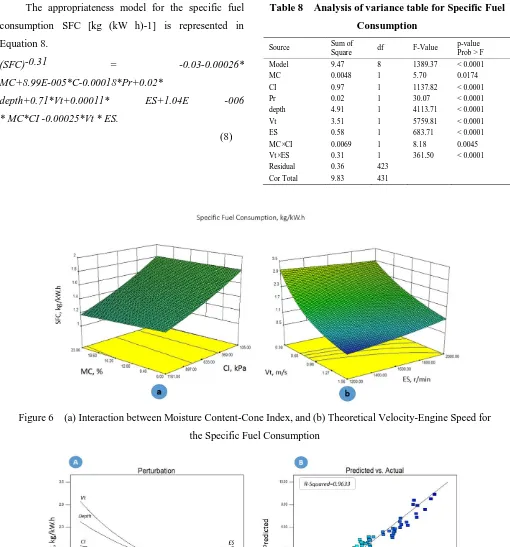
3.3 Specific Fuel Consumption (SFC)
It can be intrepreted from Table 8 that all studied
parameters had significant effect on SFC, however,
interactions among these factors did not effect the SFC
significantly, except moisture content-cone index and
engine speed-forward speed in Figure 6a to 6b. Relative
importance of the factors are shown in perturbation plot
Figure 7A. This figure represents a positive relationship
between moisture content, tire inflation pressure and
engine speed with the SFC. On the other hand, cone index,
depth of tillage and forward speed effected the SFC,
inversely. The forward speed was the most influential
factor on the specific fuel consumption, so that increasing
forward speed from 0.39 to 1.56 m/s reduced the SFC by
233%. Increased drawbar power as a result of more
forward speed caused a meaningful reduction on SFC
followed by the depth of tillage, cone index, engine speed,
tire inflation pressure and soil moisture, respectively. The
effect of increasing depth of tillage from 10 to 20 cm led
to a decrease in SFC by 164% and this is due to the
increase in the ratio of achieved drawbar power that
resulting from the increase of the depth of tillage which is
greater than the rate of TFC (liter per hour). The rate of
decline in SFC was up 56% when increasing cone index
from 104 to 1160 kPa. This return to diminishing fuel
consumed due to decreasing slip and rolling resistance
with increasing cone index, which is the indicator of the
strength of the soil. The results also showed that
increasing the engine speed from 1200 to 2000 r/min led
to the increase of SFC by 46%. This is due to the rate of
TFC which is greater than the increase power resulting
from the engine speed. The cause of increase in SFC with
the increase in both moisture content and tire pressure is
to increase the slippage, which leads to reduced forward
speed then drawbar power, which reflects a rise in SFC.
Moreover, the scatter plot of actual values of SFC vs.
predicted values using final model are displayed in Figure
7B.
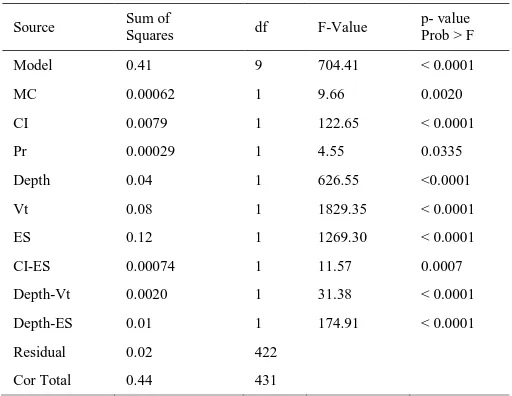
The appropriateness model for the specific fuel
consumption SFC [kg (kW h)-1] is represented in
Equation 8.
(SFC)-0.31 = -0.03-0.00026*
MC+8.99E-005*C-0.00018*Pr+0.02*
depth+0.71*Vt+0.00011* ES+1.04E -006
* MC*CI -0.00025*Vt * ES.
(8)
Table 8 Analysis of variance table for Specific Fuel
Consumption
Source Sum of
Square df F-Value
p-value Prob > F Model 9.47 8 1389.37 < 0.0001 MC 0.0048 1 5.70 0.0174 CI 0.97 1 1137.82 < 0.0001 Pr 0.02 1 30.07 < 0.0001 depth 4.91 1 4113.71 < 0.0001 Vt 3.51 1 5759.81 < 0.0001 ES 0.58 1 683.71 < 0.0001 MC×CI 0.0069 1 8.18 0.0045 Vt×ES 0.31 1 361.50 < 0.0001 Residual 0.36 423
Cor Total 9.83 431
4 Conclusion
Fuel consumption in three forms of TFC, AFC, and
SFC is significantly affected by the studied factors
(tillage depth, moisture content, tire inflation pressure,
cone index, engine speed and forward speed). With
increasing the tillage depth, the drawbar pull rises as well Figure 6 (a) Interaction between Moisture Content-Cone Index, and (b) Theoretical Velocity-Engine Speed for
the Specific Fuel Consumption
as the slip. The result is an increased fuel consumption
rate of TFC and AFC, whereas SFC is reduced.
Increasing engine speed, tire pressure and moisture
content led to increased fuel consumption of three forms
(TFC, AFC and SFC). The results obtained from this
study indicate reducing of the TFC, AFC and SFC with
incrementing the cone index. With increasing forward
speed, TFC increases whereas AFC and SFC reduce. The
effect of interactions among studied factors in this
experiment was to determine their impact on fuel
consumption (TFC, AFC and SFC). The results also
demonstrated relative importance of these parameters in
their effects on fuel consumption. The forward speed was
the most influential parameter on the specific fuel
consumption (TFC, AFC and SFC) while the moisture
content and tire inflation pressure had lowest influence.
The appropriate models for the fuel consumption in three
forms (TFC, AFC and SFC) were obtained from 431
experiments. The models validation was acceptable.
Consequently, the fuel consumption rate magnitudes
could be successfully predicted by the proposed models
with high accuracy (P > 0.05).
Acknowledgement
The authors wish to thank all of the Iraqi Ministry
of Education, Basrah University and Department of
Agricultural Machinery Engineering, College of
Agriculture and Natural Resources, University of Tehran,
Karaj, Iran for providing necessary funds and research
facilities required for this investigation.
References
References
Adewoyin, A. O., and E. A. Ajav. 2013. Fuel consumption of some tractor models for ploughing operations in the sandy-loam soil of Nigeria at various speeds and ploughing depths. Agricultural Engineering International: CIGR Journal, 15 (3):
67-74.
Al-Hamed, S. A., M. F. Wahby, S. M. Al-Saqer, A. M. Aboukarima, and A. A. Sayedahmed. 2013. Artificial neural network model for predicting draft and energy
requirements of a disk plow. Journal of Animal and Plant Sciences, 23(6): 1714-1724.
Al-Janobi, A. 2000. A data-acquisition system to monitor performance of fully mounted implements. Journal of Agricultural Engineering Research, 75(2): 167-175. Fathollahzadeh, H., H. Mobli, A. Rajabipour, S. Minaee, A. Jafari,
and S. M. H. Tabatabaie. 2010. Average and instantaneous fuel consumption of Iranian conventional tractor with mouldboard plow in tillage. ARPN Journal of Engineering and Applied Sciences, 5(2): 30-35.
Filipović, D., S. Kosutić, and Z. Gospodarić. 2004. Energy efficiency in conventional tillage of clay. The Union of Scientists Rousse: Energy Efficiency and Agricultural Engineering. 3-5. June 2004. Rousse. Bulgaria. 85-91. Grisso, R. D., G. T. Roberson, D. H. Vaughan. 2006. Method for
fuel prediction for specific tractor models. ASABE Paper No. 061089. St. Joseph, Mich.: ASABE.
Grisso, R. D., D. H. Vaughan, and G. T. Roberson. 2008. Fuel prediction for specific tractor models. Applied Engineering in Agriculture, 24(4):423-428.
Janulevicˇius, A., A. Juostas, and G. Pupinis. 2013. Tractor‘s engine performance and emission characteristics in the process of ploughing. Energy Conversion and Management, 75: 498-508.
McLaughlin, N. B., E. G. Gregorich, L. M. Dwyer, and B. L. Ma. 2002. Effect of organic and inorganic soil nitrogen amendments on mouldboard plow draft. Soil and Tillage Research, 64(2002): 211-219.
McLaughlin, N. B., C. F. Drury, W. D. Reynolds, X. M. Yang , Y. X. Li, T. W. Welacky, and G. Stewart. 2008. Energy inputs for conservation and conventional primary tillage implements in a clay loam soil. Transactions of the ASABE, 51(4): 1153-1163.
Mileusnić, Z. I., D. V. Petrović, and M. S. Dević. 2010. Comparison of tillage systems according to fuel consumption. Energy, 35(1): 221-228.
Moitzi, G., H. Wagentristl, K. Refenner, H. Weingartmann, G. Piringer, J. Boxberger, and A. Gronauer. 2014. Effects of working depth and wheel slip on fuel consumption of selected tillage implements. Agricultural Engineering International: CIGR Journal, 16(1): 182-190.
Moitzi, G., H. Weingartmann, and J. Boxberger. 2006. Effects of tillage systems and wheel slip on fuel consumption. The Union of Scientists Rousse: Energy Efficiency and Agricultural Engineering. 7. - 9. June 2006. Rousse. Bulgaria. 237-242.
Safa, M., S. Samarasinghe, and M. Mohssen. 2010. Determination of fuel consumption and indirect factors affecting it in wheat production in Canterbury, New Zealand. Energy, 35(12): 5400-5405.
Sahu, R. K., and H. Raheman. 2006. Draught prediction of agricultural implements using reference tillage tools in sandy clay loam soil. Biosystems Engineering, 94(2): 275-284.
Samiei Far, A., N. Kazemi, M. Rahnama, M. Ghasemi Nejad. 2015. Simultaneous comparison of the effects of shaft load and shaft positions on tractor OEE in two soil conditions (cultivated and uncultivated). Int. J. Farm Allied Sci., 43(2015): 215-221.
Serrano, J. M., J. O. Peca, A. Pinheiro, M. Carvalho, M. Nunes, L. Ribeiro. 2003. The effect of gang angle of offset disc
harrows on soil tilth, work rate and fuel consumption. Biosystems Engineering, 84(2): 171-176.
Serrano, J. M., J. O. Peca, J. M. Silva, A. Pinheiro, and M. Carvalho. 2007. Tractor energy requirements in disc harrow systems. Biosystems Engineering, 98(3): 286-296. Smith, L. A. 1993. Energy requirements for selected crop production implements. Soil and Tillage Research, 25(4): 281-299.
Singh, C. D., and R. C. Singh. 2011. Computerized instrumentation system for monitoring the tractor performance in the field. Journal of Terramechanics, 48(5): 333-338.
Zoz, F. M., and Grisso R. D. 2003. Traction and Tractor Performance. ASAE distinguished lecture Series No.27. ASAE, St. Joseph, MI, 49085-9659, USA.
Nomenclature
AFC [L/ha] Area-specific Fuel
Consumption S [%] Slip
CI [kPa] Cone index value SFC [kg/kW.h] Specific Fuel
Consumption
ES [rpm] Engine speed T [sec] Time
fc [L or kg] Amount of fuel consumed TFC [L/h] Temporal Fuel Consumption
MC [%] Moisture Content Va [m/sec] Actual velocity
NT [kN] Net traction Vt [m/sec] Theoretical
velocity
Pdb [kW] Drawbar Power W [m] Implement
working width