Effect of spade angle and spading frequency of spading machine on
specific soil resistance and pulverization
Ritu Dogra
1*, Baldev Dogra
1, Pawan Kumar Gupta
1, Banarsi Dass Sharma
2,
Ajeet Kumar
1(1. Department of Farm Machinery and Power Engineering, Punjab Agricultural University, Ludhiana, Punjab, India; 2. Department of Soil Science, Punjab Agricultural University, Ludhiana, Punjab, India)
Abstract: The effect of spade angle and spading frequency on various dependent variables, i.e. specific soil resistance encountered, energy consumed per unit volume of soil moved, weighted mean clod size, soil bulk density, soil cone index and cone index ratio were studied. The experiments were conducted in soil having 15.7% clay, 53.6% silt, and 30.7% sand. During experimentation, moisture content of soil was maintained between 13% and 14%. The spade angles used were A1 (0°), A2 (15°) and A3 (30°). Four levels of bite lengths viz. 4, 6, 8 and 10 cm at travel speed of 18.47 cm s-1 were selected for the study. These
corresponded to four levels of spading frequencies namely F1 (1.85 cycles s-1), F2 (2.31 cycles s-1), F3 (3.08 cycles s-1) and F4
(4.62 cycles s-1). The spading frequency was determined by dividing the travel speed by the bite length. The dependent
variables decreased with increase in spade angle and spading frequency. However, the cone index ratio increased with increase in spade angle and spading frequency. Therefore, for maximum pulverization and optimal specific soil resistance and energy consumption, larger spade angle and higher spading frequency were considered to be desirable.
Keywords: spading machine, spade angle, spading frequency, degree of pulverization
Citation: Dogra, R., B. Dogra, P. K. Gupta, B. D. Sharma, and A. Kumar. 2017. Effect of spade angle and spading frequency of spading machine on specific soil resistance and pulverization. Agricultural Engineering International: CIGR Journal, 19(1): 65–73.
1 Introduction
Tillage is a major farming operation for seedbed
preparation. Tillage involves various physical actions but
most important is breaking apart of the monolith soil
surface (Singh and Singh, 1986). Energy required to force
a tillage tool through the soil is used to overcome the
mechanical strength of the soil and to cause displacement,
which resulted in compaction or break-up (Gill, 1969).
Rotary tillers are popular machines for tillage in one go.
But, the rotary tillers consumed more energy than
conventional tillage implement. However, degree of
pulverization or tillage efficiency varied considerably in
terms of seed germination with these tillage tools. Spading
machines could be an alternative. Spading machine is a
Received date: 2015-11-16 Accepted date: 2016-06-02 * Corresponding author: Ritu Dogra, Department of Farm Machinery and Power Engineering, Punjab Agricultural University, Ludhiana, Punjab-141004, India. Email: [email protected].
PTO driven implement designed to approximate the effect
of proven smaller-scale hand digging tool for the purpose
of deeper aeration, and effective integration of organic
matter. It has been claimed that their action subtly
aerated/fractured the subsoil twice the depth of the stroke
of the spades (Manfred, 2002). The advantage of this
machine had been that it did not form any hardpan as the
path of the tools in the soil is never parallel to the soil
surface. An attempt had been made to develop a spading
machine having non interactive tool path of blade back
surface with uncut soil (Sambhi, 2006). The machine was
evaluated with straight flat blades whereas the manual
spades consisted of a long stick and a small blade with
different shapes and angle that had been used for tillage
purpose through ages. Soil bin studies were carried out to
define the effect of blade widths (Bishnoi, 2008). The
spade angle is also an important factor. It is expected to
reduce initial impact thereby reducing energy requirement
effect of spade angle and spading frequency on
performance of spading machine.
2 Materials and methods
2.1 Location
The study was conducted in the department of Farm
Machinery and Power Engineering, PAU Ludhiana,
Punjab, India.
2.2 Soil
The experiments were conducted on cultivable soil
having 15.7% clay, 53.6% silt, and 30.7% sand in the soil
bin.
2.3 Experimental design and methods
Factorial Randomized Block Design was selected to
conduct the experiments and to analyse the effect of the
study variables. Each experiment was replicated thrice.
The effect on various dependent variables i.e. specific soil
resistance encountered, energy consumed per unit volume
of soil moved, weighted mean clod size, soil bulk density,
soil cone index and cone index ratio (Ratio of sum of area
of Cone index initial divided by sum of area of cone index
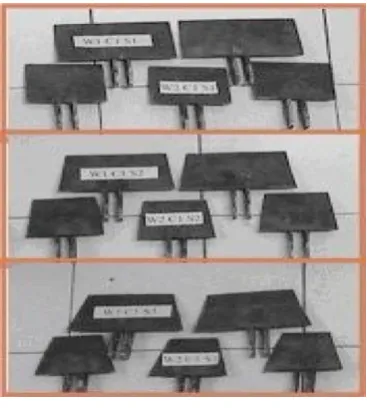
after treatment) had been studied. There were three spade
angles (Figure 1), two spade widths and four spading
frequencies with three replications: A1 (straight), A2 (15°)
and A3 (30°); W1 (10 cm) and W2 (15 cm); F1 (1.85
cycles s-1), F2 (2.31 cycless-1), F3 (3.08 cycles s-1) and F4
(4.62 cycles s-1).
Figure 1 Views of spading blades used for the study
2.4 Soil bulk density
Soil bulk density was determined before and after
tillage treatments using core sampler drawn randomly
from the individual test plots.
2.5 Weighted mean clod size
The clod size distribution was expressed in terms of
mean mass diameter (MMD) calculated in accordance with
the procedure explained in the Test Code and Procedure
for Rotary Tillers (Part 2) (RNAM, 1983) as given below.
MMD = 1/W (D1A+ D2B+D3C+ … + DnN)
where, MMD is mean mass diameter of soil clods; D1, D2,
D3, …, Dn is representative diameter of soil clods retained
on a particular sieve; A, B, C, …, N is mass of soil retained
on a particular sieve; W is total mass of soil sample. A set
of sieves for sieve analysis included 100, 63, 40, 20, 10,
4.75, 2, 1, 0.600, 0.425, 0.212, 0.150 and 0.075 mm sizes.
Samples were drawn from a sufficiently large area of each
test plot to give a representative value for MMD.
2.6 Soil cone index
Soil cone index was determined (Figure 2) to measure
penetration resistance of the soil before and after applying
various treatments at working section of the soil along the
length of soil-bin. Cone size was 315 mm2 base area and
21 mm diameter (Anon, 2004). Cone penetrometer used
model C 1851 and was made by ESS BEE Universal.
Figure 2 Set-up for measuring cone index in soil bin
2.7 Soil moisture content
Soil moisture content was determined gravimetrically.
Samples were obtained using core sampler and oven dried
at 110±5°C for 24h (Anon, 1973). During experimentation
moisture content of soil was maintained between 13%
and 14% by adding calculated amount of water in the
soil.
2.8 Seed-bed preparation in soil-bin
soil bin. The soil was then pulverized by a roto-tiller and
compacted by pneumatically pressurised rollers. The
compress roller freshly tilled soil with rollers exerting
positive pressure on soil. The soil was compacted by two
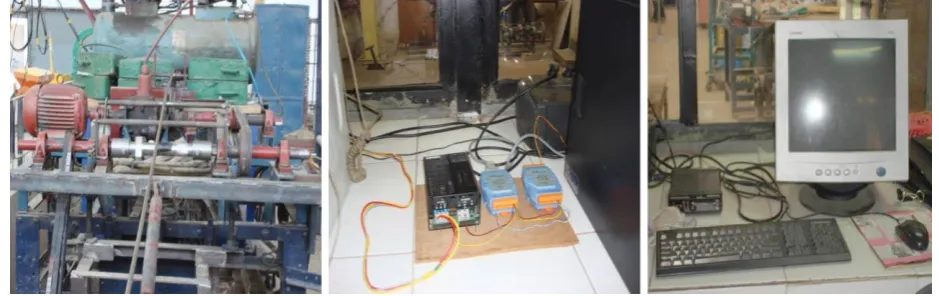
passes of pneumatically pressurized rollers (Figure 3).
The soil was first compacted at constant pressure of
0.1 MPa with rollers suspended in air and then soil was
compacted at downward pneumatic pressure of 0.1 MPa.
Figure 3 View of compressor, pneumatic cylinders and controls used for tool carriage
2.9 Experimental procedure
A wireless strain gauge type torque transducer
mounted on intermediate shaft of tool carriage trolley has
been used to measure shaft torque. The torque sensor
(strain gauge) was pasted on the intermediate shaft
powering the spading machine (Figure 4).
A 9-volt battery, a transmitter and an antenna were
strapped on the same shaft. Another magnetic mount
receiving antenna was positioned near transmitter within
six meters. Before applying each test the receiver unit was set ‘ON’ and the software was also set ‘ON’. Then the carriage of spading blades was run in the soil-bin. The
data in tabular form along with the graphical
representation was available on monitor of computer and
was recorded. The generated table was exported to a
spreadsheet and saved as an excel file. Specific soil
resistance encountered was determined by dividing the
average shaft torque by arm length of spading mechanism
and frontal area of blade. Energy consumed per unit
volume of soil moved was determined by dividing power
to volume of soil moved per bite. Cone index ratio was
determined by dividing initial cone index by final cone
index. The hypothesis selected for optimization was that
the pulverization should be maximum, specific soil
resistance and energy expenditure should be optimal. The
observations recorded on specific soil resistance
encountered, energy consumed per unit volume of soil
moved, weighted mean clod size, soil bulk density, soil
cone index and cone index ratio were analysed using
analysis of variance and conclusions were drawn by
testing the significance of difference between various
levels/combinations of factor levels. All differences were
tested at 5% level of significance.
Figure 4 Torque transducer pasted on shaft and modules, receiver, and computer
3 Results and discussion
The experiments were conducted on soil having
15.7% clay, 53.6% silt and 30.7% sand. During
experimentation moisture content of soil was maintained
between 13% and 14% (Dry basis). The effect of different
spade angles and spading frequencies on various
dependent variables, i.e. specific soil resistance
encountered, energy consumed per unit volume of soil
moved, weighted mean clod size, soil bulk density and
soil cone index were found to be inversely related i.e.
dependent variables.
3.1 Effect of spade angle and spading frequency on
specific soil resistance
The effect of spade angle on specific soil resistance
was significant at 5% level of significance. The analysis
of variance (ANOVA) of specific soil resistance
encountered (Table 3) indicated that the effect of blade
width, spading frequency and spade angle were
significant at 5% level of significance in that order.
Further it was revealed from Table 3 that soil tilled by A3
i.e. 30° spade angle had significantly lower specific soil
resistance among all the treatments. The effect of spade
angle (Table 1 and Table 2) on specific soil resistance
was inversely related i.e. as the spade angle increased
specific soil resistance decreased. However, the
maximum soil resistance was close to 0.14 N cm-2 at A1
(straight) and minimum was 0.04 N cm-2 at A3 (30°) for
blade width W1. It was also evident from the Table 1 that
the specific soil resistance decreased with increase in
spading frequency for different spade angles. Similarly,
maximum specific soil resistance for blade width W2
(Table 2) was 0.20 N cm-2 at A1 (straight) while
minimum was 0.08 N cm-2 at A3 (30°). Hence, it
indicated that with increase in spade angle average soil
resistance decreased also resulting in better pulverization.
It was evident from the Table 2 that for the blade with
higher spade angle i.e. A3 (30°) soil failed in tension and
the failure plane was progressive, whereas for A1
(straight) and A2 (15°) soil failure was also in tension but
was slower in comparison to A3 (30°).
Table 1 Effect of different spade angles and spading frequency on specific soil resistance (N cm-2) at blade width W1
Spade angle (Degree)
Spading frequency, cycle s-1
F1 F2 F3 F4 A1 0.14 0.11 0.08 0.05 A2 0.13 0.11 0.07 0.05 A3 0.11 0.10 0.06 0.04
Table 2 Effect of different spade anglesand spading frequency on specific soil resistance (N cm-2) at blade width W2
Spade angle (Degree)
Spading frequency, cycle s-1
F1 F2 F3 F4 A1 0.20 0.17 0.12 0.11 A2 0.18 0.16 0.12 0.09 A3 0.17 0.14 0.11 0.08
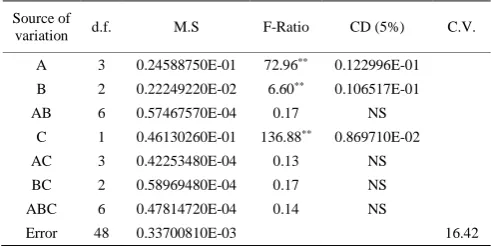
Table 3 Analysis of variance foreffect of different spade anglesand spading frequency on specific soil resistance (N cm-2)
Source of
variation d.f. M.S F-Ratio CD (5%) C.V. A 3 0.24588750E-01 72.96** 0.122996E-01
B 2 0.22249220E-02 6.60** 0.106517E-01
AB 6 0.57467570E-04 0.17 NS C 1 0.46130260E-01 136.88** 0.869710E-02
AC 3 0.42253480E-04 0.13 NS BC 2 0.58969480E-04 0.17 NS ABC 6 0.47814720E-04 0.14 NS
Error 48 0.33700810E-03 16.42
Specific soil resistance encountered decreased with
increase in spading frequency. Since the specific soil
resistance encountered was least for spading frequency
F4 compared to F1, F2 and F3 so spading frequency F4
was considered better than F1, F2 and F3. Therefore, best
combination from specific soil resistance encountered
point of view was F4. It was evident that the specific soil
resistance encountered was lower for W1 compared to
W2 because the failure planes were wide apart in case of
bigger blade causing lesser internal fragmentation
produced resulting in higher soil resistance (Dogra et al.,
2014). Specific soil resistance was the minimum for
combination W1F4 but maximum for combination W2F1.
Therefore, best combination from specific soil resistance
point of view was W1F4 (Dogra et al., 2014). Specific
soil resistance encountered decreased with increase in
spade angle. Specific soil resistance encountered was
minimum (0.08 N cm-2) for A3 and maximum
(0.20 N cm-2) for A1. Thus A3 was considered better
than A1 and A2. Hence best combination was W1F4A3.
3.2 Effect of spade angle and spading frequency on
energy consumed per unit volume of soil moved
Spade angle had significant effect on the energy
consumed per unit volume of soil moved in all the
treatments at 5% level of significance. Analysis of
variance was carried out and presented in Table 6. It was
revealed that blade width, spading frequency and spade
angle were highly significant in that order affecting the
energy consumed per unit volume. It was also observed
that the soil tilled with 30° spade angle had significantly
lesser energy consumption per unit volume amongst all
the treatments. The result with effect of spade angle on
energy consumed per unit volume of soil moved has been
Tables that as the spade angle increased the energy
consumed per unit volume of soil moved decreased. It
was also evident that with increase in spading frequency
the energy consumed per unit volume of soil moved
decreased.
However, the maximum energy consumed per unit
volume of soil moved for blade width W1 was close to
97.95 kW sm-3 and minimum was 28.78 kW sm-3.
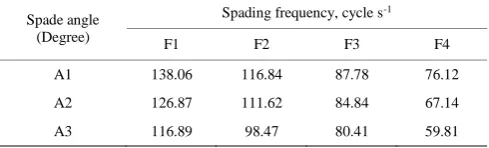
Similarly it was evident that for blade width W2 maximum
energy consumed per unit volume of soil moved was
138.06 kW sm-3 and minimum was 59.81 kW sm-3. Hence,
it indicated that increase in spade angle energy consumed
per unit volume of soil moved decreased at different
combinations. Further it can be observed that with
increase in the spade angle energy consumed per unit
volume of soil moved during spading action decreased.
This is primarily due to the fact that as the spade angle
increased, the base width of the blade hitting the soil at
first instance was lesser thereby resulting in progressive
failure, the reduced cutting force which in turn reduced
the overall energy consumption per unit volume of soil
moved while causing movement of the soil through
spading action. Energy consumed per unit volume
decreased with increase in spading frequency. The energy
consumed per unit soil moved was least for spading
frequency F4 compared to F1, F2 and F3 respectively.
Therefore, higher spading frequency F4 was superior to
F1, F2 and F3. Energy consumed per unit volume for
blade width W1 was lesser and it increased with increase
in blade width.
Table 4 Effect of different spade angles and spading frequency on energy consumed (kW sm-3) at blade width W1
Spade angle (Degree)
Spading frequency, cycle s-1
F1 F2 F3 F4 A1 97.95 79.47 55.10 35.14 A2 88.90 77.51 46.46 32.36 A3 80.76 71.09 41.27 28.78
Table 5 Effect of different spade angles and spading frequency on energy consumed (kW sm-3) at blade width W2
Spade angle (Degree)
Spading frequency, cycle s-1
F1 F2 F3 F4 A1 138.06 116.84 87.78 76.12 A2 126.87 111.62 84.84 67.14 A3 116.89 98.47 80.41 59.81
Table 6 Analysis of variance foreffect of different spade angles and spading frequency on energy consumed (kW sm-3)
Source of
variation d.f. M.S F-Ratio CD (5%) C.V. A 3 12323.910 72.97** 8.70731
B 2 1115.0310 6.60** 7.54075 AB 6 28.846350 0.17 NS
C 1 23119.940 136.89** 6.15700 AC 3 21.243490 0.13 NS BC 2 29.635740 0.18 NS ABC 6 23.898760 0.06 NS
Error 48 168.89970 0.14 16.42
Higher energy consumption with bigger blades was
caused due to bigger fracture planes. Probable the cracks
go much deeper requiring higher energy. Although
deeper cracks were preferable but energy consumption
was almost 40% more. Therefore, smaller blades W1
appeared to be superior to W2. It was also observed that
the soil tilled with A3 had significantly lower energy
consumption per unit volume among all the treatments.
It meant that with spade angle A3 soil failed in tension
and the failure plane was progressive. With spade angle
A1 and A2 soil failed in tension but soil failure was
slow. This was primarily due to the fact that as the spade
angle increased, the base width of the blade hitting the
soil at first instance decreased thereby resulting in
progressive failure, the reduced cutting force which in
turn reduced the overall energy consumed per unit
volume of soil moved while causing movement of the
soil through spading action. Therefore, higher spade
angle A3 was superior to A1 and A2. Therefore, best
combination from energy consumption per unit soil
moved point of view was W1F4A3.
3.3 Effect of spade angle and spading frequency on
weighted mean clod size
The effect of spade angle and spading frequency on
weighted mean of clod size was studied. The results and
analysis of variance (ANOVA) of weighted mean clod
size (Table 9) indicated that the effect of various main
variables and their interaction was significant at 5% level
of significance. It was evident from Table 7 and Table 8
that with increase in spade angle weighted mean clod size
decreased showing better pulverization. Similarly, with
increase in spading frequency weighted mean clod size
decreased showing better pulverization (Kathirvel et al.,
blade width W1 was 11.01 mm and minimum was
1.81 mm (Table 7). Similarly for blade width W2
( Table 8 ) maximum weighted mean clod size was
15.64 mm and minimum was 1.91 mm.
Table 7 Effect of different spade angles and spading frequency on mean clod size at blade width W1
Spade angle (Degree)
Spading frequency, cycle s-1
F1 F2 F3 F4 A1 11.01 7.07 4.40 2.80 A2 6.37 4.73 3.20 2.03 A3 4.20 4.00 2.65 1.81
Table 8 Effect of different spade angles and spading frequency on mean clod size at blade width W2
Spade angle (Degree)
Spading frequency, cycle s-1
F1 F2 F3 F4 A1 15.64 11.17 5.55 3.52 A2 11.34 7.75 4.08 2.63 A3 9.46 6.27 3.52 1.91
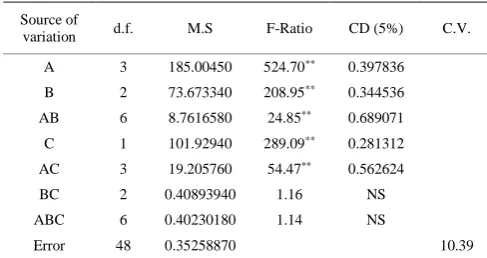
Table 9 Analysis of variance for effect of different spade angles and spading frequency on mean clod size
Source of
variation d.f. M.S F-Ratio CD (5%) C.V. A 3 185.00450 524.70** 0.397836
B 2 73.673340 208.95** 0.344536
AB 6 8.7616580 24.85** 0.689071
C 1 101.92940 289.09** 0.281312
AC 3 19.205760 54.47** 0.562624
BC 2 0.40893940 1.16 NS ABC 6 0.40230180 1.14 NS
Error 48 0.35258870 10.39
This signified that with 30° spade angle smaller clods
were formed hence better pulverization of soil, as smaller
and progressive failure planes resulted in better
pulverization. Large spade angle resulted in larger failure
planes. For maximum pulverization of soil weighted
mean clod size should be the minimum. It was evident
that weighted mean clod size decreased with increase in
spading frequency. Thus, F4 can be considered best. The
weighted mean of clod size was the minimum for smaller
blades. Therefore, smaller blades W1 were superior to
W2. Similarly it was observed that weighted mean clod
size was the maximum for A1 followed by A2 and A3.
Thus, A3 was considered to be better. So, the better
combination was W1F4A3.
3.4 Effect of spade angle and spading frequency on
bulk density
The effect of spade angle on soil bulk density was
significant at 5% level of significance. Analysis of
variance was carried out and had been presented in
Table 12. It was revealed from Table 12 that A3 had
significantly lesser soil bulk density than A2 and A1. The
effect of spade angle on soil bulk density for blade width
W1 indicated that as the spade angle increased the
achieved bulk density decreased. The results of effect of
spade angle for blade width W1 and W2 have been shown
in Table 10 and Table 11. The maximum bulk density
achieved was close to 1.36 Mg m-3 and minimum was
1.22 Mg m-3. The maximum soil bulk density for blade
width W2 was 1.38 Mg m-3 and minimum was 1.26 Mg m-3.
Hence, it indicated that with increase in spade angle soil
bulk density decreased showing better pulverization. The
section of blade impacting soil at first instance was
smallest for blades having higher spade angles. This
resulted in generation of relatively smaller failure planes
compared to blades with lower spade angles. Small and
progressive failure planes resulted in better pulverization.
Thus, soil bulk density was lesser for blades with higher
spade angle. Soil bulk density decreased with increase in
spading frequency. Soil bulk density was the minimum
for F4. The soil bulk density was the minimum for
smaller blades. Minimum value of soil bulk density was
observed at combination W1F4. Since this was in line
with earlier results so it was considered. It was also
observed that soil bulk density was the maximum for A1
compared with A2 and A3. Thus, A3 was considered to
be better. So the combination W1F4A3 was retained as
better combination.
Table 10 Effect of different spade angles and spading frequency on soil bulk density at blade width W1
Spade angle (Degree)
Spading frequency, cycle s-1
F1 F2 F3 F4 A1 1.36 1.32 1.30 1.28 A2 1.33 1.31 1.28 1.27 A3 1.32 1.29 1.27 1.22
Table 11 Effect of different spade angles and spading frequency on soil bulk density at blade width W2
Spade angle (Degree)
Spading frequency, cycle s-1
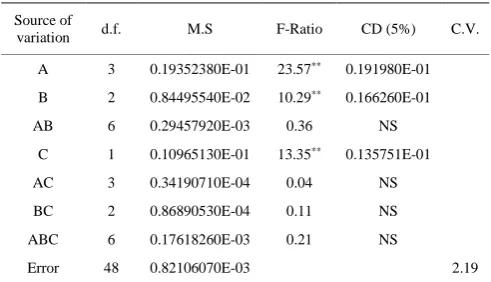
Table 12 Analysis of variance for effect of different spade angles and spading frequency on soil bulk density
Source of
variation d.f. M.S F-Ratio CD (5%) C.V. A 3 0.19352380E-01 23.57** 0.191980E-01
B 2 0.84495540E-02 10.29** 0.166260E-01
AB 6 0.29457920E-03 0.36 NS C 1 0.10965130E-01 13.35** 0.135751E-01
AC 3 0.34190710E-04 0.04 NS BC 2 0.86890530E-04 0.11 NS ABC 6 0.17618260E-03 0.21 NS
Error 48 0.82106070E-03 2.19
3.5 Effect of spade angle and spading frequency on
soil cone index
The effect of spade angle and spading frequency on
soil cone index was significant at 5% level of
significance. The data was statistically analysed and
presented in Table 15. The effect of spade angle on soil
cone index was indicated that the A3 (30°) could
produce finer soil compared to A2 (15°) and A1
(straight), which led to better pulverization of soil.
Maximum soil cone index achieved for blade width W1
was close to 0.521 MPa and minimum was 0.398 MPa
(Table 13). Similarly, it was evident (Table 14) that for
blade width W2 maximum soil cone index was
0.523 MPa and minimum was 0.403 MPa. Hence, it
indicated that increase in spade angle soil cone index
decreased showing better pulverization. The soil mass
with bigger clods have higher cone index because
intergranular air space is not proportionate to clod size.
This happens because after removing the chunk of soil
mass the spading machine strikes it with cover and the
soil mass gets broken into smaller clods. These clods
settled on the soil bed. In this settling process initially
the clods break to finer fractions after striking the
ground surface. The clods which follow get broken into
relatively bigger sizes. Since these are fractured they
tend to fill the available space. Thus, the larger clods
moved to the surface while the smaller clods
concentrated in the deeper layers (Winkelblech, 1961).
It was observed that the soil cone index decreased with
increase in spading frequency. Soil cone index was the
minimum with spading frequency F4 compared with
other spading frequencies. Therefore, F4 was considered
to be better than spading frequencies F1, F2 and F3. Soil
cone index was lesser for W1 compared with W2.
Therefore, W1 was considered better than W2.
Table 13 Effect of different spade angles and spading frequency on cone index at blade width W1
Spade angle (Degree)
Spading frequency, cycle s-1
F1 F2 F3 F4 A1 0.521 0.499 0.476 0.460 A2 0.497 0.477 0.465 0.443 A3 0.484 0.453 0.433 0.398
Table 14 Effect of different spade angles and spading frequency on cone index at blade width W2
Spade angle (Degree)
Spading frequency, cycle s-1
F1 F2 F3 F4 A1 0.523 0.508 0.489 0.462 A2 0.498 0.490 0.474 0.444 A3 0.493 0.478 0.447 0.403
Table 15 Analysis of variance for effect of different spade angles and spading frequency on cone index
Source of
variation d.f. M.S F-Ratio CD (5%) C.V. A 3 0.15285070E-01 64.44** 0.103187E-01
B 2 0.11553450E-01 48.71** 0.893629E-02
AB 6 0.37617080E-03 1.59 NS C 1 0.13520980E-02 5.70** 0.729645E-02
AC 3 0.18395220E-03 0.78 NS BC 2 0.10087690E-03 0.43 NS ABC 6 0.18227300E-04 0.08 NS
Error 48 0.2371999E0-03 3.27
Also it was found that soil cone index was the
maximum for A1 compared with A2 and A3.
Performance was better with A3. So, A3 was considered
to be the best. So, the combination W1F4A3 was
considered best. This matches with earlier choice of
weighted mean clod size and soil bulk density, therefore
combination W1F4A3 considered the best for maximum
pulverization.
3.6 Effect of spade angle and spading frequency on
cone index ratio
The effect of spade angle and spading frequency on
soil cone index ratio was significant at 5% level of
significance. The data on cone index ratio was
statistically analysed and had been presented in Table 18.
It was observed that the soil which was tilled by 30°
spade angle had significantly lowest soil cone index
among all the treatments. The effect of spade angle on
finer soil compared to A2 (15°) and A1 (0°), which
indicated better pulverization of soil. It was evident from
Table 13 that as the spade angle increased the cone index
ratio increased. However, the maximum (Table 16) cone
index ratio achieved for blade width W1 was 2.08 and
minimum was 1.57. It was evident (Table 17) that for
blade width W2 maximum cone index ratio was 2.06 and
minimum was 1.56.
Table 16 Effect of different spade angles and spading frequency on cone index ratio at blade width W1
Spade angle (Degree)
Spading frequency, cycle s-1
F1 F2 F3 F4 A1 1.57 1.64 1.73 1.79 A2 1.65 1.72 1.76 1.87 A3 1.69 1.81 1.90 2.08
Table 17 Effect of different spade angles and spading frequency on cone index ratio at blade width W2
Spade angle (Degree)
Spading frequency, cycle s-1
F1 F2 F3 F4 A1 1.56 1.61 1.68 1.79 A2 1.65 1.67 1.72 1.86 A3 1.67 1.71 1.84 2.06
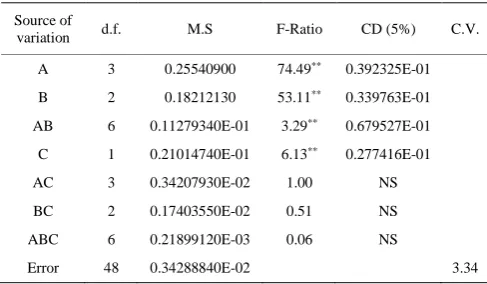
Table 18 Analysis of variance for effect of different spade angles and spading frequency on cone index ratio
Source of
variation d.f. M.S F-Ratio CD (5%) C.V. A 3 0.25540900 74.49** 0.392325E-01
B 2 0.18212130 53.11** 0.339763E-01
AB 6 0.11279340E-01 3.29** 0.679527E-01
C 1 0.21014740E-01 6.13** 0.277416E-01
AC 3 0.34207930E-02 1.00 NS BC 2 0.17403550E-02 0.51 NS ABC 6 0.21899120E-03 0.06 NS
Error 48 0.34288840E-02 3.34
Hence, it indicated that with increase in spade angle
cone index ratio increased showing better pulverization.
The soil mass with bigger clods had higher cone index
because inter-granular air space is not proportionate to
clod size. Hence, the cone index ratio with bigger clods
was lower than smaller clods.
Two hypotheses for optimization were selected,
firstly the pulverization should be maximum, secondly
specific soil resistance and energy consumption should be
optimal. In whole study of all the factors like spading
frequency, spade angle and blade width in relation to
weighted mean clod size, soil bulk density and soil cone
index from point of view of pulverization as well as
specific soil resistance encountered and energy required
per unit mechanical manipulation of soil the best
combination was W1F4A3. The optimum values of
independent parameters have been given in Table 19.
Table 19 Optimum values of independent parameters
Parameters Values Blade width (W), cm 10 Spading frequency (F), cycles s-1 4.62
Spade angle (A), degree 30
4 Conclusions
Specific soil resistance, energy consumed, weighted
mean clod size, soil bulk density and cone index
decreased with increase in spading frequency and spade
angle, but increased with increase in blade width.
Minimum specific soil resistance, energy consumed,
weighted mean clod size, soil bulk density and cone
index were encountered (observed) for W1 (10 cm) wide
blade with A3 (30°) spade angle and at spading
frequency of F4 (4.62 cycles s-1) and maximum for W2
(15 cm) wide blade with straight spade angle (0°) and at
spading frequency of F1 (1.85 cycles s-1). Cone index
ratio increased with increase in spading frequency and
spade angle, but decreased with increase in blade width.
Minimum cone index ratio was observed for 15 cm wide
blade with straight spade angle (0°) at spading
frequency of F1 (1.85 cycles s-1). Maximum cone index
ratio was observed for W1 (10 cm) wide blade with A3
(30°) spade angle at spading frequency of F4
(4.62 cycles s-1). These results indicated that maximum
pulverization and optimal specific soil resistance
encountered and energy consumption best with the
combination W1F4A3.
References
Anon. 1973. IS: 2720 (Part-II). Method of test for soil. Anon. 2004. ASAE, Standards S313. 3: 859–860.
Bishnoi, R. 2008. Development and evaluation of blades for spading machine. PhD. diss., Punjab Agricultural University, Ludhiana, Punjab, India.
Mechanization in Asia, Africa and Latin America, 45(3): 12–17. Gill, W. R. 1969. Soil deformation by simple tools. Transactions of
the ASAE, 12(2): 234–239.
Kathirvel, K., D. M. Jesudas, and D. S. Kumar. 2011. Development and evaluation of tractor operated rotary spading machine.
Agricultural Mechanization in Asia, Africa and Latin America, 42(2): 28–32.
Manfred, P. 2002. Planting Spuds - what is a spader. Available at: www.mailarchive.com/[email protected]/msg01748.html. Accessed 3 March 2014.
RNAM. 1983. Test code and procedure for rotary tillers. In
Regional Network for Agricultural Machinery. Part 2- ESCAP, UNDP, Philippines.
Sambhi, V. S. 2006. Computer based development and evaluation of articulated tillage machine. PhD. diss., Punjab Agricultural University, Ludhiana, Punjab, India.
Singh, G., and D. Singh. 1986. Optimal energy model for tillage.
Soil and Tillage Research, 6(3): 235–245.