Response characteristics and efficiency of variable rate fertilization based
on spectral reflectance
Man Chen
1,2,
Zhenjie Yang
1,
Xiaochan Wang
1,3*,
Yinyan Shi
2,
Yu Zhang
1(1. College of Engineering, Nanjing Agricultural University, Nanjing 210031, China;
2. Nanjing Research Institute for Agricultural Mechanization, Ministry of Agriculture, Nanjing 210014, China;
3. Jiangsu Province Engineering Laboratory for Modern Facilities Agricultural Technology and Equipment, Nanjing 210031, China)
Abstract: The key technical problem of variable rate fertilization system based on spectrum information was precise variable
fertilization in certain area according to the acquired spectrum information. Hysteretic fertilizing is a critical problem in most of current fertilizer equipment. Hysteresis model was built and analyzed in this study to improve the system. Fertilizing tests were conducted on different wheat breeds and the results were analyzed. The tests showed that variable rate fertilization had obvious hysteresis phenomenon with the maximum lag distance of 3.82 m, the minimum lag distance of 1.73 m and average of 3.06 m. Hysteresis phenomenon of the variable rate fertilization system was obviously decreased when implanting a correction time of 2.04 s with the maximum lag distance of 0.61 m. Variable effects varied by different wheat breeds. Variable rate fertilization had an advantage of improving spatial differences of Yangmai-23, and the spatial variability of which decreased by 14.23%. In the small test area, the amount of fertilizer in Zhenmai-168 decreased by 2.84 kg, while the amount of which in Yangmai-23 increased by 3.83 kg. Yield of Zhenmai-168 in small area was lower than that in traditional pattern, but the condition of Yangmai-23 was on the contrary. Valuable information for increasing performance of fertilization in variable rate fertilization system was provided in this paper.
Keywords: variable rate fertilization, fertilization lag, calibration, fertilization efficiency, winter wheat
DOI: 10.25165/j.ijabe.20181106.4086
Citation: Chen M, Yang Z J, Wang X C, Shi Y Y, Zhang Y. Response characteristics and efficiency of variable rate
fertilization based on spectral reflectance. Int J Agric & Biol Eng, 2018; 11(6): 152–158.
1 Introduction
Variable rate fertilization technology is used to improve yield and fertilizer utilization rate and reduce fertilizer inputs and environmental pollution[1,2]. According to the spatial differences of different factors, such as field crop growth, soil structure, nutrition distribution and moisture, variable rate fertilization technology can accomplish the purpose of precise fertilization[3,4], which is an important part of the modern precision agriculture[5].
The variable rate fertilization applicator, which is based on both soil testing equation variable rate fertilization technology and online monitoring sensor variable rate fertilization technology, are on the basis of target variables to achieve regional precision fertilization. Target variable fertilization is the key technology to achieve regional precision fertilization on both soil testing and equation ted fertilization and variable rate fertilization technology based on online monitoring sensor[6,7]. However, many studies
show that variable rate fertilization technology has fertilization lag phenomenon. In order to solve this problem, in recent years,
Received date: 2018-01-04 Accepted date: 2018-08-02
Biographies: Man Chen, PhD, research interests: agricultural electrification and
automation, Email: [email protected]; Zhenjie Yang, PhD candidate, research interests: agricultural biological environment and energy engineering, Email: [email protected]; Yinyan Shi, PhD, research interests: agricultural electrification and automation, Email: [email protected]; Yu Zhang, PhD, research interests: agricultural electrification and automation, Email: [email protected].
*Corresponding author: Xiaochan Wang, PhD, Professor, Dean, research
interests: agricultural biological environment simulation and control. Department of Electrical Engineering, College of Engineering, Nanjing Agricultural University, Box 96, 40 Dianjiangtai Road, Pukou, Nanjing 210031, China. Email: [email protected].
domestic and international research institutions have carried out relevant researches, but most of studies focus on the fertilization lag of soil testing Equation variable rate fertilization applicator[8-10]. However, variable rate fertilization based on sensor technology were barely studied, except for Maleki et al.[11-13] from Catholic University of Leuven, Netherlands. Therefore, based on the spectral technology of variable rate fertilization applicator self-developed[14-20], fertilization lag model was studied in this paper. According to the test results, precision and stability of fertilizer equipment was improved by modifying the fertilizer lag model. In addition, different kinds of wheat was planted to analyze growing spacial differences, the amount of fertilization and yield by comparing the growth status before with after fertilizing.
2 Principle of variable rate fertilization applicator
based on Spectrum Technology
Spectrum detection technology is based on analyzing crop canopy specific wavelengths of the light reflection and absorption features, then analyzing and diagnosing crop growth of spatial differences, nutrition status and nutrition deficiency. Key technical difficulties are crop canopy spectral features analysis and recognition. Studies show that crop growth spacial differences, nutrition status and nutrition deficiency changes will cause differences of the spectral reflectance and absorption on certain wavelengths leading to different spectral reflectance, which provides the theoretical basis for spectroscopic applications on crop growth vigor, nutrition status and nutrition deficiency diagnosis[16].
spatial differences of wheat growing, the normalized difference vegetation index (NDVI) was obtained by scanning winter wheat canopy using spectrum monitoring system which was installed in the front of the tractor. The data was transmitted to a vehicle control terminal by the wireless serial transmission module. Then, the vehicular control terminal operated the intelligent variable rate fertilization control decision system to carry out relevant control subroutine and achieve operation information acquisition, display and storage. In the control decision system, targets of fertilizer and the corresponding control variables were generated in real time by the improved Ruan model and built-in control model, then, the
control instructions was transmitted to the controller by the wireless serial transmission module. At the same time, parameters of the vehicle speed monitored by speed sensor, rotate speed of fertilizer feed monitored by Hall sensor and valve opening degree of fertilizer feed monitored by displacement sensor were feed back to the fertilizer control system forming a closed feedback loop. Eventually, using the built-in self-adaptive fuzzy PID control algorithm, adjustment of motor running status was controlled to operate the valve opening and rotate speed of fertilizer feed indirectly to achieve on-line adjustment of variables of fertilizer feed and the goal of precise variable fertilization.
Figure 1 Schematic diagram of variable rate fertilization
3 Hysteresis calibration
3.1 Hysteresis model
Major factors of influencing fertilizer applicator hysteresis and response time are spectral sensor position, data acquisition time of controller, response delay of control command sending, fertilizer dropping time delay and fertilization actuator response test.
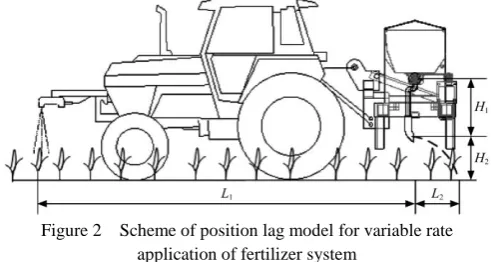
Fertilization location lag model was constructed on the basis of existing research achievements, shown in Figure 2. The location of the variable rate fertilization application is L:
L=L1+L2–L3 (1)
where, L is the distance of fertilization work lag, m; L1 is the
distance between spectrum acquisition point and feed opening of the fertilizer applicator, m; L2 is the horizontal distance from the
fertilizer’s leaving feeding port to the land point, m; L3 is the
distance of the fertilization applicator’s traveling from spectral data obtained to fertilizer’s reaching the ground, m.
Figure 2 Scheme of position lag model for variable rate application of fertilizer system
The fertilizer feed of variable rate fertilization applicator and the unloading opening was connected by the fertilizer discharging pipe. Assuming that the initial velocity of granular fertilizer is 0 m/s when the particles are driven out of the fertilizer feed into the pipe. The particles movement is considered as a movement down a slope with a vertical angle of α. So the velocity of particles at unloading opening can be calculated by Equation (2):
0 2 1
l
v gH (2) where, vl0is the velocity of the time of fertilizer arriving at the feed
opening, m/s; g is gravity acceleration, assuming 9.8 m/s2; H1 is the
vertical distance between the fertilizer outlet and the unloading opening, m.
After the particles leaving the unloading opening, the particles will begin a horizontal movement with a distance of L2:
L2=vl0·t1·sinα (3)
where, t1 is the duration between fertilizer’s leaving the unloading
opening and falling onto the ground, s.
2
2 l0 1 cos 0.5 1
H v t g t (4) where, H2 is the vertical distance between the unloading opening
and the ground, m.
L2 and t1 can be solved from the equations composed of
Equations (2)-(4).
The distance of the fertilization applicator traveling from spectral data obtained to particles reaching the ground can be expressed as:
L3=v(t1+t2+t3+t4) (5)
where, t2 is time counting from fertilizer leaving fertilizer device to
reaching the unloading opening, s; t3 is time of fertilizer actuator
response, s; t4 is time for the control system collecting spectral
information, control system running and control instructions sending, s; vl0 is velocity of the fertilization applicator traveling,
m/s.
Time from the particles leaving the fertilizer feed to the unloading opening can be calculated by:
1 2
1 2
cos
H t
g
(6) According to the above method, location lag of variable rate fertilization applicator can be calculated. Because the time of fertilizer actuator response and the time for collecting spectral information, making decisions and sending control instructions in the control system were very difficult to accurately measured, experimental test was used to calibrate the average fertilization lag distance of the variable rate fertilization applicator in this paper. And lag correction time of variable rate fertilization applicator was calculated by Equation (7):
test lag
L t
v
(7)
where, tlag is lag correction time of the variable rate fertilization
system, s; Ltest is lag distance of the variable rate fertilization
applicator of test calibration, m.
3.2 Calibration test
winter wheat farm lot. To carry out field trials, it was used a tractor brand Kubota, model M704K, and power of 70 HP at PTO shaft. The variable rate fertilization applicator, which was capable of delivering between 0-900 kg/hm2, was attached to a
tractor, with eight dosifiers of fertilizer spaced at 0.22 m (8.75 in). Each, which generated a working width of 2.00 m. The drill contained two semi-shafts, each driving half of the fertilizer dosifiers. The spectrum sensor (Trimble, model GreenSeeker) mounted on the tractor. This sensor was used to analyze the NDVI of the wheat canopy. the fertilizer used was Shuhe, which is granulated urea (46% N), and particle size in the range of 0.85-2.80 mm. The spectrum sensor mounted in the front of the fertilizer applicator faced the very edge of the testing area at the beginning of experiments. During fertilization test, Ltest1 was the
distance between the first fertilizer’s falling spot and test area edge, and Ltest2 was the distance between the last fertilizer’s falling spot
and test area edge. According to the results of repeated tests, variable fertilization location lag problem was analyzed.
a. Test programming
b. Field test
Figure 3 Calibration test of position lag model
Test results are shown in Figure 4. In different velocities,
Ltest1 and Ltest2 values of the test records, representing the lagging
locations, were different. In testing Group 2, the maximum lag
distance was 3.82 m at the average driving velocity of 1.38 m/s. In testing Group 9, the maximum lag distance was 1.73 m at the average driving velocity of 1.66 m/s.
Note: Ltest is the average lag distance; Vtest is the average velocity of driving,
same as below.
Figure 4 Results of position lag model test
By calculations, the average lag distance of the variable rate fertilization applicator was 3.06 m, and the average velocity was 1.50 m/s. The average lag distance and the average velocity of the fertilizer applicator were obtained from the results of testing experiments, and the system lag time of the variable rate fertilizing machine was modified to 2.04 s. The control system was corrected by inputting the modified lag time to achieve precision fertilization.
Embedded lag correction time variable fertilization control system verification test was conducted, and the results of the test statistics were shown in Figure 5. By modifying system parameters, variable rate fertilizing lag was greatly improved with maximum lag distance 0.61 m, minimum lag distance 0.33 m and average lag distance 0.45 m. After modifying, the variable rate fertilization placed the particles ahead of where the particles should be, with a distance of 0.22 m.
Figure 5 Validation test of position lag correction model
4 Analysis of variable fertilization results
From 2014 to 2015, related tests were studied in Yangzhuang Village, Zhenwu County, Jiangdu City, Jiangsu Province, respectively from the variable rate fertilization on the local domain, different kinds of wheat growth, fertilizer and yield influence to assess the effectiveness of variable fertilization.
4.1 Testing experiment design
During jointing stage of wheat, urea was topdressed for experimental study in three specified sub-areas, which were the blank control group CK-J1 and CK-J2, the local standard fertilization group CP-J1 and CP-J2 and the variable rate fertilization group CV-J1 and CV-J2. Fertilization area in each experimental lot was 1333.34 m2. Testing design was shown in Figure 6.
4.2 Growth spacial differences
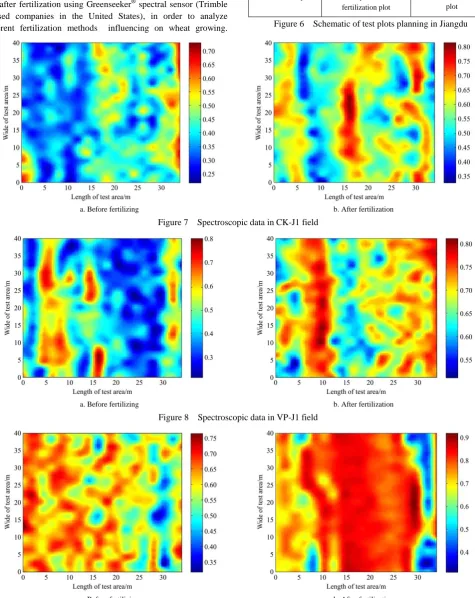
NDVI of wheat canopy in all testing area was acquired before and after fertilization using Greenseeker® spectral sensor (Trimble refused companies in the United States), in order to analyze different fertilization methods influencing on wheat growing.
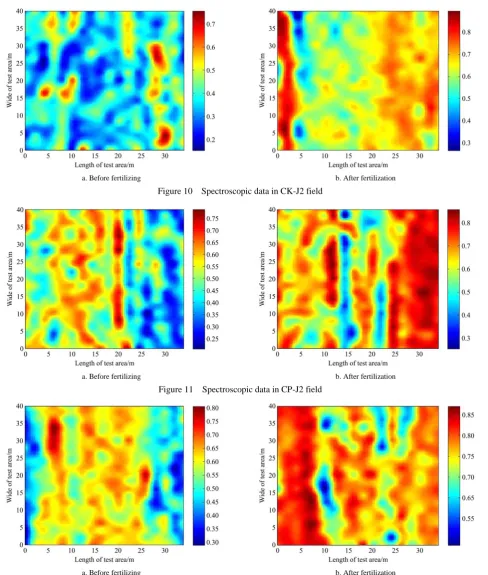
Spectral data distribution in every testing area was shown in Figures 7-12.
CK-J1 Zhenmai-168 Blank control plot
CP-J1 Zhenmai-168 Local quantitative
fertilization plot
CV-J1 Zhenmai-168 Variable rate fertilization
plot CK-J2
Yangmai-23 Blank control plot
CP-J2 Yangmai-23 Local quantitative
fertilization plot
CV-J2 Yangmai-23 Variable rate fertilization
plot Figure 6 Schematic of test plots planning in Jiangdu
a. Before fertilizing b. After fertilization
Figure 7 Spectroscopic data in CK-J1 field
a. Before fertilizing b. After fertilization
Figure 8 Spectroscopic data in VP-J1 field
a. Before fertilizing b. After fertilization
a. Before fertilizing b. After fertilization Figure 10 Spectroscopic data in CK-J2 field
a. Before fertilizing b. After fertilization
Figure 11 Spectroscopic data in CP-J2 field
a. Before fertilizing b. After fertilization
Figure 12 Spectroscopic data in CV-J2 field Through analyses of Figures 7-12, we can find that:
(1) Growth spacial differences existed in both two kinds of winter wheat presented by NDVI of wheat canopy, which was acquired by spectral monitoring system. All data were acquired in the jointing stage of wheat before fertilizing. NDVI of wheat canopy in CK-J1 area was shown in Figure 7a with average of 0.413, maximum of 0.730 and minimum of 0.216, whose spatial variation coefficient was 18.42%. Figure 8a test number In CP-J1 area, the NDVI of wheat canopy was shown in Figure 8a with average of 0.439, maximum of 0.810, minimum of 0.223 and spatial variation coefficient 17.79%. Figure 9a presented features
(2) Additional nitrogen fertilizer offering at jointing stage of winter wheat could accelerate the growth of plants and improve the population structure of winter wheat. After fertilization at the jointing stage, the NDVI of winter wheat canopy was collected again in April 11, 2015. Figure 7b described features of NDVI of wheat canopy in the area of CK-J1 with average of 0.578, maximum of 0.816, minimum of 0.329 and spatial variation coefficient 15.82%. Figure 8b showed features of NDVI of wheat canopy in the area of CP-J1 with average of 0.690, maximum of 0.835, minimum of 0.315 and spatial variation coefficient 15.28%. Figure 9b expressed features of NDVI of wheat canopy in the area of CV-J1 with average of 0.756, maximum of 0.888, minimum of 0.507 and spatial variation coefficient 8.42%. NDVI of wheat canopy in CK-J2 area was shown in Figure 10a with average of 0.653, maximum of 0.875 and minimum value 0.262, whose spatial variation coefficient was 17.24%. NDVI of wheat canopy in CP-J2 area was shown in Figure 10a with average of 0.669, maximum of 0.855 and minimum of 0.253, whose spatial variation coefficient was 10.92%. Figure 12b reflected features of NDVI of wheat canopy in CV-J2 area with average of 0.766, maximum of 0.862 and minimum of 0.535, whose spatial variation coefficient was 5.02%. Before the additional nitrogen fertilizer topdressing, the canopy NDVI of winter wheat in every testing area was increased with the spatial variation coefficient decreased. Compared with the blank control group, after topdressing of nitrogen fertilizer, the spatial difference of winter wheat growth was slower with the maximum reduced by 14.23%.
(3) Compared with the local traditional quantitative fertilization, the precision variable fertilization applied chemical fertilizer more reasonably and scientifically, and was more conductive for accelerating plant growth and improving population structure of winter wheat. Average value of NDVI of winter wheat canopy in the area of CV-J1, where Zhenmai-168 was cultivated, was 0.756, which was higher than that in traditional quantitative fertilization area CP-J1 with the value 0.690. In the variable fertilization area of CV-J1, where Zhenmai-168 was cultivated, space variation coefficient was 8.42%, which was lower than that in traditional quantitative fertilization area of CP-J1 with the value 15.28%. Compared before with after fertilization, space variation coefficient in the variable fertilization area of CV-J1 decreased by 4.61%, which was higher than that in the traditional quantitative fertilization area of CP-J1 with the value of 2.52%. In Yangmai-23 variable fertilization area of CV-J2, averaged NDVI of wheat canopy was 0.766, which was higher than that in traditional quantitative fertilization area of CP-J2 with value of 0.669. Spatial variation coefficient in variable fertilization area of CV-J2 was 5.02%, which was lower than that in traditional quantitative fertilization area of CP-J2 with value of 10.92%. Compared before with after fertilization, spatial variation coefficient in the variable fertilization area of CV-J2 decreased by 14.23%, which was higher than that in the traditional quantitative fertilization area of CP-J2 with value of 4.52%.
(4) The response of variable fertilization on the Yangmai-23 was better than that on Zhenmai-168. Averaged NDVI of Yangmai-23 wheat canopy increased to 0.766, which was higher than that on Zhenmai-168 with value of 0.756, after topdressing nitrogen fertilizer using the variable rate fertilization in this paper. The variation coefficient of Yangmai-23 decreased to 5.02%, which was lower than that on Zhenmai-168 with value of 8.42%. Yangmai-23 variable coefficients improvement was more obvious, with a reduction of 14.23%, comparing with that before
fertilization, while that on Zhenmai-168 decreased only by 4.61%. In summary, compared with traditional quantitative fertilization, variable fertilization was more reasonable and scientific. In this research, the effects of variable fertilization system on different varieties of wheat were different.
a) Fertilizer application at jointing stage
During the jointing stage of winter wheat, the variable rate fertilization experiments were conducted using urea as fertilizer. The traditional quantitative fertilization area, in size of 225 kg/hm2, was fertilized manually. Variable rate fertilization area was fertilized by variable rate fertilization applicators. Statistic results of variable rate fertilization in every testing area were shown in Table 1.
Table 1 Variable rate fertilization test results
Plots number Mean NDVI Target value/kg Actual value/kg Absolute error Control accuracy/%
CV-J1 0.599 24.97 27.16 2.19 91.2
CV-J2 0.564 30.56 33.83 3.27 89.3
From Table 1, in Zhenmai-168 CV-J1 area, real variables urea usage was 27.16 kg, which was less than that in the traditional quantitative fertilization area with urea application 2.84 kg at accuracy of 91.2%. However, in Yangmai-23 CV-J1 area, real variables urea usage was 33.83 kg, which was more than that in the traditional quantitative fertilization area with an increased urea application 3.83 kg, in precision of 89.3%. Thus, the variable rate fertilization system developed in this paper performed decently. For different varieties, the amount of fertilizer used in variable rate fertilization control system was different in different growth status of winter wheat.
b) Winter wheat yield
Ten sampled locations were selected randomly in each test area, and a size of 5 m2 was harvested in each sampled location. The measured results were shown in Table 2. From Table 2, variation coefficient of yield in sampled location of precise variation fertilization was significantly lower than that in conventional management area. Wheat yield in precision variable fertilization area was stable, and population structure was reasonable. Wheat yield in traditional quantitative fertilization area varied strongly, and population structure was inferior. Yield of Zhenmai-168 plantedin precisionvariablefertilizationareawaslowerthanthat
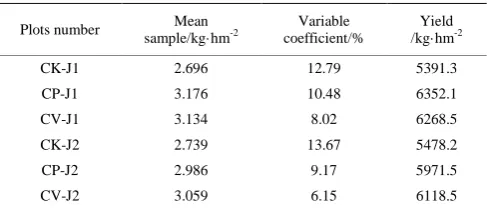
Table 2 Variable rate fertilization test results
Plots number Mean sample/kg·hm-2
Variable coefficient/%
Yield /kg·hm-2
CK-J1 2.696 12.79 5391.3
CP-J1 3.176 10.48 6352.1
CV-J1 3.134 8.02 6268.5
CK-J2 2.739 13.67 5478.2
CP-J2 2.986 9.17 5971.5
CV-J2 3.059 6.15 6118.5
in conventional management area with a high production 6268.5 kg/hm2. Yield of Yangmai-23 planted in precision variable fertilization area was higher than that in conventional management area with a production 6118.5 kg/hm2. Yield of Yangmai-23 was lower than that of Zhenmai-168.
5 Conclusions
The largest lag distance was 3.82 m, and the smallest lag distance was 1.73 m with average value 3.06 m. Variable rate fertilization system was calibrated by inputting modified time in advance. Experiment results showed that calibration effect reduced fertilization lag phenomenon obviously and effectively. Modified maximum lag distance was 0.61 m, minimum lag distance was 0.33 m, and average lag distance was 0.45 m.
2) Variable rate fertilization had an advantage of improving spatial difference of wheat growth. The results showed that the response of Yangmai-23 to variable fertilization was better than that of Zhenmai-168. Variable rate fertilization had an advantage of improving spatial differences of Yangmai-23, and the spatial variability of which decreased by 14.23%.
3) For different varieties of wheat, the amount of fertilizer application of variable fertilization was different. In small area experiment, the fertilizer amount of Zhenmai-168 decreased by 2.84 kg, while the amount of Yangmai-23 increased by 3.83 kg. The production of Zhenmai-168 in small area was lower than that in traditional pattern, but the condition of Yangmai-23 was on the contrary.
Acknowledgments
The authors express appreciation for the financial support provided by National Key Technologies R&D Program of China
(No. 2017YFD0700305 and No. 2016YFD0200600-
2016YFD0200602-4), and Fundamental Research Funds for Central Non-profit Scientific Institution (S201712). The authors also thank the editors and anonymous reviewers for providing helpful suggestions for improving the quality of this manuscript.
[References]
[1] Chanseok R, Masahiko S, Mikio U. Model for predicting the nitrogen content of rice at panicle initiation stage using data from airborne hyperspectral remote sensing. Biosystems Engineering, 2009; 104(4): 465–475.
[2] Maleki M R, Mouazen A M, Ramon H, Baerdemaeker J D. Optimisation of soil VIS–NIR sensor-based variable rate application system of soil phosphorus. Soil and Tillage Research, 2007; 94(1): 239–250.
[3] Su N, Xu T S, Song L T, Wang R, Wei Y Y. Variable rate fertilization system with adjustable active feed-roll length. Int J Agric & Biol Eng, 2015; 8(4): 19–26.
[4] Du R C, Gong B C, Liu N N, Wang C C, Yang Z D, Ma M J. A design and experiment on intelligent fuzzy monitoring system for corn planters. Int J Agric & Biol Eng, 2013; 6(3): 11–18.
[5] Maleki M R, Van H L, Ramon H, Merckx R, Baerdemaeker J D, Mouazen A M. Phosphorus sensing for fresh soils using visible and near infrared spectroscopy. Biosystems Engineering, 2006; 95(3): 425–436.
[6] Yu Y J, Zhang S H, Qi J T, Zhang L H. Positioning method of variable rate fertilizer applicator based on sensors. Transactions of CSAM, 2009; 40(10): 165–168. (in Chinese)
[7] Tola E, Kataoka T, Burce M, Okamoto H, Hata S. Granular fertiliser application rate control system with integrated output volume measurement. Biosystems Engineering, 2008;101(4): 411–416.
[8] Zhang R. Research on Key Technologies of intelligent variable rate fertilization. Beijing: Beijing Academy of Agriculture and Forestry, 2011. (in Chinese)
[9] Meng Z J, Zhao C J, Fu W Q, Ji Y X, Wu G W. Prescription map identification and position lag calibration method for variable rate application of fertilizer. Transactions of the CSAM, 2011; 42(7): 204–209. (in Chinese)
[10] Shi Y Y, Chen M, Wang X C, Morice O O, Li C G, Ding W M. Design and experiment of variable-rate fertilizer spreader with centrifugal distribution cover for rice paddy surface fertilization. Transactions of the CSAM, 2018; 49(3): 86–113. (in Chinese)
[11] Maleki M R, Ramon H, Baerdemaeker J D, Mouazen A M A. Study on the time response of a soil sensor-based variable rate granular fertilizer applicator. Biosystems Engineering, 2008; 100(2): 160–166.
[12] Maleki M R, Mouazen A M, Ramon H, Baerdemaeker J D. Multiplicative scatter correction during on-line measurement with near infrared spectroscopy. Biosystems Engineering, 2007; 96(3): 427–433. [13] Maleki M R, Mouazen A M, Ketelaere B D, Ramon H, Baerdemaeker J D.
On-the-go variable-rate phosphorus fertilisation based on a visible and near-infrared soil sensor. Biosystems Engineering, 2008; 99: 35–46. [14] Chen M, Shi Y Y, Wang X C, Sun G X, Li Y B. Design and experiment
of variable rate fertilizer applicator based on crop canopy spectral reflectance. Transactions of the CSAM, 2015; 46(5): 26–32. (in Chinese) [15] Chen M, Shi Y Y, Wang X C, Su G X, Li X. Expert decision system of
variable nitrogen application in winter wheat. Transactions of the CSAM, 2015; 46(7): 17–22. (in Chinese)
[16] Shi Y Y, Chen M, Wang X C, Odhiambo M O, Zhang Y N, Ding W M. Analysis and experiment of fertilizing performance for precision fertilizer applicator in rice and wheat fields. Transactions of the CSAM, 2017; 48(7): 97–103. (in Chinese)
[17] Chen M, Lu W, Wang X C, Su G X, Zhang Y. Design and experiment of optimization control system for variable fertilization in winter wheat field based on fuzzy PID. Transactions of the CSAM, 2016; 47(2): 71–76. (in Chinese)
[18] Wang X C, Chen M, Sun G X, Zhang Y, Zhang Y N. Design and test of control system on variable fertilizer applicator for winter wheat. Transactions of the CSAE, 2015; 31(supp.2): 88–92. (in Chinese)
[19] Chen M, Wang X C, Sun G X, Li Y B, Zhang L. Study on control system of precise seeding and fertilizing for winter wheat. Journal of Chinese Agricultural Mechanization, 2016; 37(9): 24–27. (in Chinese)
[20] Shi Y Y, Chen M, Wang X C, Sun G X, Di J, Yu H M. Design and experiment of precision fertilizer applicator actuator of rice and wheat. Journal of South China Agricultural University, 2015; 36(6): 119–124. (in Chinese)