M E T H O D O L O G Y
Open Access
Considerations and complications of
mapping small RNA high-throughput data
to transposable elements
Alexandros Bousios
1*, Brandon S. Gaut
2and Nikos Darzentas
3Abstract
Background:High-throughput sequencing (HTS) has revolutionized the way in which epigenetic research is conducted. When coupled with fully-sequenced genomes, millions of small RNA (sRNA) reads are mapped to regions of interest and the results scrutinized for clues about epigenetic mechanisms. However, this approach requires careful consideration in regards to experimental design, especially when one investigates repetitive parts of genomes such as transposable elements (TEs), or when such genomes are large, as is often the case in plants.
Results:Here, in an attempt to shed light on complications of mapping sRNAs to TEs, we focus on the 2,300 Mb maize genome, 85% of which is derived from TEs, and scrutinize methodological strategies that are commonly employed in TE studies. These include choices for the reference dataset, the normalization of multiply mapping sRNAs, and the selection among sRNA metrics. We further examine how these choices influence the relationship between sRNAs and the critical feature of TE age, and contrast their effect on low copy genomic regions and other popular HTS data.
Conclusions:Based on our analyses, we share a series of take-home messages that may help with the design,
implementation, and interpretation of high-throughput TE epigenetic studies specifically, but our conclusions may also apply to any work that involves analysis of HTS data.
Keywords: Transposable elements, Small RNAs, High-throughput sequencing, siRNAs, Genome mapping,
Annotation, Bioinformatics, RNA-seq
Background
Across eukaryotes, epigenetic pathways contribute to diverse functions, including gene regulation and trans-posable element (TE) silencing [1]. Small RNAs (sRNAs) are a key component of these pathways. Numerous stud-ies have investigated the biogenesis and functional roles of sRNAs, with most focusing on the molecular mecha-nisms that underlie these processes (for recent reviews see [2–4]). Some of these studies have utilized high-throughput sequencing (HTS) technologies, which generate vast numbers of sRNA reads. This capacity of HTS has facilitated the identification of novel sRNA classes, the quantification and comparison of sRNA expression profiles across tissues, and the discovery of genomic loci that map large volumes of sRNAs. These
tasks have been supported by numerous computational tools, most of which have been tailored to study micro RNAs (miRNAs) [5–11], with fewer offering comprehen-sive identification, quantification and visual-based sup-port for all sRNA types [12–17].
Even with these tools, significant challenges remain in the handling and interpretation of HTS sRNA data. An important one stems from the fact that some sRNAs map to unique locations (U_sRNAs) of a reference gen-ome, while others align equally well to multiple locations (M_sRNAs). The handling of M_sRNAs is a major concern, as it impacts downstream analyses [15], and is as yet practically unresolved with different studies (reviewed in [18]) using different approaches and sRNA analysis tools. For example, the NiBLS method allows multiple mapping without any kind of normalization for the number of mapping locations [19], the SiLoCo tool of the UEA sRNA Toolkit weights each read by its repetitiveness in the genome [20], the segmentSeq * Correspondence:[email protected]
1School of Life Sciences, University of Sussex, Brighton, East Sussex BN1 9RH, UK
Full list of author information is available at the end of the article
package of Bioconductor allocates each M_sRNA only once to a predefined locus even if it maps to more than one place within this locus or indeed across the genome [13], Novoalign (www.novocraft.com) excludes M_sRNAs, and bowtie [21] and bwa [22] randomly place each M_sRNA to a single locus under their default settings. Fi-nally, a recently updated version of ShortStack allocates M_sRNAs to single loci based on the densities of U_sRNAs [12, 18].
The importance of M_sRNAs and their handling may be dependent on the component of the genome under investigation; for instance, due to their repetitive nature, TEs are likely to map many M_sRNAs, which unavoidably complicates TE-related studies. This effect may be espe-cially prominent in plants because of their large genomes (the average size of a diploid angiosperm is ~6,400 Mb) and the fact that most plant DNA has originated from TEs [23]. This point is exemplified by contrasting data from the unusually small genome ofArabidopsis thaliana(only 125 Mb of which ~24% is TE-derived) and the larger–but still small, relative to the angiosperm average–genome of maize (2,300 MB, ~85%). sRNA mapping studies have shown that <25% ofA. thalianaTEs are mapped solely by M_sRNAs [24], but this increases to >72% for maize TEs [25]. Hence, careful consideration of M_sRNAs is crucial for understanding epigenetic processes in genomes like that of maize. The challenges of mapping sRNAs to TEs are exacerbated by the fact that accurate TE identification is a notoriously difficult task [26, 27]. To simplify the problem, previous studies have often used TE exem-plars [28–30], each of which is a consensus of many TE sequences representing a single TE family or subfamily.
The use of exemplars may be pragmatic, but it likely re-duces the analysis resolution compared to examining whole populations of annotated TEs.
Here we attempt to address the complex, but under-studied, issue of analyzing sRNAs in the context of TEs, because the impact of their treatment on analyses is presently unclear. To better assess different approaches, we focus on the maize genome and the most abundant
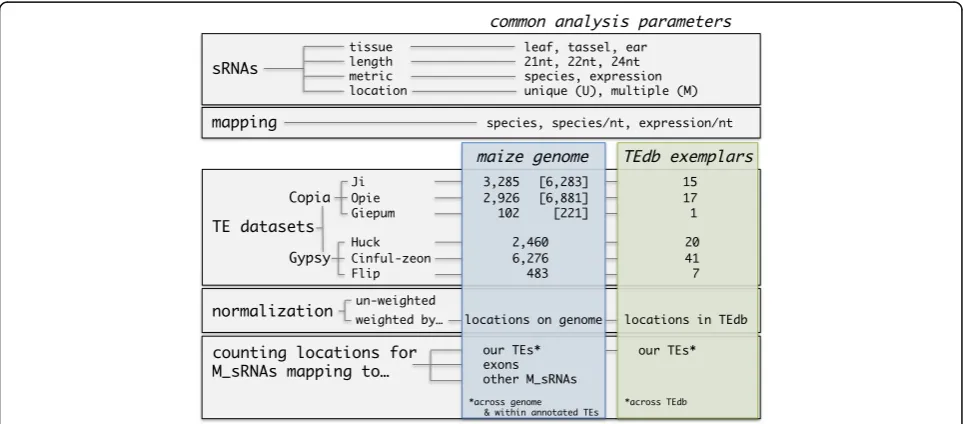
Copia and Gypsy Long Terminal Repeat (LTR) retro-transposon families. We perform standard sRNA map-ping using HTS data from three different tissues, but vary several features of the analyses, such as i) the refer-ence dataset, which ranges from whole genome TE annotations to TE exemplars, ii) the treatment of M_sRNAs, which ranges from various normalization options to their complete exclusion, and iii) the sRNA metrics, i.e. consideration of distinct sequences or their abundances. Figure 1 depicts the methodological matrix of our work, along with many of the terms that we use throughout the study. We then comment on the effect of some of these choices on the relationship of mapping with other TE features such as TE age, with low copy regions of the maize genome, or when using HTS RNA-seq data. We conclude by sharing our insights as take-home messages to guide researchers in epigenetic analyses of TEs, especially in large and complex genomes.
Methods
TE reference datasets
We compiled two reference datasets for the Copia and
Gypsy families in maize: annotated TE populations and TE exemplars.
Annotated TE populations
For Copia TEs, the Sirevirus families Ji, Opie and
Giepum encompass the three most abundant families.Ji
and Opie each constitute ~10% of the genome, and
Giepum represents another ~1.2% [31, 32]. We used a strictly curated set of 3,285 Ji, 2,926 Opie and 102
Giepumfull-length elements that were recently analyzed for their epigenetic patterns [25] (Fig. 1). ForGypsy TEs, we devised a pipeline to identify full-length elements of the three most abundant families, namely Huck (10.1% of the genome), Cinful-zeon (8.2%) andFlip(4.2%) [31]. We first retrieved the repeat annotation file from the maize TE consortium (‘ZmB73_5a_MTEC + LTR_re-peats.gff’, ftp.gramene.org). This file, however, does not specify whether an annotated region represents full-length or fragmented TEs. Hence, we plotted the frequency distribution of the lengths of the annotated regions to identify peaks for each family that would cor-respond to the size of full-length elements as calculated by Baucom et al. [31] (Additional file 1: Figure S1A). This approach identified a single peak for Huck that nearly overlapped with the Baucom full-length average (13.4 kb), two peaks for Cinful-zeon that flanked the Baucom average (8.2 kb), and two peaks for Flip – one nearly overlapping with the Baucom average (14.8 kb) and one residing in close proximity (Additional file 1: Figure S1A). Based on these results, we selected regions between 13.3–14.1 kb forHuck, 7.1–7.5 kb and 9.2–9.7 kb for Cinful-Zeon, and 14.8–15.6 kb forFlip as candidates for full-length elements, retrieving 2,614, 6,965 and 607 sequences respectively. We then ran LTRharvest [33] with parameters xdrop 25, mindistltr 2000, maxdistltr 20000,
ins −3, del −3, similar 50, motif TGCA, motifmis 1,
minlenltr100, andmaxlenltr5000 in order to identify the
borders between the LTRs and the INT domain, and to also calculate the canonical LTR length of each family. Based on our approach, we selected LTR lengths between 1–1.8 kb for Huck, 450–750 nt for Cinful-zeon, and 4.1–4.5 kb for Flip (Additional file 1: Figure S1B), finally yielding 2,460, 6,276 and 483 full-length ele-ments for each family respectively (Fig. 1).
The insertion age of each TE was calculated by first aligning the LTRs using MAFFT with default parameters [34] and then applying the LTR retrotransposon age for-mula with a substitution rate of 1.3 × 10⁻⁸ mutations per site per year [35].
TE exemplars
All maize TE exemplars were downloaded from maizeted-b.org. The number of exemplars for the six Copia and
Gypsyfamilies ranged from one to 41 consensus sequences (Fig. 1). Note that we removed oneJi (RLC_ji_AC186528-1508) and two Giepum (RLC_giepum_AC197531-5634; RLC_giepum_AC211155-11010) exemplars from our ana-lysis, based on evidence from [32] that they are not true representatives of these families.
Mapping sRNA and mRNA libraries
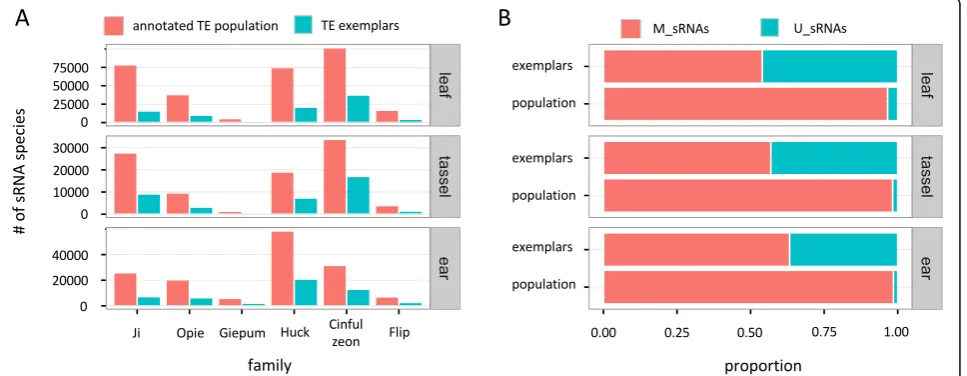
We used published sRNA data from leaf (GSM1342517), tassel (GSM448857), and ear (GSM306487) tissue (Fig. 2), and mRNA data from three technical replicates (SRR531869, SRR531870, SRR531871) from leaf tissue. Adapters and low quality nucleotides were removed using Trimmomatic and the FASTX toolkit respectively, until every read had three or more consecutive nucleo-tides with a Phred quality score of >20 at the 3’-end. The libraries were filtered for miRNAs (www.mirba-se.org), tRNAs (gtrnadb.ucsc.edu), and rRNAs and
snoRNAs (rfam.sanger.ac.uk). sRNA reads of 21 nt, 22 nt and 24 nt length and mRNA reads longer than 25 nt were mapped to the maize B73 genome (RefGen_V2) and the maize TE database using bwa with zero mismatches (‘bwa aln –n 0’). Because bwa places multiply mapping reads randomly onto one mapping lo-cation under the default setting, we selected‘bwa samse
–n 100000000’ to ensure that all alignments were reported [22]. Following previous work [25], each distinct sRNA or mRNA sequence (of any length) was termed ‘species’, and the number of its reads was its
‘expression’. Each species was tagged as either uniquely mapped (U_sRNA; U_mRNA) or multiply mapped (M_sRNA; M_mRNAs) separately for the genome and the exemplar database (Fig. 1).
M_sRNAs and M_mRNAs were either normalized by their number of mapping locations or not normalized (Fig. 1), depending on the analysis. Finally, we calculated the total number of sRNA species that mapped to a TE
‘locus’(i.e. the full-length sequence, LTRs or the internal (INT) domain), but also the number of sRNA species and sRNA expression (weighted or un-weighted) per nucleotide of each locus (Fig. 1). The per nucleotide measures allow comparisons of averages among TEs and also analysis along the length of the TE sequence.
Results
Reference datasets: TE exemplars vs. annotated TE populations
How do inferences vary as a function of the reference dataset? To investigate this, we compared sRNA map-ping patterns between annotated populations and exem-plars of six abundant families in maize. We focused on 21 nt, 22 nt and 24 nt sRNAs, because they are the sRNA lengths known to participate in the epigenetic silencing of TEs [36, 37].
sRNA mapping
We began by first examining the total number of sRNA species that mapped to each family. An initial observa-tion was that there is a much lower number of sRNAs (3-fold decrease on average) that mapped to the exem-plars compared to the annotated populations (Fig. 2a, Additional file 2: Table S1). For example, 90,503 sRNA species of the leaf library mapped to the exemplars of all six families combined, compared to 310,548 that mapped to the annotated elements.
U_sRNA and M_sRNA ratios
Previous research has suggested that U_sRNAs may exert a stronger effect on TE silencing compared to M_sRNAs, as evidenced by their more consistent correl-ation with DNA methylcorrel-ation [38], and with their associ-ation with lower levels of TE expression [24].
Accordingly, several studies have used only U_sRNAs as the basis for inference, derived either from mapping to genomes or to exemplars [29, 30, 39–41]. Our analysis showed that there is a massive difference in the U:M sRNA ratio as a function of the reference dataset: a much higher proportion of sRNAs map uniquely to ex-emplars (43% of all sRNAs for all libraries and families combined) compared to annotated TE populations (2.6%) (Fig. 2b, Additional file 2: Table S2). In fact, the vast majority of U_sRNAs that map to exemplars become M_sRNAs when mapped to the genome.
sRNA patterns along TE sequences
We next examined the mapping characteristics along the length of both exemplar and annotated TEs. We focused on the three Copia families, because of the preexisting annotation of their sequences, including information about complex palindrome motifs in the regulatory region of the LTRs that are sRNA mapping hotspots [25, 42]. We found that both datasets produced highly similar patterns, based on the ear sRNA library, with one intriguing exception: the exemplars were not mapped by sRNAs in the palindrome-rich regions (Fig. 3a). Closer investigation of the exemplar se-quences revealed that they contain long runs of masked (N) nucleotides in these regions (Fig. 3b) of high sequence variability [25], even though they may be of special biological importance due to their ele-vated sRNA mapping and rapid evolution [25]. In fact, 74 exemplars from 37 families within maizeted-b.org contain stretches of >100 N nucleotides (Huck,
Cinful-zeon and Flip were not among them), making the occurrence of masked regions a fairly common feature of this dataset. The extent of this problem is not known for other plant species that have generated exemplar datasets such as foxtail millet [43] and strawberry [44]; yet, it now needs to be assessed, es-pecially in the light of how helpful these datasets can be in combination with genomic, sRNA and RNA-seq HTS data in the analysis of the repetitive fraction of genomes [45, 46].
‘Contamination’of annotated TE populations
only two elements of the reference dataset with foreign TEs, compared to 1,158 elements of MASiVEdb that contained fragments (of 189 nt median length) from 451 non-Sirevirus families.
To examine how this might affect data interpretation, we compared the mapping characteristics of the refer-ence dataset to those of the complete MASiVEdb popu-lation. The number of sRNA species that mapped to each TE family increased substantially for MASiVEdb. Collectively, 626,836 sRNAs from the three sRNA librar-ies mapped to the 13,385 TEs of MASiVEdb, but only a third (206,589) of that total mapped to our reference dataset (Additional file 1: Figure S2, Additional file 2: Table S1). Although it is difficult to assess the overall contribution of foreign TEs, given that even very small fragments may map several sRNAs, an indication may be provided by the level of sRNA‘cross-talk’within each dataset, that is the extent to which sRNAs map to mul-tiple families. Our conjecture is that higher levels of cross-talk in MASiVEdb will reflect the presence of frag-ments of one family within elefrag-ments of another family, thereby artificially increasing their pool of ‘common’ sRNAs. Our analysis showed that indeed this was the case. For example, of the 800,421 sRNA species of all li-braries combined that mapped to Ji and Opie from
MASiVEdb (Additional file 2: Table S1), 188,926 mapped to elements of both families. This means that the num-ber of non-redundant sRNAs between Ji and Opie is 611,495 and that the level of cross-talk is 30.8% (188,926 of 611,495). In contrast, the level of cross-talk is only 3.1% using the reference dataset (6,033 of 194,582 non-redundant sRNAs, Additional file 2: Table S1). Likewise, cross-talk also increased with the Gypsy families using MASiVEdb, for example from 0.2 to 5.3% between Ji
and Huck, and from 0.2 to 10% between Opie and
Cinful-zeon.
Normalization: complexities regarding the use of M_sRNAs
Exclusion of M_sRNAs in TE studies
make meaningful inferences about TEs in hosts with large genomes.
To examine potential U_sRNA differences among plant species with varying genome sizes, we calculated the median density of 24 nt U_sRNAs per nucleotide of maize TEs (for all libraries and families combined) and compared it to those ofArabidopsis thaliana andlyrata
TEs previously reported by Hollister et al. [24]. While the median densities were only twofold different between thaliana and lyrata (0.11 vs. 0.06), these two species had a 69-fold and 37-fold difference with maize respectively (0.0016 24 nt U_sRNAs per nucleotide of maize TEs). Comparative data were not available for 21–22 nt U_sRNAs from [24], but given that only 3,522 21-22 nt U_sRNAs from all libraries mapped to the 15,532 full-length elements of the Copia and
Gypsy datasets combined, it is clear that most ele-ments did not map U_sRNAs in maize.
Normalization of M_sRNAs across genomic regions and between datasets
Besides excluding M_sRNAs from analyses or sometimes even allocating them randomly to single loci [49–51], the most common approaches for handling M_sRNAs is either to count all mapping locations so that each loca-tion has a value of 1.0, or to weight for multiple map-ping so that each location is assigned a value of 1/x, where x is the total number of locations for a given M_sRNA. This normalization can be applied to both
‘sRNA species’and ‘sRNA expression’. Nonetheless, it is unclear if and how these normalization strategies affect downstream research. One parameter that may provide valuable insights is the number of mapping locations for M_sRNAs that target various parts of a genome or
different reference datasets. The reasoning is that the smaller the x, the weaker the differences between strat-egies will be andvice versa. We therefore compared the mapping locations of M_sRNAs that target our Copia
and Gypsy families i) across the genome, ii) within their annotated full-length populations, and iii) across the TE exemplar database (Fig. 1), so as to keep in line with the various strategies of previous studies.
Focusing first on the entire maize genome, we find that M_sRNAs have an exceptionally high number of mapping locations. For example, the median number of locations for all families combined was up to 513 among the three libraries, while the average often exceeded 1,500 (Table 1). Second, there was a marked decrease in the number of locations within the annotated full-length populations (Table 1). We found that, on average, only a fifth of the genomic locations correspond to full-length elements, indicating that most M_sRNAs map to other types of sequences related to the six families, presumably unidentified full-length elements, degraded copies or solo LTRs. Third, the decrease was even more dramatic within the TE exemplar dataset, where the M_sRNAs of the six families only had three to five mapping locations each (Table 1).
The above findings were derived from the most abun-dant TE families in maize and hence represent the most repetitive parts of a large genome. To contrast them with lower copy regions, we calculated the genomic lo-cations of two additional sets of M_sRNAs: M_sRNAs that mapped to exons of the maize Filtered Gene Set and all other M_sRNAs that did not map to either exons or the six TE families (Fig. 1). We assume that a sub-stantial proportion of the last category corresponds to less abundant TE families. Our analysis showed that the
Table 1Number of locations for M_sRNAs that mapped to different parts of the maize genome
library sRNA length # of locations for sRNAs of the six familiesa # of genomic loci
for exon sRNAsa # of genomic locifor other sRNAsa
genome annotated
TE population
TE exemplars
leaf 21 283–1397 66–298 3–5 4–12 5–37
22 262–1261 70–284 3–5 4–11 5–42
24 82–613 11–121 3–4 4–12 4–21
all 127–854 18–179 3–4 4–11 4–26
tassel 21 425–2033 114–419 3–5 4–18 6–57
22 380–1615 118–369 3–5 4–15 7–60
24 199–1017 26–194 3–4 5–17 4–25
all 277–1353 60–281 3–5 5–17 4–34
ear 21 513–2130 86–411 4–5 4–14 6–55
22 454–1748 83–359 4–5 4–15 7–56
24 147–897 19–170 3–5 4–17 5–26
all 219–1231 31–241 3–5 4–16 5–32
a
mapping locations of both categories did not exceed a handful of sites (Table 1); nonetheless, the average num-ber of locations of the ‘other’ M_sRNAs was three-fold higher than the exon-mapping M_sRNAs, implying that a large proportion of the former type may indeed map to low copy TEs.
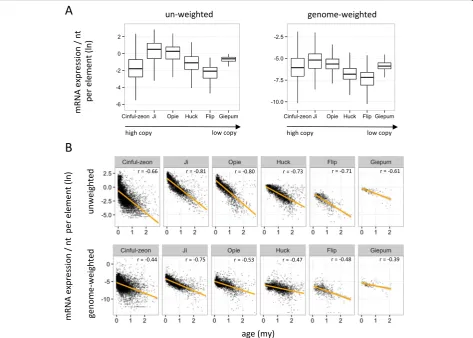
Impact of normalization on data inference
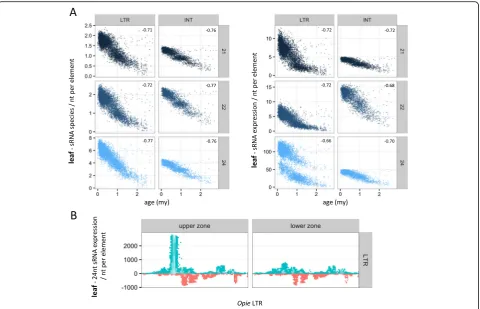
To gain further insights into how sRNA metrics can change as a function of methodology, we compared the two extremes of a theoretical ‘normalization spectrum’, i.e. un-weighted vs. genome-weighted sRNA data, in their relationship with a classic TE variable, the TE in-sertion age. The age of each element was first calculated based on the sequence divergence of the LTR pair and profiled at the family level (Fig. 4a). Use of un-weighted data generated strong negative correlations between age and both sRNA species and sRNA expression for all combinations of tissue, family and sRNA length (average Spearman r=−0.67, P< 10−20; Fig. 4b, Additional file 1: Figure S3). Critically, use of genome-weighted data retained this pattern only for 21–22 nt sRNAs (average
Spearman r=−0.35, P< 10−20 in most cases), while for 24 nt sRNAs there was discordance both between sRNA metrics and among families. We detected a positive cor-relation forJi,OpieandHuckusing sRNA species, which was often reversed or not statistically supported using sRNA expression (Fig. 4b, Additional file 1: Figure S3). In contrast, there was a negative correlation for Cinful-zeon, FlipandGiepum across most tissues and for both sRNA metrics.
U_sRNA-guided mapping of M_sRNAs
An alternative approach for mapping M_sRNAs assigns reads to single loci using as guide the local densities of U_sRNAs [18]. This method, which is at the core of the ShortStack tool [12], aims to find the true generating locus of each read. Historically, this concept was initially tested with mRNA data where it significantly improved placement of M_mRNAs [52]. For sRNAs, recent ana-lysis of simulated libraries by [18] showed that the U_sRNA-guided mode outperforms other methodologies in selecting the correct locus from which an M_sRNA may have originated.
However, our data suggest that two properties of TEs may pose a real challenge to this process. First, there is a very small number of U_sRNAs that align to our TEs. For example, only 2,166 of 147,034 sRNA species of the ear library that collectively mapped to Copiaand Gypsy
elements are U_sRNAs (Fig. 2b, Additional file 2: Table S2); furthermore, the vast majority of these U_sRNAs mapped to different TEs (Fig. 5). As a result, and given that the length of our TEs ranges between 7–15 kb and that ShortStack examines 250 nt windows [18], it is ex-pected that most windows will not have a U_sRNA score and hence vast amounts of M_sRNAs will be discarded. The second issue concerns the numerous genomic loca-tions for M_sRNAs mapping to TEs (Table 1). These are far above the 50-target cutoff that [18] suggest leads to a high rate of misplacement. Finally, ShortStack can also guide M_sRNA allocation by calculating the densities of both U_sRNAs and weighted M_sRNAs; however, this option did not perform as well as the U_sRNA-only op-tion at the genome level in Arabidopsis, rice and maize [18] and, hence, it is likely that its performance will be further compromised in TE-focused analyses.
sRNA metrics: unexpected differences between sRNA species and sRNA expression
So far, our analysis has indicated that sRNA species and sRNA expression generally produce similar results. However, this is not always true. When we examined the relationship between sRNAs and age separately for the LTRs and the INT domain of TEs using un-weighted data, we observed that the plots of theOpiefamily were markedly different in one case. The expression levels of 24 nt sRNAs from leaf on the LTRs split the Opie ele-ments in two distinct groups, whereby the ‘upper zone’ was mapped by approximately twice as many reads
compared to the ‘lower zone’ (Fig. 6a). Species of 24 nt sRNAs did not generate the same pattern, nor did other combinations of sRNA lengths and metrics in Opie
(Fig. 6a), or in other families or tissues (not shown). Closer investigation revealed that this ‘zoning’ was triggered by sRNAs that mapped to a narrow region on the sense strand of the LTRs (Fig. 6b). This region was mapped by ~115x more reads in the elements of the upper zone compared to those of the lower zone (me-dian coverage of 1,610 and 14 reads/nt respectively), while there was only a three-fold difference (6.1 vs. 2.1 reads/nt) along the rest of the LTR. This implied that highly expressed sRNA species mapping to this region of the elements of the upper zone caused the Opie split. We retrieved 836 24 nt sRNA species from all Opie
elements and, surprisingly, only one appeared to be responsible for the zoning. This sRNA combined very high expression (1,976 reads) and number of mapped LTRs (3,228), ranking 1stand 7threspectively among the 836 sRNAs. In contrast, most other sRNAs of the same region had expression levels of <10 reads.
Discussion
In this work, we attempted to address the complex issue of mapping and analyzing sRNAs in the context of TEs, which comprise the majority of animal and, especially, plant genomes.
Reference datasets
Our first objective was to compare mapping characteris-tics of TE exemplars vs. annotated TE populations, using the large and TE-rich maize genome as a case study. TE exemplars have been widely popular thus far, because of the absence of sufficient sequence information for many species or, perhaps, because research would not truly benefit from the burdensome analysis of annotated TE populations. However, our results indicate that the usage of exemplars comes with several limitations. We showed that a substantial fraction of sRNA information is lost when using exemplars (Fig. 2a, Additional file 2: Table S1). In addition, U_sRNAs are falsely overrepresented in exemplar datasets (Fig. 2b, Additional file 2: Table S2) and hence their use over M_sRNAs (e.g., [29, 30]) should be carefully considered. Finally, and perhaps most importantly, exemplars may entirely omit mapping to specific regions of TEs – most likely, those regions that evolve rapidly within a TE family (Fig. 3).
Yet, our analysis implies that a fraction of annotated TE populations may contain foreign TE fragments, or TE‘contamination’. It is likely that some types of epigen-etic analyses, for example (and as shown earlier) research on sRNA‘cross-talk’between TE families impli-cated in spreading silencing through homology-based defense mechanisms [36, 37], might be negatively Fig. 5Proportion of the number of U_sRNA species that mapped
affected by this type of ‘contamination’. Hence, it is advisable that careful filtering for foreign DNA is consid-ered prior to mapping sRNA data.
Normalization
Our next objective was to examine if and how differ-ent strategies for treating M_sRNAs might affect bio-logical inference. First, we showed that the inclusion of M_sRNA reads is necessary in TE studies, because U_sRNAs alone may convey little information at the genome level for maize and other species that do not have unusually small genomes.
We then explored the extent of multiple mapping for sRNAs across different genomic regions or data-sets in maize. We found that there can be up to a hundred-fold variation in the number of locations for M_sRNAs on maize TEs depending on the reference dataset (Table 1), especially for high-copy TEs. Fur-thermore, it is likely that this holds true for the ma-jority of plants, as most species have genomes larger than maize with concomitant TE content [23].
Next, we analyzed the relationship between sRNA mapping and TE age using un-weighted vs. genome-weighted data. Among the few studies that have investi-gated this relationship, most have shown that older TEs map lower levels of sRNAs than younger TEs [24, 25, 53]
not change as a function of age within each family, whereby the numerous young and highly similar ele-ments were mapped by more sRNAs than their few, old and divergent relatives in both normalization ap-proaches. We argue that these findings offer strong support for decreasing levels of 21–22 nt sRNAs as TEs become older, while further research is required to resolve the relationship between 24 nt sRNAs and TE age.
We lastly investigated whether approaches that as-sign M_sRNAs to single loci based on U_sRNAs density are applicable to TE studies. We concluded that, although promising, this might not be the case yet. Nonetheless, our analysis prompts another point that is well worth discussing. We believe that a dis-tinction is missing – and should be made – between approaches for finding sRNA-generating loci vs. sRNA-targeting loci. For example, ShortStack appears to work beautifully for allocating M_sRNAs to their single locus of origin, which may be valuable in miRNA studies or when organisms have small genomes as in the case of Arabidopsis thaliana [18]. However, studies that investigate sRNA targeting pat-terns may benefit more by methods that allow multiple mapping (weighted or un-weighted). This may be important for TEs, where it is possible that a given sRNA mediates silencing of more than one locus. Although not empirically proven yet, this con-jecture is supported by evidence for the importance of M_sRNAs in RdDM [38], the homology-based
trans silencing pathway among TEs [37], and the cytoplasmic step of Argonaute loading that dissociates sRNAs from their generating loci [56].
Normalization and inference for RNA-seq HTS data
We expanded our analysis by investigating mRNA expression data – the most common type of RNA-seq HTS data. Although the proportion of multiply map-ping reads against the genome in these libraries is only ~10% and substantially lower to the 40–90% of sRNA libraries [18], it is likely that a much higher proportion of TE-mapping reads will be categorized as M_mRNAs. As a result, similar methodological complications to TE epigenetic studies may apply to studies examining TE expression [57]. We therefore retrieved mRNA HTS data from three biological leaf replicates and examined (as we did with sRNAs) i) their general mapping characteristics, ii) the expres-sion patterns of TE families, and iii) the relationship between expression and TE age. First, we found that the vast majority of TE-mapping reads were indeed M_mRNAs (~90%, Additional file 2: Table S3); the median number of locations for these M_mRNAs across the genome or within the annotated full-length
elements (Additional file 2: Table S3) was approxi-mately two-fold lower to those of the TE-mapping M_sRNAs (Table 1). Second, the use of either un-weighted or genome-un-weighted data generated the same relative expression levels among families despite their widely different sizes (Fig. 7a). Finally, both normalization approaches produced strong negative correlations between mRNA expression and age for all possible combinations (average Spearman r=−0.61,
P< 10−20; Fig. 7b). These findings suggest that, at least for the specific inquiries, the methodological treatment of RNA-seq HTS data does not change bio-logical inference.
sRNA metrics
Our final objective was to test for differences derived from using the metrics of sRNA species or sRNA ex-pression. We did identify an unexpected inconsistency in relation to a narrow region in the Opie LTRs, whereby the very high expression of a single sRNA species was able to split the LTRs into two distinct zones with and without the target sequence (Fig. 6). Albeit very intriguing, the fact that only one sRNA generated this spectacular pattern raises several meth-odological concerns. First, it is likely that such very high expression levels may be the outcome of biases during library construction [15]. Second, our data imply that the use of sRNA species is more robust than sRNA expression, because it appears to be less sensitive to errors that can occur, e.g., during PCR amplification. Finally, and perhaps most importantly, these findings denote the need for the confirmation of such observations. This can be achieved by cross-examining results from different normalization ap-proaches. However, given the inconsistencies of normalization approaches as discussed previously, the most appropriate way is the inclusion in the experi-mental design of technical and/or biological replicates. In previous years, the lack of sRNA replicates could be attributed to the high costs of sequencing. These costs are now much lower and, hence, replicates should be typically included in epigenetic studies to help identify aberrancies.
Conclusions
their work. Our goal here was to fill this gap. Even though we did not empirically test or provide solu-tions for some of these issues (e.g. to resolve the 24 nt sRNA vs. TE age relationship or to find the generating locus of TE sRNAs), we aim to make our peers at least aware of these complications and help guide future studies. Towards this aim, we can pro-vide the following take-home messages:
1) TE exemplars should be – at best – cautiously
used, and replaced with annotated TE populations (additionally curated, if needed) whenever
possible.
2) The inclusion of multiply mapping sRNA and mRNA reads is necessary, in TE studies, especially in large and complex genomes.
3) Weighted and un-weighted mapping strategies should be used in parallel to help validate biological inferences.
4) Fully, or even partially, sequenced genomes should be preferred over exemplars for weighting-by-location of multiply mapping reads.
5) sRNA expression–a crucial metric for differential expression analysis studies–is prone to errors during HTS library preparation, and therefore, the inclusion of replicates in sRNA studies should now be standard.
Additional files
Additional file 1: Figure S1.Gypsy TEs length analysis.Figure S2. Total number of sRNA species that mapped to different datasets of the threeCopiafamilies.Figure S3.Relationship between TE age and sRNA mapping for leaf, tassel and ear tissues.Figure S4.Mapping patterns of three leaf replicate mRNA libraries to individual elements using un-weighted data. (PDF 5159 kb)
families combined.Table S3.Size and mapping characteristics of mRNA libraries. (DOCX 102 kb)
Abbreviations
env:Envelope; HTS: High-throughput sequencing; INT domain: Internal domain; LTR: Long terminal repeat; M_sRNA: Multiply mapped sRNA; miRNA: micro RNA; sRNA: small RNA; TE: Transposable element; U_sRNA: Uniquely mapped sRNA
Acknowledgements Not applicable.
Funding
AB is supported by the European Community’s Seventh Framework Programme (FP7/2007-2013) under grant agreement [PIEF-GA-2012-329033]; BSG by National Science Foundation grant [IOS-1542703] and a fellowship from the Albert and Elaine Borchard Foundation; ND by Ministry of Health of the Czech Republic grant nr. 16-34272A, project CEITEC 2020 (LQ1601) - computational resources were provided by MetaCentrum (LM2010005) and CERIT-SC (CERIT Scientific Cloud, Operational Program Research and Development for Innovations, Reg. no. CZ.1.05/3.2.00/08.0144).
Availability of data and materials
Supplementary data are available online. The sequences and insertion age of the TEs of all six families are available in bat.infspire.org/sireviruses/ RNAmap_tech–suppl_data/.
Authors’contributions
AB conceived the study, conducted the research, and drafted the manuscript. BSG drafted the manuscript. ND conducted the research, and drafted the manuscript. All authors read and approved the final manuscript.
Competing interests
The authors declare that they have no competing interests.
Consent for publication Not applicable.
Ethics approval and consent to participate Not applicable.
Author details
1School of Life Sciences, University of Sussex, Brighton, East Sussex BN1 9RH, UK.2Department of Ecology and Evolutionary Biology, UC Irvine, Irvine, CA 92697, USA.3Central European Institute of Technology, Masaryk University, Brno 62500, Czech Republic.
Received: 26 November 2016 Accepted: 31 January 2017
References
1. Castel SE, Martienssen RA. RNA interference in the nucleus: roles for small RNAs in transcription, epigenetics and beyond. Nat Rev Genet. 2013;14(2):100–12.
2. Axtell MJ. Classification and comparison of small RNAs from plants. Annu Rev Plant Biol. 2013;64:137–59.
3. Borges F, Martienssen RA. The expanding world of small RNAs in plants. Nat Rev Mol Cell Biol. 2015;16(12):727–41.
4. Matzke MA, Mosher RA. RNA-directed DNA methylation: an epigenetic pathway of increasing complexity. Nat Rev Genet. 2014;15(6):394–408. 5. An JY, Lai J, Lehman ML, Nelson CC. miRDeep*: an integrated application
tool for miRNA identification from RNA sequencing data. Nucleic Acids Res. 2013;41(2):727–37.
6. Garmire LX, Subramaniam S. Evaluation of normalization methods in mammalian microRNA-Seq data. RNA. 2012;18(6):1279–88.
7. Hackenberg M, Rodriguez-Ezpeleta N, Aransay AM. miRanalyzer: an update on the detection and analysis of microRNAs in high-throughput sequencing experiments. Nucleic Acids Res. 2011;39:W132–8.
8. Li Y, Zhang Z, Liu F, Vongsangnak W, Jing Q, Shen B. Performance comparison and evaluation of software tools for microRNA deep-sequencing data analysis. Nucleic Acids Res. 2012;40(10):4298–305.
9. Sablok G, Milev I, Minkov G, Minkov I, Varotto C, Baev V. isomiRex: Web-based identification of microRNAs, isomiR variations and differential expression using next-generation sequencing datasets. Febs Letters. 2013;587(16):2629–34. 10. Srivastava PK, Moturu TR, Pandey P, Baldwin IT, Pandey SP. A comparison of
performance of plant miRNA target prediction tools and the characterization of features for genome-wide target prediction. Bmc Genomics. 2014;15. 11. Zhu EL, Zhao FQ, Xu G, Hou HB, Zhou LL, Li XK, Sun ZS, Wu JY. mirTools:
microRNA profiling and discovery based on high-throughput sequencing. Nucleic Acids Res. 2010;38:W392–7.
12. Axtell MJ. ShortStack: Comprehensive annotation and quantification of small RNA genes. RNA. 2013;19(6):740–51.
13. Hardcastle TJ, Kelly KA, Baulcombe DC. Identifying small interfering RNA loci from high-throughput sequencing data. Bioinformatics. 2012;28(4):457–63. 14. Luo G-Z, Yang W, Ma Y-K, Wang X-J. ISRNA: an integrative online toolkit for
short reads from high-throughput sequencing data. Bioinformatics. 2014; 30(3):434–6.
15. McCormick KP, Willmann MR, Meyers BC. Experimental design, preprocessing, normalization and differential expression analysis of small RNA sequencing experiments. Silence. 2011;2(1):2–2.
16. Rueda A, Barturen G, Lebron R, Gomez-Martin C, Alganza A, Oliver JL, Hackenberg M. sRNAtoolbox: an integrated collection of small RNA research tools. Nucleic Acids Res. 2015;43(W1):W467–73.
17. Stocks MB, Moxon S, Mapleson D, Woolfenden HC, Mohorianu I, Folkes L, Schwach F, Dalmay T, Moulton V. The UEA sRNA workbench: a suite of tools for analysing and visualizing next generation sequencing microRNA and small RNA datasets. Bioinformatics. 2012;28(15):2059–61.
18. Johnson NR, Yeoh JM, Coruh C, Axtell MJ. Improved Placement of Multi-mapping Small RNAs. G3. 2016;6(7):2103–11.
19. MacLean D, Moulton V, Studholme DJ. Finding sRNA generative locales from high-throughput sequencing data with NiBLS. BMC Bioinformatics. 2010;11. 20. Moxon S, Schwach F, Dalmay T, MacLean D, Studholme DJ, Moulton V. A toolkit for analysing large-scale plant small RNA datasets. Bioinformatics. 2008;24(19):2252–3.
21. Langmead B, Trapnell C, Pop M, Salzberg SL. Ultrafast and memory-efficient alignment of short DNA sequences to the human genome. Genome Biol. 2009;10(3).
22. Li H, Durbin R. Fast and accurate long-read alignment with Burrows-Wheeler transform. Bioinformatics. 2010;26(5):589–95.
23. Tenaillon MI, Hollister JD, Gaut BS. A triptych of the evolution of plant transposable elements. Trends Plant Sci. 2010;15(8):471–8.
24. Hollister JD, Smith LM, Guo Y-L, Ott F, Weigel D, Gaut BS. Transposable elements and small RNAs contribute to gene expression divergence between Arabidopsis thaliana and Arabidopsis lyrata. Proc Natl Acad Sci U S A. 2011;108(6):2322–7.
25. Bousios A, Diez CM, Takuno S, Bystry V, Darzentas N, Gaut BS. A role for palindromic structures in the cis-region of maize Sirevirus LTRs in transposable element evolution and host epigenetic response. Genome Res. 2016;26(2):226–37.
26. Flutre T, Duprat E, Feuillet C, Quesneville H. Considering Transposable Element Diversification in De Novo Annotation Approaches. Plos One. 2011;6(1). 27. Ragupathy R, You FM, Cloutier S. Arguments for standardizing transposable
element annotation in plant genomes. Trends Plant Sci. 2013;18(7):367–76. 28. Diez CM, Meca E, Tenaillon MI, Gaut BS. Three Groups of Transposable
Elements with Contrasting Copy Number Dynamics and Host Responses in the Maize (Zea mays ssp mays) Genome. Plos Genet. 2014;10(4). 29. Gent JI, Ellis NA, Guo L, Harkess AE, Yao Y, Zhang X, Dawe RK. CHH islands:
de novo DNA methylation in near-gene chromatin regulation in maize. Genome Res. 2013;23(4):628–37.
30. Regulski M, Lu Z, Kendall J, Donoghue MTA, Reinders J, Llaca V, Deschamps S, Smith A, Levy D, McCombie WR, et al. The maize methylome influences mRNA splice sites and reveals widespread paramutation-like switches guided by small RNA. Genome Res. 2013;23(10):1651–62.
31. Baucom RS, Estill JC, Chaparro C, Upshaw N, Jogi A, Deragon JM, Westerman RP, SanMiguel PJ, Bennetzen JL. Exceptional Diversity, Non-Random Distribution, and Rapid Evolution of Retroelements in the B73 Maize Genome. Plos Genet. 2009;5(11).
genome: more than ten thousand elements tell the story. Plant J. 2012; 69(3):475–88.
33. Ellinghaus D, Kurtz S, Willhoeft U. LTRharvest, an efficient and flexible software for de novo detection of LTR retrotransposons. Bmc Bioinformatics. 2008;9.
34. Katoh K, Standley DM. MAFFT Multiple Sequence Alignment Software Version 7: Improvements in Performance and Usability. Mol Biol Evol. 2013;30(4):772–80.
35. Ma JX, Bennetzen JL. Rapid recent growth and divergence of rice nuclear genomes. Proc Natl Acad Sci U S A. 2004;101(34):12404–10.
36. Bousios A, Gaut BS. Mechanistic and evolutionary questions about epigenetic conflicts between transposable elements and their plant hosts. Curr Opin Plant Biol. 2016;30:123–33.
37. Fultz D, Choudury SG, Slotkin RK. Silencing of active transposable elements in plants. Curr Opin Plant Biol. 2015;27:67–76.
38. Lister R, O’Malley RC, Tonti-Filippini J, Gregory BD, Berry CC, Millar AH, Ecker JR. Highly integrated single-base resolution maps of the epigenome in Arabidopsis. Cell. 2008;133(3):523–36.
39. Law JA, Du JM, Hale CJ, Feng SH, Krajewski K, Palanca AMS, Strahl BD, Patel DJ, Jacobsen SE. Polymerase IV occupancy at RNA-directed DNA methylation sites requires SHH1. Nature. 2013;498(7454):385.
40. Panda K, Ji LX, Neumann DA, Daron J, Schmitz RJ, Slotkin RK. Full-length autonomous transposable elements are preferentially targeted by expression-dependent forms of RNA-directed DNA methylation. Genome Biol. 2016;17.
41. Zhai JX, Bischof S, Wang HF, Feng SH, Lee TF, Teng C, Chen XY, Park SY, Liu LS, Gallego-Bartolome J, et al. A One Precursor One siRNA Model for Pol IV-Dependent siRNA Biogenesis. Cell. 2015;163(2):445–55. 42. Bousios A, Darzentas N, Tsaftaris A, Pearce SR. Highly conserved motifs in
non-coding regions of Sirevirus retrotransposons: the key for their pattern of distribution within and across plants? BMC Genomics. 2010;11. 43. Bennetzen JL, Schmutz J, Wang H, Percifield R, Hawkins J, Pontaroli AC,
Estep M, Feng L, Vaughn JN, Grimwood J, et al. Reference genome sequence of the model plant Setaria. Nat Biotechnol. 2012;30(6):555. 44. Shulaev V, Sargent DJ, Crowhurst RN, Mockler TC, Folkerts O, Delcher AL,
Jaiswal P, Mockaitis K, Liston A, Mane SP, et al. The genome of woodland strawberry (Fragaria vesca). Nat Genet. 2011;43(2):109–16.
45. Diez CM, Vitte C, Ross-Ibarra J, Gaut BS, Tenaillon MI. Using Nextgen Sequencing to Investigate Genome Size Variation and Transposable Element Content. In: Grandbastien MA, Casacuberta JM, editors. Plant Transposable Elements Topics in Current Genetics. 2012. p. 41–58. 46. Tenaillon MI, Hufford MB, Gaut BS, Ross-Ibarra J. Genome Size and Transposable Element Content as Determined by High-Throughput Sequencing in Maize and Zea luxurians. Genome Biol Evol. 2011;3:219–29. 47. Bousios A, Minga E, Kalitsou N, Pantermali M, Tsaballa A, Darzentas N.
MASiVEdb: the Sirevirus Plant Retrotransposon Database. BMC Genomics. 2012;13.
48. Darzentas N, Bousios A, Apostolidou V, Tsaftaris AS. MASiVE: Mapping and Analysis of SireVirus Elements in plant genome sequences. Bioinformatics. 2010;26(19):2452–4.
49. He G, Chen B, Wang X, Li X, Li J, He H, Yang M, Lu L, Qi Y, Wang X, et al. Conservation and divergence of transcriptomic and epigenomic variation in maize hybrids. Genome Biology. 2013;14(6).
50. McCue AD, Nuthikattu S, Slotkin RK. Genome-wide identification of genes regulated in trans by transposable element small interfering RNAs. RNA Biol. 2013;10(8):1379–95.
51. Wang X, Elling AA, Li X, Li N, Peng Z, He G, Sun H, Qi Y, Liu XS, Deng XW. Genome-Wide and Organ-Specific Landscapes of Epigenetic Modifications and Their Relationships to mRNA and Small RNA Transcriptomes in Maize. Plant Cell. 2009;21(4):1053–69.
52. Mortazavi A, Williams BA, McCue K, Schaeffer L, Wold B. Mapping and quantifying mammalian transcriptomes by RNA-Seq. Nat Methods. 2008; 5(7):621–8.
53. Gong L, Masonbrink RE, Grover CE, Renny-Byfield S, Wendel JF. A Cluster of Recently Inserted Transposable Elements Associated with siRNAs in Gossypium raimondii. Plant Genome. 2015;8(2).
54. Law JA, Jacobsen SE. Establishing, maintaining and modifying DNA methylation patterns in plants and animals. Nat Rev Genet. 2010;11(3):204–20. 55. Maumus F, Quesneville H. Ancestral repeats have shaped epigenome and
genome composition for millions of years in Arabidopsis thaliana. Nat Commun. 2014;5.
56. Ye RQ, Wang W, Iki T, Liu C, Wu Y, Ishikawa M, Zhou XP, Qi YJ. Cytoplasmic Assembly and Selective Nuclear Import of Arabidopsis ARGONAUTE4/siRNA Complexes. Mol Cell. 2012;46(6):859–70.
57. Treangen TJ, Salzberg SL. Repetitive DNA and next-generation sequencing: computational challenges and solutions. Nat Rev Genet. 2012;13(1):36–46.
• We accept pre-submission inquiries
• Our selector tool helps you to find the most relevant journal
• We provide round the clock customer support
• Convenient online submission
• Thorough peer review
• Inclusion in PubMed and all major indexing services
• Maximum visibility for your research
Submit your manuscript at www.biomedcentral.com/submit