UNIVERSITY OF TRENTO
International Doctoral School in Biomolecular Sciences
XXV Cycle
“MAPPING OF POST-TRANSCRIPTIONAL REGULATORY
NETWORKS BY MEANS OF MECHANISTIC AND
HIGH-THROUGHPUT DATA”
Tutor
Alessandro QUATTRONE
CIBIO – University of Trento
Ph.D. Thesis of
Erik DASSI
1
ABSTRACT ... 2
1. INTRODUCTION ... 3
1.1 RNA-binding proteins... 3
1.2 Non-coding RNAs ... 4
1.3 Cis-elements ... 6
1.4 The landscape of PTR data ... 7
1.5 Our approach ... 7
2. RESULTS ... 9
2.1 The Atlas of UTR Regulatory Activity (AURA) ... 9
2.2 Hyper Conserved Elements (HCE) identification ... 16
2.3 PTR networks in neuroblastoma ... 25
2.4 PTR tools and database review ... 29
3. DISCUSSION ... 30
4. REFERENCES ... 34
2
ABSTRACT
Post-transcriptional regulation of gene expression (PTR) is the process responsible for modulating mRNA levels and the related amount of protein. Initially thought to have a limited impact on cell phenotype, it has become increasingly recognized as a strong determinant of the quantitative changes in proteomes, and therefore a driving force for cell phenotypes. Untranslated regions of mRNAs (UTRs) are the core mediator of this process, containing sequence and structural elements bound by various kind of regulators, which influence nuclear export, localization, stability of mRNAs and their translation rates, as well as capping, alternative splicing and polyadenylation of the transcribed pre-mRNA.
One of the most important classes of PTR factors are the RNA-binding proteins (RBPs), whose human genome complement is at least 800 genes, characterized by the presence of different functional domains. RBPs bind to the 5’UTR of a transcript often to modulate translation initiation, and to the
3’UTR usually to influence its stability or translatability.Another major group of actors in PTR are
non-coding RNAs (ncRNAs). Among them are various classes of long ncRNAs (lncRNAs), the intensively studied microRNAs (miRNAs), siRNAs (small-interfering RNAs) and several other RNA types. miRNAs bind to 3’UTRs by means of short regions of perfect sequence complementation or with some mismatches. Both RBPs and ncRNAs bind mRNAs to the so-called cis-elements, found primarily in 5’ and 3’ UTRs. These elements can be represented as recurring RNA sequences or secondary structures to which the trans factors bind to exert a control over the mRNA.
3
1. INTRODUCTION
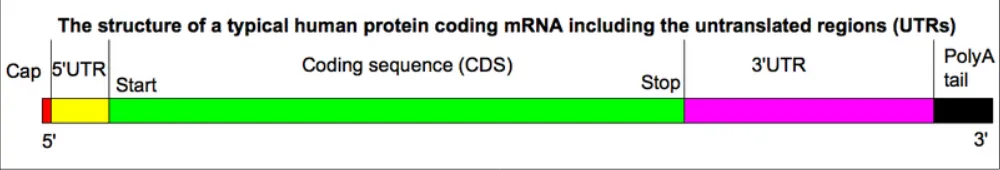
Post-transcriptional regulation of gene expression (PTR) is the process responsible for modulating mRNA levels and the consequent amount of protein products. Initially thought to have a limited impact on cell phenotype, it has become increasingly recognized as a strong determinant of the quantitative changes in proteomes [1], and therefore a driving force for cell phenotypes. As shown by Figure 1, untranslated regions of mRNAs (UTRs) [2] are the two non-coding regions upstream (5’UTR) and downstream (3’UTR) of the coding sequence in the mRNA. They are the core mediator of this process, containing sequence and structural elements, called cis-elements, which are bound by various kind of regulators to influence nuclear export, localization, stability of mRNAs and their translation rates, as well as capping, alternative splicing and polyadenylation of the transcribed pre-mRNA.
Figure 1: Structure of the human messenger RNA. The human messenger RNA (mRNA) is composed by an upstream cap, which protects it from RNases and allows the recognition by the ribosome, the 5’ untranslated region (important for modulation of translation initiation), the coding sequence which contains the protein sequence to be translated, the 3’ untranslated region (which mediates stability and translatability of the messenger) and the Poly(A) tail, which protects the mRNA from degradation and promotes its export from the nucleus into the cytoplasm.
1.1 RNA-binding proteins
4
typical RRM domain is composed by two alpha-helices with side chains stacking with RNA bases and by four anti-parallel beta-strands.
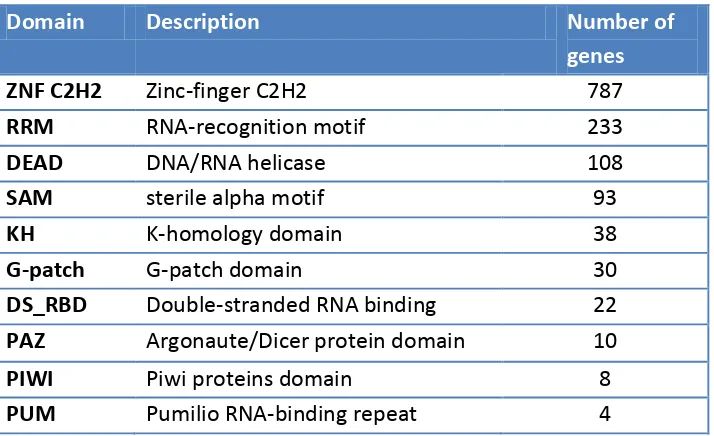
RBPs bind to the 5’UTR of a transcript often to modulate translation initiation, and to its 3’UTR often to influence its stability or translatability[3]; but they have also been well characterized for modulating splicing of the pre-mRNA, mRNA nuclear alternative polyadenylation, mRNA export, mRNA localization in the cytoplasm and mRNA cytoplasmic polyadenylation[7]. Target transcripts, sequence and secondary structure specificity are currently known just for a very small subset of this class of proteins. Experimental techniques such as SELEX[8], RIP-chip[9] and RNAcompete[10] were first developed in order to tackle this problem; nowadays, thanks to the advent of next-generation sequencing, we can exploit methods such as CLIP[11], PAR-CLIP[12] and iCLIP[13] to probe for all targets identities and binding sites of a specific RBP at once. Still, the fraction of RBPs for which these data are available is rather limited.
Domain Description Number of
genes
ZNF C2H2 Zinc-finger C2H2 787
RRM RNA-recognition motif 233
DEAD DNA/RNA helicase 108
SAM sterile alpha motif 93
KH K-homology domain 38
G-patch G-patch domain 30
DS_RBD Double-stranded RNA binding 22
PAZ Argonaute/Dicer protein domain 10
PIWI Piwi proteins domain 8
PUM Pumilio RNA-binding repeat 4
Table 1: Most frequent RNA-binding domains. The table lists the ten more frequent RNA-binding domains in human genome proteins. Domain name, short description and number of genes in which it occurs are shown.
1.2 Non-coding RNAs
5
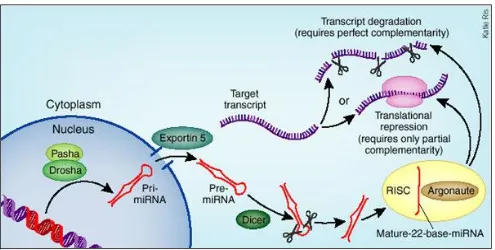
sequencing experiments, which are uncovering new members of this class. As shown by Figure 2, pri-miRNA are transcribed in the nucleus as hairpins, which are then exported into the cytoplasm and processed to mature single-strand RNAs by Drosha, Pasha and Dicer proteins; mature miRNAs can then exert their repressive function by associating with Argonaute to form the RISC (RNA-Induced Silencing Complex). A lot of work has been devoted to miRNAs since their discovery in 1993: software tools able to predict miRNA-target interactions are many and employing the most different approaches. Among these, the most used are TargetScan[16], PITA[17] and miRanda[18]. Experimentally validated miRNA binding sites are less numerous, but still significant: sites for several hundreds of miRNAs are available through databases such as miRTarBase[19] and miRecords[20]. Several other types of non-coding RNAs exist, including various classes of long ncRNAs (lncRNAs, which involvement in PTR starts to be supported by several evidences), siRNAs (small-interfering RNAs) and then piRNAs (piwi-interacting RNAs), snoRNAs (small nucleolar RNAs), snRNAs (small nuclear RNAs) and more.
6
1.3 Cis-elements
Both RBPs and ncRNAs bind to mRNAs in the so-called cis-elements, found primarily in 5’ and 3’ UTRs. These elements can be represented as recurring RNA sequences or secondary structures shared by a number of transcripts and defined by a pattern, to which the trans factors bind to exert a control over the mRNA. A well-known example of cis-regulatory elements are the AU-Rich Elements (AREs)[29], motifs rich in Us with some interspersed As or Gs shared by several thousand 3’UTRs and bound by a large number of RBPs (the so-called ARE binding proteins, ARE-BP) of which at least 23 are known[29]. A number of tools are available to predict ARE presence in a transcript, exploiting the various identified patterns of ARE occurrence. Another well characterized class of UTR cis-elements are the Iron Response Elements (IREs), which help in coordinating cellular iron homeostasis at the translational level[30] by means of the Iron Response Proteins (IRP). Figure 3 details the IRP-mediated mechanism of translation inhibition by IREs. Various other classes of cis-elements have been characterized and experimentally validated in one or more transcripts: identification of all their occurrences throughout the genome is still for the most part achieved by the application of pattern-based predictive tools such as Transterm[31].
7
1.4 The landscape of PTR data
The last years have seen a rapid increase in publications and resources dedicated to the analysis of PTR determinants, aimed at trying to unravel associated mechanisms of gene expression regulation. Of the more than twenty functioning and updated resources we identified, many are dedicated to non-coding RNAs [16,17,18,19,20,21,22,23,24,25,26,27] (to microRNAs in particular, with several prediction tools, but also to lncRNAs), only a couple databases focus on UTR annotations, and a comparable number deals with RBP, RBP-target interactions [33,34,35,36] and cis-elements [31,37,38,39,40,41,42]. Most of these resource do not proceed to the integration of the different types of determinants involved in PTR, thus providing only a very partial picture of the phenomena we are studying. Furthermore, while the limited number of high-throughput datasets is more visible (and most of the times inserted in a database as soon as it is generated), many mechanistic results still lie in the literature without being added to any database, thus loosing valuable pieces of information for a field in which the available data is quite limited. Our ability of tracing comprehensive networks of PTR, involving the different factors at play, and to precisely reconstruct the regulatory mechanisms acting on mRNAs is thus hampered by this lack of integration and scarcity of data. Fragmentation is therefore the dominant word in this field at present: this leads to a difficulty in handling the available information, both in terms of quickly finding data and actually being able to find it, preventing the PTR community to build on the amount of facts already established in the last years.
1.5 Our approach
In order to tackle this issue, we settled on implementing an integrative meta-database of post-transcriptional regulation: the Atlas of UTR Regulatory Activity (AURA). AURA is a manually curated and comprehensive catalog of human mRNA untranslated regions (UTRs) and UTR regulatory annotations; it records non-redundant, direct and experimentally assessed interactions of RNA binding proteins and microRNAs with human UTRs, along with cis-elements and several other types of annotations: among these are as SNPs, phylogenetic conservation, RNA secondary structure, gene expression profiles and RNA editing data. We focused on providing a dynamic and user-friendly graphical interface, accessible also to command-line averse biologists, which allows to perform complex queries and looking at the data both from an UTR-based or a trans factor-based point of view. Through the realization of a semi-automatic update pipeline and the availability of several ways to access the data, even in a programmatic fashion, we aim at providing a complete and effective tool which will allow and empower the discovery of novel PTR networks and mechanisms.
8
functional regions through phylogenetic conservation do exist but, excluding few works, none has focused on UTRs as interesting regions. Still, as no selective pressure on protein functionality applies to UTRs, these are unconstrained to change their sequence or structure just to fulfill their regulatory purpose: accordingly, highly conserved sequences or structures in orthologous genes would likely point to elements potentially endowed with regulatory activity. It is thus of remarkable interest to identify evolutionary highly conserved sequences in UTRs, which we called HCE (Hyper Conserved Elements). We therefore decided to implement a software pipeline allowing for such a search, both for 5’ and 3’UTR, in a large set of vertebrate species on a wide phylogenetic distance. Once these regions were obtained, we proceeded to identify groups of related motifs, looked for a benchmark of correctness for our algorithm and a cluster of HCE-bearing mRNAs whose encoded proteins carry the same motif, so defining a translational network of RBPs controlled by HuR, another RBP.
Finally, we proceeded to apply the results of the previous work, AURA in particular, to discover altered, and thus potentially disease-related, PTR mechanisms in an high-throughput neuroblastoma dataset. Neuroblastoma is the most common extra-cranial solid cancer in childhood and the most common cancer in infancy, and arises from the neural crest of the sympathetic nervous system. It most frequently originates in adrenal glands. Its most aggressive form (high-risk) bear the genomic amplification of the MYCN gene locus, and its prognosis is extremely poor; low-risk neuroblastoma presents instead fewer genomic alterations and often has a good prognosis. Our dataset is composed by total and polysomal RNA profiling of thirteen neuroblastoma cell lines. We intersected factor-target relationships contained in AURA with the differentially expressed genes (DEGs) of this datasets composed by matched total and polysomal microarray samples. The histone genes theme emerged as the most enriched and the composing mRNAs were up-regulated. We believe that such an example clearly stands for the usefulness and power of an integrated data approach for the analysis of PTR, even in complex diseases such as cancer.
9
2. RESULTS
This section will present the results obtained in the three main works on which I focused during my doctoral period, linking them to the attached papers and highlighting my specific contributions to each of them. We will start by describing AURA, its implementation details, the different kind of data it contains and the features its interface offers to its users. We will then proceed to portray the HCEs (Hyper Conserved Elements) identified by our pipeline in the UTRs, detailing the various emerging functional themes and, in particular, a fully post-transcriptional network of mRNAs coding for RRM-type proteins we uncovered. Next, the first results of a total versus polysomal gene expression profiles comparison over a neuroblastoma dataset will be described, introducing an histones-related network resulting from the application of AURA capabilities to differentially expressed genes produced by this analysis. Eventually, we will briefly describe a review about tools and databases dedicated to PTR which I also wrote during my doctoral period.
2.1 The Atlas of UTR Regulatory Activity (AURA)
The Atlas of UTR Regulatory Activity (AURA, available at http://aura.science.unitn.it) is a database
10
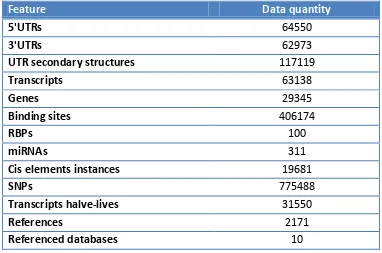
Feature Data quantity
5'UTRs 64550
3'UTRs 62973
UTR secondary structures 117119
Transcripts 63138
Genes 29345
Binding sites 406174
RBPs 100
miRNAs 311
Cis elements instances 19681
SNPs 775488
Transcripts halve-lives 31550
References 2171
Referenced databases 10
Table 2: Most relevant AURA figures. The table lists the figures summarizing the data contained in AURA: in particular the number of binding sites, of RBP, miRNAs and cis-elements involved. Auxiliary annotations figures are also included. The references item represents the number of papers relating to data contained in the database.
A great deal of attention has been placed into realizing a dynamic and user-friendly graphical interface. The website was implemented with the Django Python platform and is all AJAX-based, meaning it updates just the part of the pages which need to be, avoiding whole-page reload times and hassle. Two search modalities are available: the user can query a “target locus” or a “trans factor”, respectively. The former query returns a list of genes whose HGNC gene symbol or synonyms contain the search term; each gene in the list is annotated with its functional description, synonyms and UTRs. Furthermore, an exon-intron map of the UTRs is provided in order to allow proper discrimination between the different transcripts of a gene. Figure 4 illustrates an example search results page for this modality, highlighting the intuitive interface and its various options. On the other hand, the latter query results in a disambiguation list where all the trans-factors, whose names or synonyms contain the search term, are shown; once the user selects the intended trans-factor, AURA returns the list of
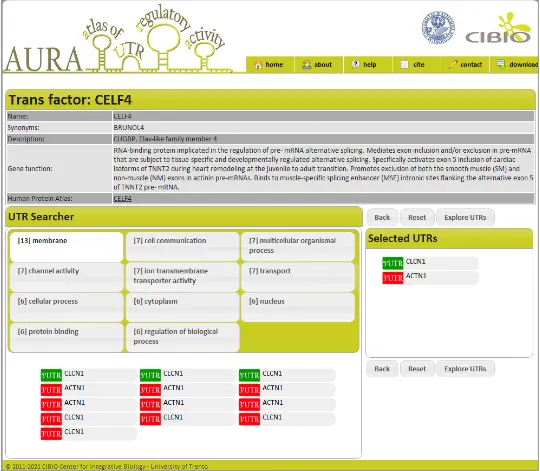
its target UTRs. These UTRs can be grouped by GO slim categories1 or by chromosome mapping.
Furthermore, before launching the search, the user can select to filter the results by a combination of supporting experimental evidences. Figure 5 shows the results page of this search type, with trans-factor details and target UTRs grouped by GO terms in this case. This kind of visualization allows a first inference on the role of the trans-factor by just considering the functional grouping of its target, thus empowering the selection of UTRs to be analyzed in detail.
Both search modes result, for the selected UTRs, in a page composed by a genome-browser like view for each of the UTRs: this type of display, highly dynamic, allows the user to explore the whole range
1
11
of interactions, or focus on a specific part of the sequence, or a kind of factor (data can even be
hidden from the visualization) concerning the analyzed UTR. Selected UTRs are shown in an “UTR
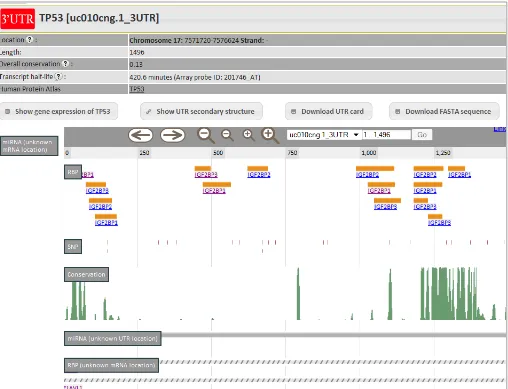
view”, illustrated by Figure 6, consisting of two elements:
The textual header containing: the chromosomal position and length of the spliced UTR, the
HGNC name and UniProt description of the gene the UTR belongs to, and the link to the Human Protein Atlas (HPA) database. Also shown are the overall conservation, which is the mean PhastCons single nucleotide conservation score for the UTR, and the corresponding transcript half-life according to a transcriptome-wide mRNA stability measurement assay.
The AURA sequence browser, based on the JBrowse platform, contains all the annotations
related to a specific UTR, i.e., multiple tracks annotating the UTR by evolutionary conservation, single nucleotide variation and cis regulatory binding sites. The “Conservation” track displays the score calculated for each nucleotide in the UCSC 46 species alignment. In the “SNP” track, AURA integrates the single nucleotide polymorphisms (SNPs) recorded in the dbSNP database allowing the user to combine with the other annotation tracks to look for variations of potential impact in PTR. The “RBP” track contains the RBP binding sites, while the “miR” track contains the microRNAs binding sites. The “RNA editing” track contains data about the UTR bases which have been found to be edited (mostly A>I conversions) after transcription. Two further tracks are provided to show the trans factors for which only partial information is available. The “unknown mRNA location” track denotes the trans-factors known to bind a transcript without any further mapping information. Instead, the “unknown UTR location” track indicates the trans factors whose UTR binding site is unknown. All the annotations in the tracks are clickable: whenever the user clicks on an annotation, a description page containing binding sites and cross-references is shown. In this view, the minimal energy predicted secondary structure together with the color-coded nucleotide phylogenetic conservation, SNP locations and trans-factor binding sites of the selected UTR can be optionally drawn through VARNA. All annotations are linked to their source, either a PMID indicating the publication or an ID relating to the original database (as in the case of dbSNP).
12
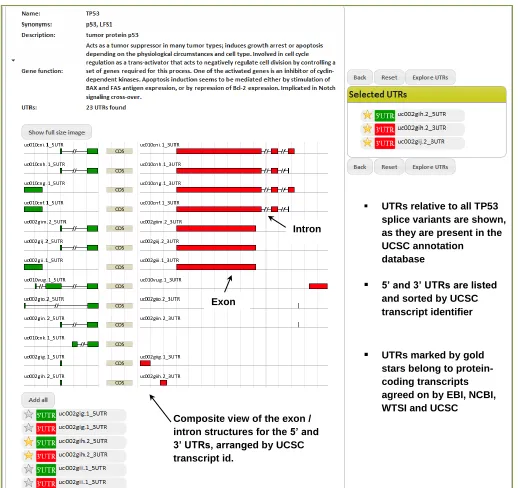
Figure 4: Gene-based search in AURA. The figure displays the interface presented to the user when searching for the UTRs of a specific gene. On the left one can see the panel describing the gene (name, synonyms and function) and depicting all its different UTRs along with the exon-intron structure of the related transcripts. UTRs can then be dragged onto the right panel which, as a cart-like feature, allows to include UTRs from
different transcripts and genes at once. Selected UTRs can then be explored in detail through a genome-browser like view.
UTRs relative to all TP53 splice variants are shown, as they are present in the UCSC annotation
database
UTRs marked by gold stars belong to protein-coding transcripts agreed on by EBI, NCBI, WTSI and UCSC
5’ and 3’ UTRs are listed and sorted by UCSC transcript identifier
Composite view of the exon / intron structures for the 5’ and 3’ UTRs, arranged by UCSC transcript id.
Exon
13
14
15
Aside from accessing and searching the database through its web interface, a more experienced or bioinformatics-oriented user can take advantage of the other options we provide to mine the data contained in AURA: first of all, the complete set of annotation of a single UTR, which we call UTRcard (including secondary structure, conservation, binding sites, and more), is downloadable from the UTR view, by composing the URL of the UTR in the browser or through a script; the whole MySQL database can also be downloaded and replicated on a local machine (schema description is provided); eventually, a BioMart, called AuraMart, is available and let users query the data in a simple and standard way through the BioMart platform (the same as used by Ensembl BioMart and many other major websites): having already used a Mart, an user will just need to know which data he or she wants to extract from the database, being able to exploit the query knowledge he or she has already acquired. Batch search and analysis tools are currently being developed and will soon be integrated in AURA.
16
2.2 Hyper Conserved Elements (HCE) identification
Wefirstly aimed at identifying HCEs in the 3’ UTRs of the human exome by a seed extension strategy:
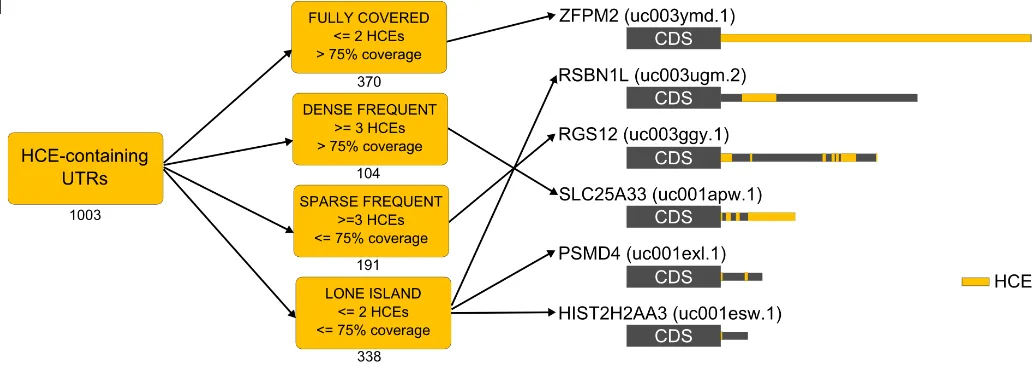
these were derived from the human genome, by a custom pipeline (Figure 7A). We took advantage of the 44-way vertebrate UCSC alignment, from which we derived the phastCons sequence conservation score ([43], which we call SCS) for each base of the exon sequences annotated as 3’UTRs. We also computed, for each base, the Branch Length Score (BLS), defining the degree of sharing of conservation among the vertebrate species considered [44]. We firstly obtained short footprints of very high phylogenetic invariance represented by fully conserved 5-bases seeds (SCS >= 0.95 and BLS >= 0.85); we then extended these seeds upstream and downstream until they reached a preset threshold on our conservation score, which we called HCS (Hyper Conservation Score, computed for each base of the UTRs as the weighted average of SCS and BLS). The 3’UTR-HCE identification algorithm produced 3149 HCEs, belonging to 1010 3’UTRs, which corresponded to 877 genes. At least one 3’UTR HCE is thus present in only 1,8% of the total human 3’UTRs, and collectively HCEs cover only 0.47% of the 3’UTR space, making them extremely rare. They have an average length of 100 bases, but their length distribution (Figure 7B) is such that more than 77% of their total number is shorter, being only 4.5% of them over 500 bases. Their UTR coverage (Figure 7C) is instead prevalently low (25% or less of the 3’UTR) or high (75% or more of the 3’UTR). Together, these distributions show that 3’UTR-HCEs are relatively short and that they either occupy a small portion of a 3’UTR or the most of it. When multiple HCEs are present on an UTR, these have a clear tendency to localize in clusters, as indicated by the very small inter-HCE distance, 25 bases or less (Figure 7D), and to be spread along the 3’UTR, with 25% of the HCEs start nucleotides concentrated on the first 10% of the 3’UTR (Figure 7E). These elements are much richer in AU than in GC bases (Figure 7F, p-value 2.2E-16), and are by far more highly structured than random 3’UTR sequences of the same length, being structural density defined by the fraction of unpaired bases in the HCEs secondary structure(Figure 7G, p-value 1.2E-13). To provide a snapshot on HCE architecture diversity, we distributed HCE-bearing 3’UTRs into four classes, depending on their number and coverage. These classes, reported in Figure 7H, efficiently represent this diversity.
17
sites, at least 12 nucleotides long, involving 169 unique random HCEs (5.37%) and 39 different lncRNAs. We eventually scanned HCEs and random HCEs for matches with the position-frequency matrixes extracted from RBPDB [35]. Considering only matches with a minimum score of 80% and a matrix length greater than 4, we obtained 1.8 times more matches in the HCEs than in random HCEs (17173 matches for HCEs versus 9443 matches for random HCEs).
18
Figure 7: HCEs in 3’UTRs of the human exome are short, scattered and highly structured. The overall HCE identification pipeline is shown in a), with the lower part detailing the algorithm searching for seeds and extending them to lead to the final HCEs. b-g) highlights the most relevant features of the HCEs: b) shows the length distribution of HCEs and c) the percent coverage of 3’UTRs by these d) displays the AU predominance over CG in HCE base composition and e) the prevalence of highly-structured HCEs; f) displays the distribution of distances between HCEs on the same UTRs and g) the HCEs distance distribution from UTR start, indicated in percent over the UTR length. h) shows the classification of 3’UTRs in four classes according to their HCE content on the right. Numbers below each class box indicates the number of HCE-containing 3’UTRs belonging to the class. On the right, a sample of six HCE-containing 3’UTRs: HCEs are mapped onto their UTR and represented as yellow areas in a grey rectangle representing the full-length 3’UTR. Arrows from class boxes to UTRs indicates which UTR belongs to which class.
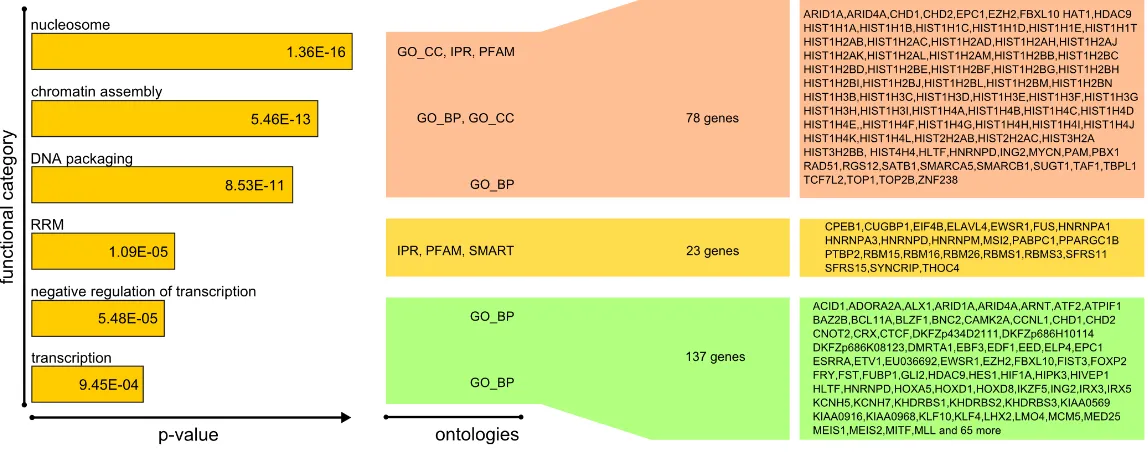
In order to appreciate the whole spectrum of biological functions expressed by 3’UTR-HCE containing genes, we performed an ontological enrichment by means of DAVID[50] (using Gene Ontology, InterPro, Smart, PFAM and KEGG ontologies) on the 877 genes bearing at least one HCE in their 3’UTR. We identified three gene groups endowed with high significance (Figure 8).
The first group is composed by 78 genes involved in chromatin structure (terms “nucleosome”, “chromatin assembly”, “DNA packaging”), including 51 (53.6%) of the 95 histone genes present in the human genome. It is well known that histone gene mRNAs all have a short 3’UTR, lacking a poly(A) tail, which is bound by the stem-loop binding protein (SLBP) in the cytoplasm to stabilize histone mRNAs and mediate their translation [45]. Alternative to polyadenylation, this mechanism is very ancient and is conserved over a wide evolutionary distance. We therefore hypothesized that the HCEs in the histone 3’UTRs were SLBP binding sites. In order to verify this, we aligned the SLBP binding motif to these HCEs and found a considerable fraction of these to contain a close, where not perfect, match to the known SLBP motif. Therefore, the algorithm we derived to select for HCEs is able to precisely identify cis-elements involved in a conserved and well demonstrated post-transcriptional
19
regulatory process: we therefore assumed this finding as an effective benchmark for the ability of 3’UTR HCEs to point to circuitries of phylogenetically old post-transcriptional control.
The second highly significant gene set is about the broad activity of transcription and mainly composed by genes involved in its repression. The 137 identified genes suggest that transcription factors like EPC1, TFAP2D and YY1 and cotranscriptional repressors such as FOXP2, MEIS2 and EZH2 can be heavily controlled at the post-transcriptional level, being their 3’UTR almost entirely highly conserved.
Figure 8: HCEs clusters in genes belonging to three different biological functions. Ontology enrichment analysis of HCEs-containing genes highlights three groups of genes corresponding to three different biological functions. Multiple ontologies were used to infer possible functional groupings: the results exposed a most significant group composed of genes involved in chromosome assembly, a significant set consisting of 23 genes coding for RRM-containing proteins and a third, less significant group of genes playing a role in transcription. Here are shown the ontology terms clusters giving rise to these groups, along with their enrichment p-value and the final list of involved genes.
20
21
Figure 9: HCE-containing 3’UTRs of the RRM genes subset share a sequence and secondary structure motif.
HCEs contained in the group of RRM genes 3’UTRs were scanned for both sequence and secondary structure motifs. The first search returned two, almost identical, 12-bases motifs; the second one produced a 17 bases hairpin which, after examination by means of a multiple alignment, emerged to contain a 12-bases core markedly similar to previously identified sequence motifs. This core represents the loop part of the hairpin which, as the two searches are quite concordant on it, may indeed represent a binding motif for the key actor of the regulatory network we are trying to uncover. a) shows the alignment between sequence and secondary structure motifs b) shows the secondary structure motif and its sequence/structure motif. c) motif instances (yellow areas) mapped on their respective full length UTR (grey rectangle).
22
of the hairpin so as to make it fold correctly when not in context. The loop part was designed by employing the most probable nucleotides of sequence and structure motifs. Positive controls pulldown probes are YB1 and PTB: their known binding motifs where obtained from the RNAcompete paper [10]. Again, the lowest part of the stem was slightly modified so as to make it fold as desired. Negative controls HuR probes are Mut1, Dbl-Mut2 and Degenerate. The Degenerate probe was synthesized by allowing all four nucleotides to be present at each loop position, so to obtain a mixture of probes bearing all the possible 5-mers loops. The Dbl-Mut1 and Dbl-Mut2 probes were obtained by mutating two nucleotides of the original probe loop, in a way to preserve it in the first case and to obtain a 3-mer loop instead of a 5-mer in the second one. b) shows the HuR pulldown western blots. From the leftmost to the rightmost band: input, HuR probe, Dbl-Mut1,Dbl-Mut2, Degenerate probe and denaturized beads bands. As can be readily seen, the hairpin probes bind to HuR with a marked specificity for the correct probe with respect to degenerate and mutated probes. c) - d)PTB and YB1 pulldown. From the leftmost band to the rightmost: input, YB1/PTB probe, and denaturized beads. As shown by Western Blot images, the hairpin probes bind to PTB and YB1 respectively, thus confirming that the pulldown protocol works as expected.
With the motif confirmed to be recognized by HuR, we next sought to understand whether HuR had a marked preference for RRM-containing genes with respect to RNA-binding domains and the most frequent domains in the genome. To compute this enrichment, we took advantage of a HuR PAR-CLIP dataset published by Lebedeva et al. [49]. We extracted all HuR 3’UTR binding sites from this dataset and obtained the genes to which these UTRs belonged. We then computed, by means of the Fisher test, the enrichment of genes containing the most common RNA binding domains (Zinc Finger, RRM, KH,SAM) with respect to the most frequent domains in the genome (IG-like, GPCR superfamily, Serine Threonine kinase and Olfactory Receptor) and to the complete set of RBPs. Results are shown in Figure 11a): RRM domain resulted to be significantly enriched with respect to all these domains and RBPs, being the only RNA-binding domain having a significant enrichment in all cases. This suggests, as was our hypothesis, that HuR has a marked preference for RRM-bearing genes regulation. We then plotted all 3’UTR HuR targets identified by Lebedeva along with our group of RRMs, to highlight overlapping and unique genes of the two sets. The resulting intersection counts are shown in figure 11b, while the network is shown in Figure 11c) and discriminates between genes categories by means of shapes and colors, as shown in the bottom part legend. Nine out of the 23 HCE-containing RRMs are not identified by Lebedeva as being bound by HuR and in particular, 4 of them are among the ones we validated by RT-PCRs. Figure 12a) shows the results of the RIP validation of interaction between HuR and four HCE-containing target mRNAs; Figure 12b) displays the western blot confirming HuR silencing in the cell line we used for the last step, the RT-PCR polysomal validation we performed on four of the 23 genes (shown in Figure 12c)): all of them show a translational repression effect, suggesting a stabilizing effect for HuR when bound to these mRNAs.
23
proteins and isolated the secondary structure used for the pulldown experiment. After the experimental part verifying HuR binding and the specificity of these interactions, I crossed the group of RRM genes with data in AURA and the other high-throughput works on HuR. Once completely mined, I will insert HCEs into AURA as additional cis-elements, able to provide even more clues on the post-transcriptional regulatory events involving a given UTR under study.
Figure 11: HuR has a preference for binding to the 3’UTR of RRM-type RBPs.
24
Figure 12: HuR and RRM 3’UTRs interaction properties. The network of HuR binding to mRNAs for RRM-type RBPs is a functional translational network.
25
2.3 PTR networks in neuroblastoma
We eventually proceeded to analyze a set of microarrays performed on neuroblastoma cell lines. Our dataset was composed by 13 samples, profiled at both the total and the polysomal RNA levels by means of Agilent Human 44k microarrays. All samples bear the MYCN gene locus amplification, marker of the most aggressive form of the disease; other genomic alterations are also present but not uniformly across the cell lines. We started by quality filtering and quantile normalizing the 26 arrays: this was done by means of the R software and the Bioconductor package. We then proceeded by employing four algorithms to compute the differentially expressed genes (DEGs), namely PCA, RankProd, SAM and the T-test (again by means of R and by selecting a p-value threshold of 0.01 for all four algorithms). The resulting proportion of DEGs (illustrated by Figure 13) varies widely between the methods, with PCA producing just 118 genes as differentially expressed and SAM returning as much as 2743 genes. We thus selected RankProd-derived DEGs as our reference list of up- and down-regulated genes (1335 genes).
Figure 13: Different methods identify largely varying degrees of DEGs in the comparison in polysomal versus total mRNAs. We performed DEGs selection with four different methods, perceived as progressively more stringent. Indeed, while the t-test and SAM identify around 24% of the genes as significant DEGs, RankProd falls down to 12% and the PCA calls little more than 1% of the genes as differentially expressed. We selected RankProd DEGs as our reference genes for subsequent analysis.
In order to understand which processes and functions were represented in the DEGs groups, we subjected the up- and down-regulated lists to functional enrichment analysis by means of DAVID [50], employing the Gene Ontology, InterPro, Smart, PFAM and KEGG ontologies. Enrichment p-value were corrected for multiple testing by the Benjamini-Hochberg correction. This analysis highlighted several themes (coherent grouping of terms) as significant: in particular, a theme
we called Histone, composed by terms such as “Histone”, “nucleosome”, “chromatin assembly”,
“Histone-fold” and many others, was found to be highlighted by most of the employed ontologies
26
shown by Table 3, were either composed by a low number of genes or supported by just one ontology, making them less interesting to focus on. We thus decided to pursue the histone theme and perform further analysis on it.
Functional theme Status Ontologies # of
genes
Average theme p-value (-log10)
Histone Up-regulated GO, Smart, Interpro,
PFAM
64 15.659
Mitochondrion Up-regulated GO 31 2.537
ATP-binding Down-regulated GO 88 13.661
mRNA processing Down-regulated GO, KEGG 29 5.674
Table 3: Significant up- and down-regulated functional themes in neuroblastoma polysomal versus total comparison. The table shows the significant functional themes (grouping of ontology terms with coherent functional meaning) emerging from DEGs lists in our neuroblastoma dataset. The status column indicates whether genes composing the theme were up- or down-regulated, while average theme p-value was computed as the –log10 geometric mean of the single terms p-values. While all four themes are statistically significant, it is immediately clear that the histones theme is stronger both in terms of significance and of being highlighted by both gene-based and protein-based ontologies.
27
the two TNRC (6B and 6C), known to have a role in miRNA-mediated mRNA repression. On the same line, various AGO family proteins have been found to bind different histone genes. Eventually, ARE cis-elements are shared by many histones, fact that can be crossed with the binding of AUF1 and HuR that we discussed above. No data is contained in AURA for 12 histones UTRs, suggesting the need to study the post-transcriptional interaction of these genes in a more complete way, possibly by applying techniques such as protein pulldown (to understand regulators of a given mRNA) or PAR-CLIP (to discover all target genes of a possible histone regulator protein).
My contribution in this work consisted in the analysis of the microarrays data produced out of our samples, the identification of differentially expressed genes and the consequent functional analysis of these gene lists; then I performed the intersection with AURA of the functionally coherent groups of DEGs and the construction of the PTR network shown in Figure 14.
29
2.4 PTR tools and database review
In the frame of my doctoral work, identifying and characterizing the available resources on PTR has been a necessary task. Obtaining an overview of data types, amounts and the way in which these were accessible has been a prerequisite to develop AURA and to proceed with the other parts of my work. Thus, writing a review that would serve both as a catalog and as an initial “PTR toolbox” fitted
naturally in the context of my activities. The review, recently published by RNA Biology starts by
classifying the resources (both databases and software tools) according to their biological focus (RBPs, ncRNAs, cis-elements): on top of these foundations, we propose a PTR analysis pipeline which we eventually apply to a breast cancer microarray dataset in order to exemplify its operation and usefulness.
30
3. DISCUSSION
The post-transcriptional regulation of gene expression field has witnessed a lot of developments in the last few years. Still, the amount of work dedicated to it lies far behind that devoted to, for instance, transcriptional regulation. Aside from the lack of mechanistic studies, which can be compensated only by laboratory activity, the main issue we see in the field lies in the fragmentation and dispersion of currently available data: this makes even more difficult obtaining a global and comprehensive picture of this layer of gene expression regulation, let alone identifying new regulatory mechanisms by leveraging on the existing amount of data. Indeed, only three tools among the available ones attempt to integrate different component of PTR networks, such as RBP, miRNA or cis-elements.
AURA can be considered as a “meta-database” integrating for the first time several useful and reliable sources. Differently from all the other available resources (UTRdb/site, RBPdb, doRiNA), AURA integrates the most informative UTR annotations generated by other databases and genome browsers with sequence-based general information (exon-intron structure, evolutionary conservation, intraspecies variation) and with gene- and transcript-centered annotations, such as ontological hierarchies, variability of protein levels in different tissues and transcript stability.
UTRdb[33] is the only other resource to be UTR-centered as AURA. Along with the basic annotations it offers a good amount of data, providing cis-elements prediction through the cognate site (UTRsite). The UTR annotation by phylogenetic conservation is available by both AURA and the last release of UTRdb; however AURA relies on a broader and more updated set of multiple species alignments (phastCons46way, Fujita et al., 2011), as compared to UTRdb (phastCons17way, Fujita et al., 2011). Both RBP and miRNA binding sites datasets are more complete and obtained through more sources in AURA than in UTRdb. Furthermore, whereas the latter provides only conserved elements, the former displays the direct base-wise conservation scores in order to allow a more flexible reuse of this information. On the other side, UTRdb provides structural conservation scores absent in AURA. Furthermore, AURA uniquely collects experimental estimations of transcript stability and of transcript abundances, and the levels of proteins in different tissues. These indicators may result essential when needing to embed the regulatory interactions stored in AURA in a meaningful biological context.
31
With respect to AURA, doRiNA[36] contains just RBP and miRNA binding sites information: the former are collected only from high-throughput experiments such as PAR-CLIP for RBP and the latter originate from a set of predictions. AURA is more complete in including also experimentally validated miRNA binding sites and mechanistic assays-derived sites for RBP. As a consequence, while providing this data is useful and interesting, also doRiNA lacks the integrative approach necessary to provide a global overview of PTR.
AURA does not yet offer analytical tools (although some are in preparation); this is in contrast with the other databases which offer them to various extents. However, AURA is the only resource of the lot to provide a BioMart query system. BioMart is a standard platform allowing to query various databases from the same interface and in the same way: this is a very powerful feature, as anyone used to query through BioMart will be able to extract any data from AURA in a matter of minutes, without having to learn a new system from scratch.
Nevertheless, In order for AURA to be complete, a thorough literature search would be necessary to retrieve and insert all past PTR data available, resulting from mechanistic experiments: however, while text mining tools may help in reducing complexity and the number of articles to be examined, this task is extremely time-consuming and would need the dedicated effort of more than one individual to be accomplished. Moreover, in order to be even more effective, AURA needs to offer batch analysis tools to its users. Some of these are already being developed and will be ready for AURA 2.0. In particular, these will include the network-generating scripts presented in the results section, a regulator enrichment computation (through Fisher tests and similar) tool and more. Eventually, there are now a number of additional UTRs extracted from next-generation sequencing experiments: adding these isoforms to the standard set of UTR annotation would enrich the database and its completeness (even though these UTRs are currently annotated in a very limited way). NGS-derived tissue-specific expression profiles are also available now: additional mRNA and possibly protein expression profiling dataset would further facilitate the integrated inference of regulatory mechanisms. Eventually, perfecting an automated data update pipeline and continuing to add new data types will be essential for keeping the usefulness of AURA at its top.
32
generation of a large number of false positives as an effect of the high multiplicity of action of several studied trans-factors.
Concerning the second part of my work, we have demonstrated the HCE identification algorithm to be sensitive and specific enough to retrieve both already known (histones – SLBP) and novel post-transcriptional regulatory mechanisms (RRM – HuR). In order to extract as much information as possible from these HCEs we will need to analyze them one by one (excluding the ones included in the above groups): a possible way would be to setup an high-throughput luciferase screening to understand the role of these region in modulating protein levels (and the responsible of this modulation). That amounts to testing around 3000 regions, which could be long and time consuming: to focus on the most interesting candidates we will need to devise a prioritization strategy that could be based on the pathway or processes in which HCE-containing genes are involved. This needs to consider the fact that, as shown in the results section, a number of HCEs corresponds to the entire 3’UTR: in these cases we can affirm that conservation concerns the whole regulatory factors for that transcript, and not single binding sites. These HCEs will thus need to be treated in a separate way to isolate relevant subparts of the sequence. Another aspect currently not taken into account by our algorithm is secondary structure conservation: sequence with an higher degree of variation may lead to the same structural element (for instance an hairpin, or a bulge), and in a number of cases the conformation may be more important than the sequence for protein recognition of the binding site. We would thus need to define a structural conservation measure and identify these elements to complete our picture of conservation-based post-transcriptional functional elements in UTRs. Eventually, we will then proceed to the analysis of 5’UTRs HCEs, identified by our pipeline but not studied in this work: more than mRNA stability or localization or polyadenylation, as in the 3’UTR, translation initiation regulation will most probably be the process influenced by these regions in 5’UTRs.
33
34
4. REFERENCES
1. Moore MJ. From birth to death: the complex lives of eukaryotic mRNAs. Science 2005;
309(5740):1514-18.
2. Mignone F, Gissi C, Liuni S, Pesole G. Untranslated regions of mRNAs. Genome Biol 2002;
3(3):REVIEWS0004.
3. Glisovic T, Bachorik JL, Yong J, Dreyfuss G. RNA-binding proteins and post-transcriptional gene
regulation. FEBS Lett 2008; 582(14):1977-86.
4. Castello A, Fischer B, Eichelbaum K, Horos R, Beckmann BM, Strein C et al. Insights into RNA
Biology from an Atlas of Mammalian mRNA-Binding Proteins. Cell 2012; 149(6):1393-406.
5. Baltz AG, Munschauer M, Schwanhäusser B, Vasile A, Murakawa Y, Schueler M et al. The
mRNA-Bound Proteome and Its Global Occupancy Profile on Protein-Coding Transcripts. Mol Cell 2012; 46(5):674-90.
6. Lunde BM, Moore C, Varani G. RNA-binding proteins: modular design for efficient function.
Nat Rev Mol Cell Biol 2007; 8(6):479–90.
7. Andreassi C, Riccio A. To localize or not to localize: mRNA fate is in 3'UTR ends. Trends Cell Biol
2009; 19(9):465-74.
8. Ellington AD, Szostak JW. In vitro selection of RNA molecules that bind specific ligands. Nature
1990; 346:818–822.
9. Tenenbaum SA. Identifying mRNA subsets in messenger ribonucleoprotein complexes by using
cDNA arrays. Proc. Nat. Acad. Sci. 2000;97(26):14085–14085.
10.Ray D, Kazan H, Chan ET, Peña Castillo L, Chaudhry S, Talukder S, Blencowe BJ, Morris Q,
Hughes TR. Rapid and systematic analysis of the RNA recognition specificities of RNA-binding proteins. Nat Biotechnol. 2009;27(7):667-70.
11.Ule J, Jensen KB, Ruggiu M, Mele A, Ule A, Darnell RB. CLIP Identifies Nova-Regulated RNA
Networks in the Brain. Science 2003; 302(5648):1212-5.
12.Hafner M, Landthaler M, Burger L, Khorshid M, Hausser J, Berninger P et al.
Transcriptome-wide identification of RNA-binding protein and microRNA target sites by PAR-CLIP. Cell 2010; 141(1):129-41.
13.König J, Zarnack K, Rot G, Curk T, Kayikci M, Zupan B et al. iCLIP reveals the function of hnRNP
particles in splicing at individual nucleotide resolution. Nat Struct Mol Biol 2010; 17(7):909-15.
14.Ørom UA, Nielsen FC, Lund AH. MicroRNA-10a binds the 5'UTR of ribosomal protein mRNAs
and enhances their translation. Mol Cell. 2008;30(4):460-71.
15.Filipowicz W, Bhattacharyya SN, Sonenberg N. Mechanisms of post-transcriptional regulation
by microRNAs: are the answers in sight? Nat Rev Genet 200 2008; 9(2):102-14.
16.Lewis BP, Burge CB, Bartel DP. Conserved seed pairing, often flanked by adenosines, indicates
that thousands of human genes are microRNA targets. Cell 2005; 120(1):15-20.
17.Kertesz M, Iovino N, Unnerstall U, Gaul U, Segal E. The role of site accessibility in microRNA
35
18.John B, Enright AJ, Aravin A, Tuschl T, Sander C, Marks DS. Human microRNA Targets. PLoS
Biol. 2004; 2(11):1862-1879.
19.Hsu SD, Lin FM, Wu WY, Liang C, Huang WC, Chan WL et al. miRTarBase: a database curates
experimentally validated microRNA-target interactions. Nucleic Acids Res 2011; 39(Database issue):D163-D169.
20.Xiao F, Zuo Z, Cai G, Kang S, Gaso X, Li T. miRecords: an integrated resource for microRNA-target interactions. Nucleic Acids Res 2009; 37(Database issue):D105-110.
21.Yang JH, Li JH, Shao P, Zhou H, Chen YQ, Qu LH. starBase: a database for exploring
microRNA-mRNA interaction maps from Argonaute CLIP-Seq and Degradome-Seq data. Nucleic Acids Res. 2001; 39(Database issue):D202-D209.
22.Hsu SD, Chu CH, Tsou AP, Chen SJ, Chen HC, Hsu PW et al. miRNAMap 2.0: genomic maps of
microRNAs in metazoan genomes. Nucleic Acids Res 2008; 36(Database issue):D165-169.
23.Cho S, Jun Y, Lee S, Choi HS, Jung S, Jang Y et al.miRGator v2.0: an integrated system for
functional investigation of microRNAs. Nucleic Acids Res. 2001; 39(Database issue):D158-D162.
24.Bu D, Yu K, Sun S, Xie C, Skogerbø G, Miao R et al. NONCODE v3.0: integrative annotation of
long noncoding RNAs.Nucleic Acids Res. 2012 Jan;40(Database issue):D210-5.
25.Amaral PP, Clark MB, Gascoigne DK, Dinger ME, Mattick JS. lncRNAdb: a reference database
for long noncoding RNAs. Nucleic Acids Res. 2011; 39(Database issue):D146-D151.
26.Dinger ME, Pang KC, Mercer TR, Crowe ML, Grimmond SM, Mattick JS. NRED: a database of
long noncoding RNA expression. Nucleic Acids Res 2009; 37(Database issue):D122-126.
27.Bisognin A, Sales G, Coppe A, Bortoluzzi S, Romualdi C. MAGIA2: from miRNA and genes
expression data integrative analysis to microRNA-transcription factor mixed regulatory circuits (2012 update). Nucleic Acids Res. 2012; 40(Web Server issue):W13-21.
28.Mack S.G. MicroRNA gets down to business. Nature Biotechnology 2007 ; 25: 631 - 638.
29.Barreau C, Paillard L, Osborne HB. AU-rich elements and associated factors: are there unifying
principles? Nucleic Acids Res 2005; 33(22):7138-7150.
30.Wang J, Pantopoulos K. Regulation of cellular iron metabolism. Biochem J 2011; 434(3):365-81.
31.Jacobs GH, Chen A, Stevens SG, Stockwell PA, Black MA, Tate WP et al. Transterm: a database
to aid the analysis of regulatory sequences in mRNAs. Nucleic Acids Res 2009; 37(Database issue):D72-76.
32.Pickeringa M.B, Willisb A.E. The implications of structured 5' untranslated regions on
translation and disease. Semin.Cell.Dev. Biol. 2005; 16:39-47.
33.Grillo G, Turi A, Licciulli F, Mignone F, Liuni S, Banfi S et al. UTRdb and UTRsite (RELEASE 2010):
a collection of sequences and regulatory motifs of the untranslated regions of eukaryotic mRNAs. Nucleic Acids Res 2010; 38(Database issue):D75-80.
34.Dassi E, Malossini A, Re A, Mazza T, Tebaldi T, Caputi L et al. AURA: Atlas of UTR Regulatory
36
35.Cook KB, Kazan H, Zuberi K, Morris Q, Hughes TR. RBPDB: a database of RNA-binding
specificities. Nucleic Acids Res. 2011; 39(suppl 1):D301-D308.
36.Anders G, Mackowiak SD, Jens M, Maaskola J, Kuntzagk A, Rajewsky N et al. doRiNA: a
database of RNA interactions in post-transcriptional regulation. Nucleic Acids Res 2011; doi:10.1093/nar/gkr1007.
37.Bakheet T, Williams BR, Khabar KS. ARED 3.0: the large and diverse AU-rich transcriptome.
Nucleic Acids Res 2006; 34(Database issue):D111-114.
38.Gruber AR, Fallmann J, Kratochvill F, Kovarik P, Hofacker IL. AREsite: a database for the
comprehensive investigation of AU-rich elements. Nucleic Acids Res. 2001; 39(Database issue):D66-D69.
39.Mokrej M, Masek T, Vopálensky V, Hlubucek P, Delbos P, Pospisek M. IRESite – a tool for the
examination of viral and cellular internal ribosome entry sites. Nucleic Acids Res 2010; 38(Database issue):D131-D136.
40.Castellano S, Gladyshev VN, Guigó R, Berry MJ . SelenoDB 1.0: a database of selenoprotein
genes, proteins and SECIS elements. Nucleic Acids Res 2008;36(Database issue):D332-D338.
41.Andken BB, Lim I, Benson G, Vincent JJ, Ferenc MT, Heinrich B et al. 3’-UTR SIRF: A database
for identifying clusters of short interspersed repeats in 3’untranslated regions. BMC Bioinformatics 2007; 8:274
42.Gardner PP, Daub J, Tate J, Moore BL, Osuch IH, Griffiths-Jones S et al. Rfam: Wikipedia, clans
and the decimal release. Nucleic Acids Res. 2011; 39(Database issue):D141-D145.
43.Siepel A, Bejerano G, Pedersen JS, Hinrichs AS, Hou M, Rosenbloom K, Clawson H, Spieth J,
Hillier LW, Richards S et al. (2005) Evolutionarily conserved elements in vertebrate, insect, worm, and yeast genomes. Genome Res., 15(8), 1034-50.
44.Stark, A. et al. (2007) Discovery of functional elements in 12 Drosophila genomes using
evolutionary signatures.Nature, 450(7167),219-232.
45.Marzluff WF, Wagner EJ, Duronio RJ.(2008) Metabolism and regulation of canonical histone
mRNAs: life without a poly(A) tail. Nat Rev Genet., 9(11), 843-54.
46.Pavesi, G. et al. (2006) MoD Tools: regulatory motif discovery in nucleotide sequences from
co-regulated or homologous genes.Nucleic Acids Res., 34(Web Server issue), W566-570.
47.Lorenz R, Bernhart SH, Hoener Zu Siederdissen C, Tafer H, Flamm C, Stadler PF, Hofacker IL.
(2011) ViennaRNA Package 2.0. Algorithms Mol Biol., 6(1), 26.
48.Höchsmann M, Töller T, Giegerich R, Kurtz S. (2003) Local similarity in RNA secondary
structures. Proc IEEE Comput Soc Bioinform Conf, 2, 159-68.
49.Lebedeva, S., et al.(2011) Transcriptome-wide Analysis of Regulatory Interactions of the
RNA-binding protein HuR. Molecular Cell, 43, doi:10.1016/j.molcel.2011.06.008.
50.Huang DW, Sherman BT, Lempicki RA. Systematic and integrative analysis of large gene lists
using DAVID bioinformatics resources. Nat Protoc 2009; 4(1):44-57.
51.Smoot ME, Ono K, Ruscheinski J, Wang PL, Ideker T. Cytoscape 2.8: new features for data
37
5. PAPERS
->
Dassi E, Malossini A, Re A, Mazza T, Tebaldi T, Caputi L et al. AURA: Atlas of UTR RegulatoryActivity. Bioinformatics 2011; doi: 10.1093/bioinformatics/btr608
->
Dassi E, Zuccotti P, Leo S, Provenzani A, Riva P, Quattrone A. Hyper conserved elements in 3’UTRsreveal a translational network of RNA binding proteins controlled by HuR. [Submitted to Nucleic
Acids Research]
->
Dassi E and Quattrone A. Tuning the engine: an introduction to resources on post-transcriptional[16:33 8/12/2011 Bioinformatics-btr608.tex] Page: 142 142–144
BIOINFORMATICS
APPLICATIONS NOTE
Vol. 28 no. 1 2012, pages 142–144doi:10.1093/bioinformatics/btr608Databases and ontologies Advance Access publication November 4, 2011
AURA: Atlas of UTR Regulatory Activity
E. Dassi∗,†, A. Malossini†, A. Re†, T. Mazza, T. Tebaldi, L. Caputi and A. Quattrone
Laboratory of Translational Genomics - Centre for Integrative Biology, University of Trento, Via delle Regole, 101, 38123 Mattarello (TN), Italy
Associate Editor: Mario Albrecht
ABSTRACT
Summary:The Atlas of UTR Regulatory Activity (AURA) is a manually curated and comprehensive catalog of human mRNA untranslated regions (UTRs) and UTR regulatory annotations. Through its intuitive web interface, it provides full access to a wealth of information on UTRs that integrates phylogenetic conservation, RNA sequence and structure data, single nucleotide variation, gene expression and gene functional descriptions from literature and specialized databases.
Availability: http://aura.science.unitn.it
Contact:aura@science.unitn.it; dassi@science.unitn
Supplementary information: Supplementary data are available at
Bioinformaticsonline.
Received on May 11, 2011; revised on October 27, 2011; accepted on October 28, 2011
1 INTRODUCTION
The 5and 3 untranslated regions(UTRs) are the portions of an mRNA located at each side of the coding sequence. UTRs contain information for post-transcriptional regulation of mRNA, including transport, stability, localization and access to translation, and hence they largely determine the fate of mature mRNAs in the cell (Keene, 2007). Such events are mediated by hundreds oftrans-acting factors: primarily RNA binding proteins (RBPs), associated with all cellular mRNAs to form ribonucleoprotein complexes (RNPs), but also non-coding RNAs, of which the microRNA (miRNA) class has a clear functional role.
The experimentally determined sequence and structure binding constraints of UTRs vary widely between and within RBPs and non-coding RNAs, and the regulatory interactions are globally characterized by extreme complexity, since a regulator can bind to multiple UTRs in multiple sites and vice versa. Moreover, the mRNA
trans–cisinteraction network undergoes remarkable plasticity, since the fate of an mRNA is determined by its temporally and spatially dependent association to several regulators (Andersonet al., 2009). Unraveling the molecular code behind this sophisticated process is the key for: (i) understanding to what extent cell programs are regulated by the degree of mRNA abundance, localization and translation; (ii) deciphering how malfunction oftrans-acting factors or mutation of target sites is at the root of some severely altered cellular phenotypes; (iii) identifying novel therapeutics aimed at modulating mRNA dynamics in the window between transport and translation. With this aim, a growing number of
∗To whom correspondence should be addressed.
†The authors wish it to be known that, in their opinion, the first three authors
should be regarded as joint First Authors.
studies, both mechanistic and systems-based, provide information on factors binding to UTRs. Nevertheless, integration of these data and annotation of UTRs in genome browsers are lacking or insufficient. TheAtlas of UTR Regulatory Activity(AURA) fills this gap with unprecedented richness and coverage, by collecting and combining human UTR annotation and binding data from several sources.
2 DESCRIPTION AND USAGE
The increasing centrality of post-transcriptional regulation among gene expression studies is witnessed by the recent release of several specialized databases. RBPDB focuses on trans-acting proteins by collecting semi-manually curated literature data about RBPs and their demonstrated or predicted binding motifs (Cook
et al., 2011); Transterm is a regulatory sequence database that aggregates heterogeneous lists of cis-acting motifs relevant for post-transcriptional regulation (Jacobset al., 2009); starBase and CLIPZ store primary data oftrans–cisinteractions obtained by next-generation high-throughput technologies (Khorshid et al., 2011). In addition, more specialized resources allow the user to search and analyze a limited number of particularly well-known regulatory elements in greater detail (e.g. AREsite, Gruberet al., 2010, UTRdb and UTRsite, Grilloet al., 2010).
Unlike these catalogs, AURA is designed to be a comprehensive and centralized warehouse of human UTR mapped annotations, both in terms of regulatory macromolecules and their site of binding. AURA records non-redundant, direct and experimentally assessed interactions of RNA binding proteins and microRNAs with human UTRs. It contains an updated set of annotated human UTRs (except those <5 bases) from the UCSC Genome Browser (GRCh37/hg19 assembly), experimental literature data (1041 publications) and consolidated information from several specialized databases, including miRTarBase (Hsu et al., 2011), miRecords (Xiao et al., 2009) and the aforementioned AREsite and RBPDB resources. Currently, it covers 127 523 human UTRs, corresponding to 63 138 transcripts encoded by 19 364 protein coding genes. An extensive comparison between AURA and related resources can be found in File S2 in Supplementary Material.
AURA is developed according to the convention that an RBP is a protein showing a reviewed RNA binding domain, and according to the rule that whenever positional data on mRNA regulatory binding sites are made available, the coordinates of each binding site are evaluated against the current genome annotation to verify the site lies within or overlaps the spliced UTR of a transcript.
The current AURA release provides a checked evidence of 299 393 interactions between 100 RBPs and 33 836 UTRs, of 28 351 interactions between 303 miRNAs and 5885 UTRs and collectively
142 © The Author 2011. Published by Oxford University Press. All rights reserved. For Permissions, please email: journals.permissions@oup.com
at Universita degli Studi di Trento on June 28, 2012
http://bioinformatics.oxfordjournals.org/
[16:33 8/12/2011 Bioinformatics-btr608.tex] Page: 143 142–144
AURA
of 56 910cis-sites over 11 559 UTRs. Additional major attributes enabling the characterization and/or assessment of the interactions between UTRs andtrans-acting factors include synteny information and joint visualization of gene expression profiles for the interacting partners. Furthermore, the assessment of an interaction between an RBP and an UTR is improved by the cross-reference to the Protein Human Atlas database (Berglundet al., 2008). A high-level schema of the database can be found in Supplementary Figure S1.
2.1 Search
To account for the observation that a transcript can interact with multiple RBPs as well as an RBP can interact with multiple transcripts, AURA exhibits an intuitive interface through which the user can query a ‘target locus’ or a ‘trans factor’, respectively. The former query returns a list of genes whose HGNC gene symbol or synonyms contain the searched term; each gene in the list is annotated with its functional description, synonyms and UTRs. Furthermore, an exon–intron map of the UTRs is provided in order to allow proper discrimination between the different transcripts of a gene. On the other hand, the latter query results in a disambiguation list where all thetrans-factors, whose names or synonyms contain the searching term, are shown. To select thetrans-factor of interest, the user might benefit from genes’ short descriptions and functional summaries. Upon selection, AURA returns the list of its target UTRs. These UTRs can be grouped by gene ontology (GO) slim categories (http://www.geneontology.org/GO.slims.shtml) or by chromosome mapping. Furthermore, the user can filter the results by selecting a combination of supporting experimental evidences.
2.2 UTR view
Selected UTRs are shown in an ‘UTR view’, consisting of two standard elements:
• The textual header containing: the chromosomal position and length of the spliced UTR, the HGNC name and UniProt description of the gene the UTR belongs to, and the link to the HPA database. Also shown are the overall conservation, which is the mean PhastCons single nucleotide conservation score for the UTR (Fujitaet al., 2011), and the corresponding transcript half-life according to a transcriptome-wide stability measurement (Friedelet al., 2009).
• The AURA sequence browser, based on the JBrowse architecture (Skinneret al., 2009), contains all the annotations related to a specific UTR, i.e. multiple tracks annotating the UTR by evolutionary conservation, single nucleotide variation and cis-regulatory binding sites. The ‘Conservation’ track displays the score calculated for each nucleotide in the UCSC 46 species alignment (Fujitaet al., 2011). In the ‘SNP’ track, AURA integrates the single nucleotide polymorphisms (SNPs) recorded in the dbSNP database (Sherryet al., 2001), allowing the user to combine with the other annotation tracks to look for variations of potential impact in post-transcriptional regulation. The ‘RBP’ track contains the RBP binding sites, whereas the ‘miR’ track contains the microRNAs binding sites. Two further tracks are provided to show thetrans-factors for which only partial information is available. The ‘unknown mRNA location’ track denotes the trans-factors known to bind a transcript without any further mapping information. Instead,
the ‘unknown UTR location’ track indicates thetrans-factors whose UTR binding site is unknown. All the annotations in the tracks are clickable: whenever the user clicks on an annotation, a description page containing binding sites and cross-references is shown. In this view, the minimal energy predicted secondary structure (Fujita et al., 2011) together with the color-coded nucleotide phylogenetic conservation, SNP locations andtrans -factor binding sites of the selected UTR can be optionally drawn through VARNA (Dartyet al., 2009).
Furthermore, AURA provides the user with multiple ways of grouping gene expression results retrieved from the Gene Expression Atlas (http://www.ebi.ac.uk/gxa/) and related to the gene locus of the selected UTR. Results are reported in tables where a row corresponds to a condition, whereas the columns, in order, show the number of times the gene was observed to be up- or downregulated with respect to its mean expression value and the significance of the measure (log10P-values). In case oftrans-factor search, a joint table containing gene expression experiments for both the gene coding for the trans-factor and the gene bearing the bound UTR is shown. Moreover, significant differences in common between regulator and target are highlighted to emphasize possible correlations or anti-correlations between them. Annotations concerning an UTR can be extracted in textual format through the UTRCard feature; furthermore, the whole MySQL database can be downloaded from a dedicated page. A last way of mining the data contained in AURA is through the AURA Mart, which is available at the website and provides all query functionalities offered by the well-known BioMart platform (http://www.biomart.org).
3 FUTURE DEVELOPMENT
AURA gathers data by aggregation, integration and summarization of knowledge from scientific literature and specialized databases. Future developments include (i) the integration of the UTR mapping catalog according to RNA-Seq data; (ii) the enrichment of thetrans -factor catalog with long non-coding RNAs; (iii) the expansion of the UTR regulatory annotations to include internal ribosomal entry sites and upstream open reading frame (ORFs); (iv) the inclusion of annotations coming from genome-wide RNAi-based gene silencing phenotypic screens; and (v) the improvement of the search engine as well as of the visualization and retrieval systems.
Funding: This work is supported by the University and Scientific Research Services of the Autonomous Province of Trento.
Conflict of Interest: none declared.
REFERENCES
Anderson,P.et al. (2009) RNA granules: post-transcriptional and epigenetic modulators of gene expression.Nat. Rev. Mol. Cell Biol.,10, 430–436.
Berglund,L.et al. (2008) A gene-centric human protein atlas for expression profiles based on antibodies.Mol. Cell Proteomics,10, 2019–2027.
Cook,K.B.et al. (2011) RBPDB: a database of RNA-binding specificities.Nucleic Acids Res.,39(Suppl. 1), D301–D308.
Darty,K.et al. (2009) VARNA: interactive drawing and editing of the RNA secondary structure.Bioinformatics,25, 1974–1975.
Friedel,C.C.et al. (2009) Conserved principles of mammalian transcriptional regulation revealed by RNA half-life.Nucleic Acids Res.,37, e115.
Fujita,P.A.et al. (2011) The UCSC Genome Browser database: update 2011.Nucleic Acids Res.,39(Suppl. 1), D876–D882.
143
at Universita degli Studi di Trento on June 28, 2012
http://bioinformatics.oxford
![Figure 3: IRE-mediated translation inhibition. Binding to the IRE in the transcript 5’UTR, IRP1 and IRP2 proteins prevents translation pre-initiation complex formation[32]](https://thumb-us.123doks.com/thumbv2/123dok_us/612079.2061197/7.612.56.557.372.599/mediated-translation-inhibition-transcript-prevents-translation-initiation-formation.webp)