M E T A G E N O M E R E P O R T
Open Access
Metagenomic analysis of planktonic
microbial consortia from a non-tidal
urban-impacted segment of James River
Bonnie L. Brown
1*, Rebecca V. LePrell
2, Rima B. Franklin
1, Maria C. Rivera
1, Francine M. Cabral
3, Hugh L. Eaves
4,
Vicki Gardiakos
5, Kevin P. Keegan
6and Timothy L. King
7Abstract
Knowledge of the diversity and ecological function of the microbial consortia of James River in Virginia, USA, is essential to developing a more complete understanding of the ecology of this model river system.
Metagenomic analysis of James River's planktonic microbial community was performed for the first time using an unamplified genomic library and a 16S rDNA amplicon library prepared and sequenced by Ion PGM and MiSeq, respectively. From the 0.46-Gb WGS library (GenBank:SRR1146621; MG-RAST:4532156.3), 4 × 10⁶ reads revealed >3 × 10⁶ genes, 240 families of prokaryotes, and 155 families of eukaryotes. From the 0.68-Gb 16S library (GenBank:SRR2124995; MG-RAST:4631271.3; EMB:2184), 4 × 10⁶ reads revealed 259 families of eubacteria. Results of the WGS and 16S analyses were highly consistent and indicated that more than half of the bacterial sequences were Proteobacteria, predominantly Comamonadaceae. The most numerous genera in this group were Acidovorax (including iron oxidizers, nitrotolulene degraders, and plant pathogens), which accounted for 10 % of assigned bacterial reads. Polaromonas were another 6 % of all bacterial reads, with many assignments to groups capable of degrading polycyclic aromatic hydrocarbons. Albidiferax (iron reducers) and Variovorax (biodegraders of a variety of natural biogenic compounds as well as anthropogenic contaminants such as polycyclic aromatic hydrocarbons and endocrine disruptors) each accounted for an additional 3 % of bacterial reads. Comparison of these data to other publically-available aquatic metagenomes revealed that this stretch of James River is highly similar to the upper Mississippi River, and that these river systems are more similar to aquaculture and sludge ecosystems than they are to lakes or to a pristine section of the upper Amazon River. Taken together, these analyses exposed previously unknown aspects of microbial biodiversity, documented the ecological responses of microbes to urban effects, and revealed the noteworthy presence of 22 human-pathogenic bacterial genera (e.g., Enterobacteriaceae, pathogenic Pseudomonadaceae, and ‘Vibrionales') and 6 pathogenic eukaryotic genera (e.g., Trypanosomatidae and Vahlkampfiidae). This information about pathogen diversity may be used to promote human epidemiological studies, enhance existing water quality monitoring efforts, and increase awareness of the possible health risks associated with recreational use of James River.
Keywords: James River, Virginia, Temperate urban river ecosystem, Industry, Pathogen, Water-borne disease
* Correspondence:[email protected] 1
Department of Biology, Virginia Commonwealth University, 1000 W Cary Street, Richmond, VA 23284, USA
Full list of author information is available at the end of the article
Introduction
James River is an historical, cultural, and economic icon in North America [1] and one of the largest tributaries of the Chesapeake Bay. The James River ecosystem once provided provisioning services and transport for First Americans and European colonists, and the river has more recently been characterized as the economic engine of Virginia because it supports multiple eco-nomic services such as industry, commerce, and recre-ation. The James River watershed is home to more than 25 million Virginians, and its land use is: 71 % forested, 16 % agricultural, 5 % urban, and 8 % other [2]. In the watershed, there are >1500 point sources permitted to discharge pollutants from municipal and industrial out-falls, CSOs, and aging/failing sewage treatment facilities (data obtained from Virginia Department of Environ-mental Quality via Freedom of Information Act). The river also receives nonpoint source pollutants that derive from urban, agricultural, wildlife, and transportation runoff. Contaminants include sediment, nutrients (espe-cially nitrogen and phosphorus), PBTs, and non-PBTs [3], as well as pathogens capable of causing illnesses and WBDOs. In fact, in the United States, WBDOs are in-creasing exponentially [4], and the potential for disease transmission is especially high in the James because its beaches and waters are heavily accessed for recreation (swimming, kayaking, river-boarding) and education (especially summer camps for children). Though there are methods available to assess the abundance of some of the more common disease-causing agents, each pathogen must be examined separately, and there are few methods available that consider the risk of multiple pathogens simultaneously. High-throughput sequencing is a cultivation-independent method that provides infor-mation about epidemiologically-relevant organisms that could enhance efforts to prevent, control, and better predict WBDOs thereby improving public health [5]. Current recreational water monitoring practices (e.g., E coli and coliform testing) serve only as coarse indictors of potential contamination, and provide little informa-tion on the diversity, source, ecology, or evoluinforma-tion of or-ganisms that cause WBDOs. Metagenomic methods used in the nascent field of public health genomics could help address such questions, but studies thus far have focused narrowly on oral, nasal, gastric, and vaginal
microbiota and their role in human health. On a few occasions, metagenomic techniques have been used to detect the occurrence of specific pathogens in the en-vironment, such as coliforms, Mycobacterium tubercu-losis, Salmonella enterica subsp. enterica, and Vibrio cholerae [6–9]; however, such approaches are tedious, expensive, or simply impractical for use in routine monitoring programs, and thus this sort of assess-ment has not found wide application at the larger ecogenomic scale. This report is the first installment of the James River Metagenome Project.
Site information
The segment of James River near downtown Richmond, Virginia (USA) is non-tidal within the fall zone (Piedmont Upland transitioning to the Atlantic Coastal Plain, Table 1). This site has both recreational and monitoring relevance. This location occurs in a highly-urbanized area, where storm water runoff carries pollutants such as oil, sedi-ment, chemicals, heavy metals, pet waste, and lawn fertil-izers directly to the river. James River traverses more than 700 km2 of impervious surface between Lynchburg and Richmond. Along this distance, construction sites, power plants, failing sewer systems, and industrial activities contribute substantial amounts of contaminants. Further, this sampling location is impacted by activities in the entire watershed upstream, especially the large cities of Charlottesville and Lynchburg. For example, between Richmond and Lynchburg, there are 170 active industrial discharge sites and 92 sources permitted to discharge dir-ectly into James River without pre-treatment. The sam-pled portion of James River is proximal to numerous highly trafficked bridges and downstream of a large urban park with abundant riparian and aquatic wildlife (e.g., tur-tles, ducks, geese, heron, amphibians, and reptiles). The city of Richmond has one of the largest CSO systems on the East Coast, and our sampling station is affected by dis-charge from 19 CSOs within 10 km . This segment of the river has been included in the state’s Impaired Waters List for fecal coliforms for over a decade and, although the government regulates only certain bacterial TMDLs, there is sufficient evidence to assume that the water is impaired with regard to other pollutants according to the Clean Water Act [10]. The Virginia Department of Health also
Table 1Study information
Label JREM1 Riffles_WGS JREM1 Riffles_16S
MG-RAST ID 4532156.3 4631271.3
SRA ID SRR1146621 SRR2124995
Study Name James River Epidemiological Metagenome James River Epidemiological Metagenome
NCBI BioProject PRJNA236764 PRJNA236764
has a long-standing fish consumption advisory for this section of the river due to elevated levels of PCBs.
Metagenome sequencing information
Metagenome project history
We characterized a metagenome from the non-tidal James River near Richmond, Virginia. This stand-alone river study was conceived to investigate the potential of environmental metagenomic analysis in public health, and began with a sample collected in September 2012, the analysis of which is presented in this report. We used MG-RAST [11], MEGAN [12], and RDP [13] to categorize the sequence data and to identify taxa that contribute to the ecology of this river ecosystem so as to better understand how the microbial consortia respond to urbanization, pollution, and other anthropogenic in-fluences. The data are accessed in NCBI and MG-RAST (Table 1).
Sample information
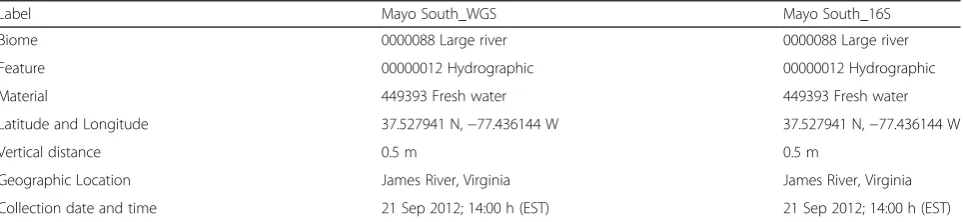
James River sampling took place on 21 September 2012 during an historically typical late summer month when neither drought nor excessive precipitation events oc-curred within the two weeks preceding sample collec-tion. This minimized potential effects of severe weather and CSO inputs. At the time of collection, the physico-chemical parameters of the water column were: 21.9 °C, 79 mg L−1dissolved oxygen, 8.4 pH, 86 m3s−1discharge, 9.7 FNU turbidity, 250 CFU 100 mL−1 fecal coliform, and 175 CFU 100 mL−1 E. coli. These parameters, al-though not pristine, indicate that the water was unim-paired at the time of sample collection according to the Clean Water Act [10] and state water quality standards.
Sample preparation
Water (20 L) was collected by wading to mid-stream, waiting until disturbed sediment had dissipated, and then inserting a clean collection vessel to mid-water (0.5 m below the water surface), tipping to collect, and capping underwater. The water was held at ambient temperature during transport to the laboratory (~10 min) for immediate processing (Table 2). After
mixing, a 3-L subsample was gently filtered through
0.2-μm Sterivex™ filters (Millipore, Billerica, MA) using a combination of gravity and vacuum (200–300 mm Hg). It is possible that this pressure may have disrupted some soft-bodied protists, limiting our ability to detect this group. Free viruses and some eDNA also are likely to have passed through the 0.2-μm filter.
DNA extraction
DNA was isolated using the Sterivex™ PowerWater™ DNA extraction (MO BIO, Carlsbad, CA) within 2 h of collection according to the manufacturer’s instructions, a procedure that included enzymes, heat, and bead beat-ing to ensure nucleic acid release from endospore-forming and Gram negative bacteria. Nucleic acid qual-ity was checked via Experion™DNA 12 K Analysis kit.
Library generation
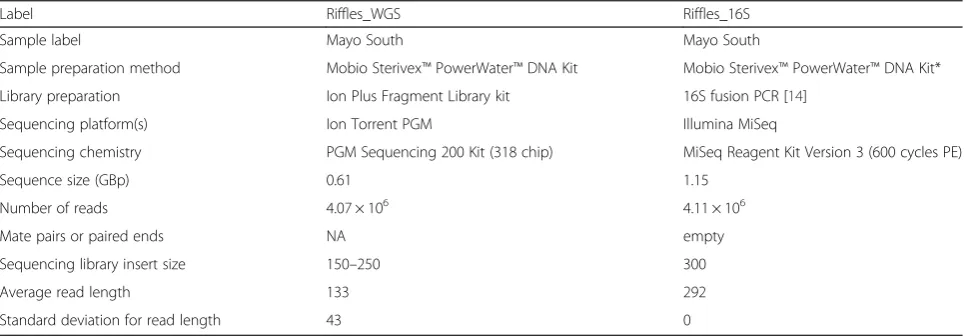
Nucleic acid quantity was verified using the Quant-iT DNA kit (Life Technologies, Grand Island, NY), and ad-justed to 50 ng μL−1 prior to WGS library preparation using the Ion Plus Fragment Library kit (Life Technolo-gies, Grand Island, NY). To alternatively assess taxo-nomic diversity of the microbial community, a library was made that targeted the bacterial 16S rRNA gene; four replicate fusion PCR libraries targeting 16S [14] were performed using the same DNA sample as the shotgun metagenome. The amplicons were quantified using Bioanalyzer and pooled in equimolar amounts prior to sequencing.
Sequencing technology
Sequencing of the WGS library was accomplished using the Ion Torrent PGM semiconductor sequencing plat-form (Life Technologies, Grand Island, NY), the Ion PGM™ 200 Sequencing Kit, and one 318 chip. The run generated 0.61Gb data (Table 3). The 16S targeted library generated 1.15Gb data from one 1 × 300 bp lane on MiSeq (Illumina, San Diego, CA).
Table 2Sample information
Label Mayo South_WGS Mayo South_16S
Biome 0000088 Large river 0000088 Large river
Feature 00000012 Hydrographic 00000012 Hydrographic
Material 449393 Fresh water 449393 Fresh water
Latitude and Longitude 37.527941 N,−77.436144 W 37.527941 N,−77.436144 W
Vertical distance 0.5 m 0.5 m
Geographic Location James River, Virginia James River, Virginia
Sequence processing
Quality control for the WGS run was performed on the MG-RAST server, and filtering for 16S amplicons was accomplished in BaseSpace (quality scores ≥30). After quality control filtering, the James River WGS metagen-ome consisted of 3.4 × 10⁶ reads with an average length of 133 ± 43 bp (Table 2) and the 16S rDNA amplicon library consisted of 3.9 × 10⁶ reads with an average length of 292 ± 0 bp (Table 4).
Metagenome processing
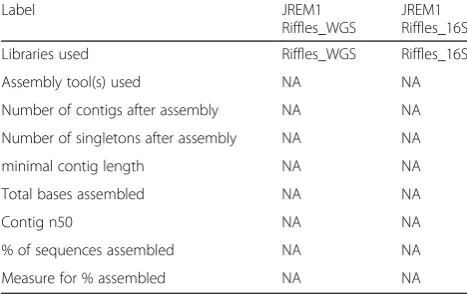
No assembly was performed for either data set (Table 5).
Metagenome annotation
Shotgun sequence data were analyzed using bioinfor-matic tools on the MG-RAST server to predict rDNA, gene, and protein functions. The MG-RAST analysis was performed using the BLAT annotation algorithm [15] against the M5NR protein Db using default parameters. Targeted 16S rDNA amplicon sequences of at least 100 bp were analyzed using the Illumina 16S Metage-nomics App (v1.0.0) for taxonomic classification using an Illumina-curated version of the May 2013 Green-Genes taxonomic Db and default settings (Table 6).
Postprocessing
Whole-genome shotgun sequence data were compiled and assessed using three methods (MG-RAST, MEGAN, and crAss [16]). Bar charts of normalized counts of the highest representative taxa were constructed using the MG-RAST output with an e-value cutoff of 1e-5, 60 % identity, and a minimum alignment length of 30. Com-parative metagenomic similarity was quantified between the James River and 17 other putatively similar, publicly available MG-RAST metagenomic read sets (4532156.3, 4440411.3, 4440413.3, 4440423.3, 4441132.3, 4441590.3, 4442450.3, 4467029.3, 4467420.3, 4467059.3, 4494863.3,
4516288.3, 4534334.3, 4534338.3) using principal coordi-nates analysis (M5NR Db, e-value cutoff −5, 60 % iden-tity, data normalized using the MG-RAST default normalization procedure, minimum alignment length of 15 bp). Functional aspects of the James River WGS metagenome were compared with 13 other aquatic metagenomes on MG-RAST (2 large river samples, 4 lakes, 3 aquaculture, 2 sludge, and 2 Chesapeake Bay) using principal coordinates analysis (Subsystems Level 1, e-value cutoff 1e-5, 60 % identity, data normalized using the default normalization procedure and a minimum alignment length of 15 amino acids) and KeggMapper (e-value cutoff 1e-5, 60 % identity, minimum alignment length of 15 amino acids). Prior to a local BlastN, WGS reads <50 bp were removed and quality trimmed to≥ Phred 20 using Genomics Workbench (CLCbio, Cambridge, MA). BlastN was performed locally using the quality- and size-filtered shotgun genomic data against the NCBI-nt reference Db using the default con-ditions of megablast. The resulting Blast report was then parsed and analyzed using MEGAN (ver 4.70.4) yielding a taxonomic“species profile.” To compare genetic simi-larity of the James River WGS metagenome with other aquatic WGS metagenomes, including those that were not available through MG-RAST (SRA001012, SRR091234, SRR063691), the algorithm crAss [16] was used to estimate genetic distances based on the characteristics of“ cross-con-tigs” obtained by cross-assembly of all sets of reads using Genomics Workbench with the following parameters: mismatch 3, insertion 3, deletion 3, length fraction of 50 %, and similarity fraction of 90 %.
Metagenome properties
Unlike some other WGS metagenomes that exhibit bimodal GC distribution [17–20], this James River meta-genome exhibited a unimodal peak (WGS: 49 ± 9 % and 16S: 51 ± 2 %), well within the range observed and
Table 3Library information
Label Riffles_WGS Riffles_16S
Sample label Mayo South Mayo South
Sample preparation method Mobio Sterivex™PowerWater™DNA Kit Mobio Sterivex™PowerWater™DNA Kit*
Library preparation Ion Plus Fragment Library kit 16S fusion PCR [14]
Sequencing platform(s) Ion Torrent PGM Illumina MiSeq
Sequencing chemistry PGM Sequencing 200 Kit (318 chip) MiSeq Reagent Kit Version 3 (600 cycles PE)
Sequence size (GBp) 0.61 1.15
Number of reads 4.07 × 10⁶ 4.11 × 10⁶
Mate pairs or paired ends NA empty
Sequencing library insert size 150–250 300
Average read length 133 292
Standard deviation for read length 43 0
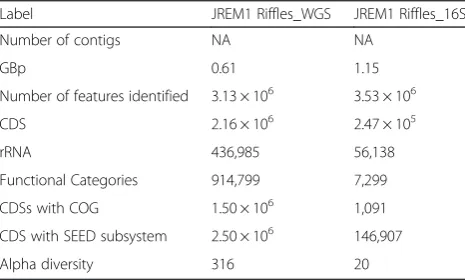
suggested as a freshwater hallmark (46–65 % [18]). The targeted 16S metagenome provided roughly the same number of reads as the WGS analysis and an order of magnitude lower numbers of CDSs and functional assignments (Table 7).
Taxonomic diversity
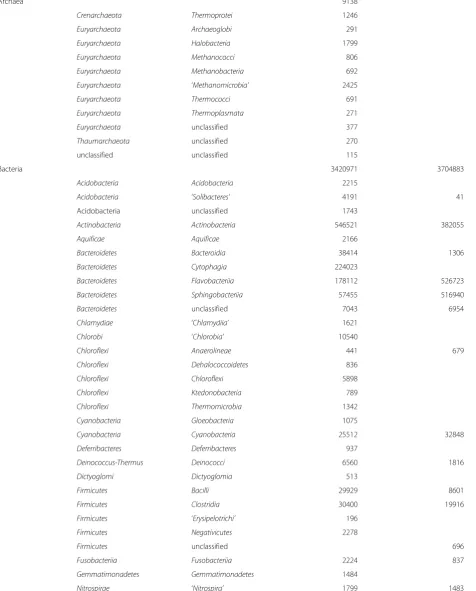
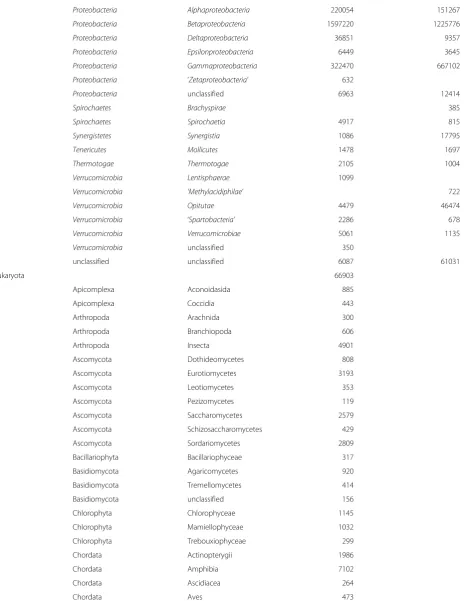
Reads resulting from James River WGS were over-whelmingly assigned to the Bacteria domain (97.5 % by MG-RAST, 97.7 % by Blast), Eukaryota accounted for 2 % of assignments (MG-RAST and Blast), and the remaining assignable reads wereArchaea(0.3 % by MG-RAST, 0.1 % by Blast) and virus or plasmid (0.2 % by MG-RAST, 0.07 % by Blast). Reads resulting from the 16S library were bacterial (95.5 %) and viral (4.5 %, a se-quencing control contaminant [21]). Taxonomy based on predicted proteins and rRNA genes (MG-RAST) gen-erally mirrored the major taxa predicted by BlastN (MEGAN). The taxonomic profiles of the major bacterial groups based on WGS reads and 16S reads (Table 8) were largely concurrent, consistent with other research where WGS and 16S data were compared [17, 22]. The major differences between the WGS and 16S rDNA amplicon-based taxonomic profiles assigned to Class were Cytophagia (7.3 % in the WGS library and not detected in the 16S library), Chlorobia (0.2 % in the WGS library and not detected in the 16S library), and
Synergistia(0 % of WGS and 0.5 % of 16S reads). Our analysis detected groups of bacteria that in part matched what we expected based on an understanding of river ecology, and classifications to family conformed
closely to the core groups detected in other freshwater aquatic systems [22–25]. The analysis also implicated additional industrially- and epidemiologically-relevant groups that likely are important in this reach of James River. More than half of the bacterial sequences detected by both the WGS and the 16S methods were Proteobac-teria (Betaproteobacteria) and, within this group, the most abundant taxa were within theComamonadaceae. In the WGS analysis, the most numerous genera in the
ComamonadaceaewereAcidovorax(iron oxidizers, nitro-tolulene degraders, and plant pathogens that accounted for 10 % of WGS assigned bacterial reads and 0.8 % of 16S bacterial reads),Polaromonas(6 % of WGS bacterial reads and < 0.1 % of 16S bacterial reads). ThePolaromonaswere dominated by two groups capable of degrading polycyclic aromatic hydrocarbons, PAHs, previously detected in coal-tar-contaminated freshwater sediments [26]. Other prominent groups in this family identified by WGS were
Albidiferax, which are iron reducers (3 % WGS bacterial reads and 0 % 16S), andVariovorax, which are biodegra-ders of diverse natural biogenic compounds as well as nu-merous anthropogenic contaminants (3 % WGS bacterial reads and 0.6 % of 16S bacteria). The 16S analysis identi-fied additional genera in theComamonadaceaeincluding
Limnohabitans (12 % of 16S bacterial reads), Hydrogeno-phaga(3 % of 16S bacterial reads), andRubrivivax(1 % of 16S bacterial reads), each of which were seen at < 0.01 % of the WGS bacterial data. The next most abundant
Proteobacteria group was the Burkholderiaceae, repre-sented by Polynucleobacter necessarius (5 % of WGS bacterial reads and 2 % of 16S reads), an ubiquitous fresh-water bacterioplankton and protozoan endosymbiont, and byBurkholderia(3 % of WGS bacterial reads and 0.1 % of 16S bacterial reads), a group that contains mammal and plant pathogens and bacterial strains that biodegrade poly-chlorinated biphenyls. Three additional prokaryote groups were represented by read counts in excess of 10 % in ei-ther the WGS or the 16S analysis:Actinobacteria( Actino-mycetales, mostly Streptomycetaceae, Nocardioidaceae,
Micrococcaceae, and Mycobacterium), Gammaproteobac-teria (Chromatiaceae, Enterobacteriaceae, pathogenic
Pseudomonadaceae, andVibrionaceae), and Bacteroidetes
(a number of agriculture-associated species within Cyto-phagaceae,‘Flexibacteraceae’, andFlavobacterium, some of which are common in freshwater lake sediments and other known commensals and opportunistic pathogens of fishes). Alphaproteobacteria (particularly nitrogen fixers) constituted 6 % of WGS bacteria and 3 % of the bac-teria based on 16S analysis. Of the 229 OTUs identi-fied in the 16S data set at the level of ≥0.01 % read abundance, 22 % were bacteria associated with do-mesticated plants and animals, agricultural soils, or had other agricultural relevance. Across the WGS and 16S analyses, the five most common groups observed
Table 5Metagenome statistics
Label JREM1
Riffles_WGS
JREM1 Riffles_16S
Libraries used Riffles_WGS Riffles_16S
Assembly tool(s) used NA NA
Number of contigs after assembly NA NA
Number of singletons after assembly NA NA
minimal contig length NA NA
Total bases assembled NA NA
Contig n50 NA NA
% of sequences assembled NA NA
Measure for % assembled NA NA
Table 4Sequence processing
Label Riffles_WGS Riffles_16S
Tool(s) used for quality control MG-RAST BaseSpace
Number of sequences removed by QC 0.61 × 10⁶ 0.18 × 10⁶
Number of sequences that passed QC 3.45 × 10⁶ 3.93 × 10⁶
in the James River metagenome (Proteobacteria, Bac-teroidetes, Actinobacteria, Cyanobacteria, and Verru-comicrobia) accounted for 98 % of reads, and were among the most common groups observed in Missis-sippi River [22].
Bacterial groups that accounted for≈1 % of assigned reads in either the WGS or the 16S data sets included
Deltaproteobacteria (some of which have recently been identified as pathogens), Curvibacter (1 % of bacterial reads: a symbiont of Hydra which was the most abun-dant of all eukaryote reads), Delftia (non-fermentative, Gram-negative bacteria from soil, activated sludge, crude oil, oil brines, and water [27], and recently observed in association with the use of medically invasive devices such as endotracheal tubes [28] and intravascular-catheters [29]),Comamonas (a soil bacterium utilized to treat the industrial by-product 3-chloroaniline [30]; one strain has been observed to be the cause of bacteremic infections [31]), Alicycliphilus (degrades alicyclic and aromatic hy-drocarbons), and Verminephrobacter (earthworm symbi-onts). Although they accounted for just under 1 % of 16S reads, a diverse suite of Cyanobacteria was represented, predominantly by Synechococcusspecies (39 % of cyano-bacteria) andProchlorococcus(8 % of cyanobacteria), both of which are ecologically significant autotrophic pico-plankton, and roughly even proportions of reads were assigned toAnabaena, Cyanothece, Nostoc, and Synecho-cystis (each ~ 5–7 % of cyanobacteria). Approximately 2– 3 % of cyanobacterial reads were assigned to Acaryo-chloris,Cyanobium,Gloeobacter, Microcoleus, Microcystis, andTrichodesmium.
Eukaryotes accounted for 2 % of the reads with assigned taxonomy in the analysis of the James River WGS metagenome (Table 8). The core taxonomy of eukaryotes was nearly identical to those detected at two selected sites along the Mississippi River in Minnesota [22]. However, the proportion of reads attributed to eukaryotes in James River was considerably higher than the <0.1 % mean abundance of non-bacterial orders in the Mississippi; the increased eukaryote component in James River may be in part a consequence of the longer reads in the James River data set (133 bp vs. 100 bp). The James River WGS metagenome exhibited 155 eukaryote families, each represented in the data by be-tween 5 and 1352 reads. Just over half of the families were common temperate aquatic flora, fauna, or fungi, and the remainder was assigned to terrestrial species (in-cluding those found in agricultural soils) and organisms that cause disease in fishes, humans, or agriculture. Con-sidering those eukaryotic taxa with an abundance≥1000 reads (83 % of eukaryote reads), we detected the following (in order of read abundance): freshwater polyp (17 % of reads), streptophytes (14 % of reads), amphibians (13 % of reads, mostly frog), insects (7 %, mostly culicids, dipterans, and lepidopterans), mammals (7 %, mostly human and mouse), fungi (13 %, several major classes including Saccharomycetes, Sordariomycetes, and Eurotiomycetes), teleost fishes (3 %), green algae (3 %), nematodes (2 %), and ciliate protozoans (2 %). Almost one-quarter of eukaryotic sequences were Chordata, predominantly am-phibian (11 % of eukaryote reads), mammalian (7 % of eukaryote reads), and to a lesser extent fishes (3 %) and birds (0.7 %). Upstream land-based agricultural effects on James River were indicated by sequence matches to castor oil plant, beet, sorghum, rice, maize, bovine, equine, por-cine, and galliform species. Additional taxonomic groups detected at a read cutoff of ≥100 included angiosperms, mosquitos, nematodes, and primates (human and New World monkeys). The signal for monkeys most likely derives from an exotic animal rearing and testing facility located in nearby Cumberland County. The facility raises grivet and macaque monkeys and holds a permit (as of May 2014) to discharge up to 76 × 103L day−1of indus-trial pollution directly into James River 70 km upstream of Richmond (op cit. data request). Similarly, there are sev-eral aquaculture facilities with discharge permits (as of May 2014, op cit. data request) between Richmond and
Table 7Metagenome properties
Label JREM1 Riffles_WGS JREM1 Riffles_16S
Number of contigs NA NA
GBp 0.61 1.15
Number of features identified 3.13 × 10⁶ 3.53 × 10⁶
CDS 2.16 × 10⁶ 2.47 × 10⁵
rRNA 436,985 56,138
Functional Categories 914,799 7,299
CDSs with COG 1.50 × 10⁶ 1,091
CDS with SEED subsystem 2.50 × 10⁶ 146,907
Alpha diversity 316 20
Table 6Annotation parameters
Label JREM1 Riffles_WGS JREM1 Riffles_16S
Annotation system MG-RAST BaseSpace 16S Metagenomics App (V1.0.0)
Gene calling program Default (FragGeneScan) Illumina implementation of RDP
Annotation algorithm Default (BLAT) NA
Table 8Taxonomic composition of the sample
Domain Phylum Class* JREM1 Riffles_WGS JREM1 Riffles_16S
Archaea 9138
Crenarchaeota Thermoprotei 1246
Euryarchaeota Archaeoglobi 291
Euryarchaeota Halobacteria 1799
Euryarchaeota Methanococci 806
Euryarchaeota Methanobacteria 692
Euryarchaeota ‘Methanomicrobia’ 2425
Euryarchaeota Thermococci 691
Euryarchaeota Thermoplasmata 271
Euryarchaeota unclassified 377
Thaumarchaeota unclassified 270
unclassified unclassified 115
Bacteria 3420971 3704883
Acidobacteria Acidobacteria 2215
Acidobacteria ‘Solibacteres’ 4191 41
Acidobacteria unclassified 1743
Actinobacteria Actinobacteria 546521 382055
Aquificae Aquificae 2166
Bacteroidetes Bacteroidia 38414 1306
Bacteroidetes Cytophagia 224023
Bacteroidetes Flavobacteriia 178112 526723
Bacteroidetes Sphingobacteriia 57455 516940
Bacteroidetes unclassified 7043 6954
Chlamydiae ‘Chlamydiia’ 1621
Chlorobi ‘Chlorobia’ 10540
Chloroflexi Anaerolineae 441 679
Chloroflexi Dehalococcoidetes 836
Chloroflexi Chloroflexi 5898
Chloroflexi Ktedonobacteria 789
Chloroflexi Thermomicrobia 1342
Cyanobacteria Gloeobacteria 1075
Cyanobacteria Cyanobacteria 25512 32848
Deferribacteres Deferribacteres 937
Deinococcus-Thermus Deinococci 6560 1816
Dictyoglomi Dictyoglomia 513
Firmicutes Bacilli 29929 8601
Firmicutes Clostridia 30400 19916
Firmicutes ‘Erysipelotrichi’ 196
Firmicutes Negativicutes 2278
Firmicutes unclassified 696
Fusobacteriia Fusobacteriia 2224 837
Gemmatimonadetes Gemmatimonadetes 1484
Table 8Taxonomic composition of the sample(Continued)
Planctomycetes Planctomycetia 12967 49
Proteobacteria Alphaproteobacteria 220054 151267
Proteobacteria Betaproteobacteria 1597220 1225776
Proteobacteria Deltaproteobacteria 36851 9357
Proteobacteria Epsilonproteobacteria 6449 3645
Proteobacteria Gammaproteobacteria 322470 667102
Proteobacteria ‘Zetaproteobacteria’ 632
Proteobacteria unclassified 6963 12414
Spirochaetes Brachyspirae 385
Spirochaetes Spirochaetia 4917 815
Synergistetes Synergistia 1086 17795
Tenericutes Mollicutes 1478 1697
Thermotogae Thermotogae 2105 1004
Verrucomicrobia Lentisphaerae 1099
Verrucomicrobia ‘Methylacidiphilae’ 722
Verrucomicrobia Opitutae 4479 46474
Verrucomicrobia ‘Spartobacteria’ 2286 678
Verrucomicrobia Verrucomicrobiae 5061 1135
Verrucomicrobia unclassified 350
unclassified unclassified 6087 61031
Eukaryota 66903
Apicomplexa Aconoidasida 885
Apicomplexa Coccidia 443
Arthropoda Arachnida 300
Arthropoda Branchiopoda 606
Arthropoda Insecta 4901
Ascomycota Dothideomycetes 808
Ascomycota Eurotiomycetes 3193
Ascomycota Leotiomycetes 353
Ascomycota Pezizomycetes 119
Ascomycota Saccharomycetes 2579
Ascomycota Schizosaccharomycetes 429
Ascomycota Sordariomycetes 2809
Bacillariophyta Bacillariophyceae 317
Basidiomycota Agaricomycetes 920
Basidiomycota Tremellomycetes 414
Basidiomycota unclassified 156
Chlorophyta Chlorophyceae 1145
Chlorophyta Mamiellophyceae 1032
Chlorophyta Trebouxiophyceae 299
Chordata Actinopterygii 1986
Chordata Amphibia 7102
Chordata Ascidiacea 264
Lynchburg, and this could explain the high number of non-indigenous fish and fish disease hits.
As was observed for bacterial sequences, eukaryote se-quences reflected the high level of anthropogenic use of and impact upon James River, and many eukaryote se-quences were assigned to known disease agents or dis-ease carriers relevant to humans, food crops, or fishes. The most abundant taxa with epidemiological relevance were Apicomplexa (2 % of WGS assigned eukaryote reads), Culicidae (2 % of WGS eukaryote reads), Ony-genales (2 % of WGS eukaryote reads), Trypanosomati-dae (1 % of WGS eukaryote reads), HexamitiTrypanosomati-dae (0.8 % of WGS eukaryote reads), Vahlkampfiidae (0.7 % of WGS eukaryote reads), Trichomonidae (0.5 % of WGS eukaryote reads), Sclerotiniaceae (0.5 % of WGS eukaryote reads),Phytophthora(0.5 % of WGS eukaryote reads),Schistosoma(0.3 % of WGS eukaryote reads), and
Trichinella(0.2 % of WGS eukaryote reads).
Archaea and viruses/bacteriophages each accounted for ~0.2 % of assigned reads. Most Archaea reads were
Euryarchaeota (81 %), represented by a diverse array of chemoautotrophs and Crenarchaeota (14 %). Virus and bacteriophage reads included assignments to Myoviridae,
a type of Caudovirus, and Vibriophage, and were notable in their associations with other detected bacterial and eukaryotic taxa. In future studies that employ sampling methods to better capture viruses and phages, it may be possible to interpret the phage and virus records as proxies for bacterial or eukaryotic organisms with which there are known associations.
Comparative PCoA analysis of the James River WGS metagenome to 13 other aquatic WGS metagenomes ac-cessible through MG-RAST indicated that James River was similar to Mississippi River samples [21, 25], and that these rivers were more similar to sludge [32] and aquaculture pond [33] metagenomes than to the meta-genomes of lakes experiencing blooms [34] or Chesa-peake Bay [35], the geographically proximal saline body of water into which James River empties. Cross-assembling the James River WGS metagenome with other freshwater aquatic metagenomes via crAss (an approach that allowed investigation of metagenomes not posted to MG-RAST) supported the interpret-ation that the James River metagenome was genetic-ally most similar to Mississippi River (minimum genetic distance 0.11) and more similar to
Table 8Taxonomic composition of the sample(Continued)
Chordata Mammalia 4801
Chordata unclassified 487
Ciliophora Oligohymenophorea 1052
Cnidaria Anthozoa 1749
Cnidaria Hydrozoa 8973
Echinodermata Echinoidea 348
Hemichordata Enteropneusta 209
Heterolobosea Heterolobosea 440
Ichthyosporea Ichthyosporea 291
Microsporidia unclassified 127
Nematoda Chromadorea 1450
Nematoda Enoplea 111
Phaeophyceae unclassified 347
Placozoa unclassified 246
Platyhelminthes Trematoda 191
Rhodophyta Bangiophyceae 206
Streptophyta Appendicularia 259
Streptophyta Coniferopsida 253
Streptophyta Isoetopsida 306
Streptophyta Liliopsida 2100
Streptophyta unclassified 7129
unclassified unclassified 3558
Viruses 7684
Other** 3204
aquaculture [33] and sludge [32] metagenomes (mini-mum distance 0.26 and 0.63, respectively) than to the relatively more pristine waters of the upper Amazon River [17] (minimum distance 0.74) or to Lake Lanier [20] (minimum distance 0.75).
Functional diversity
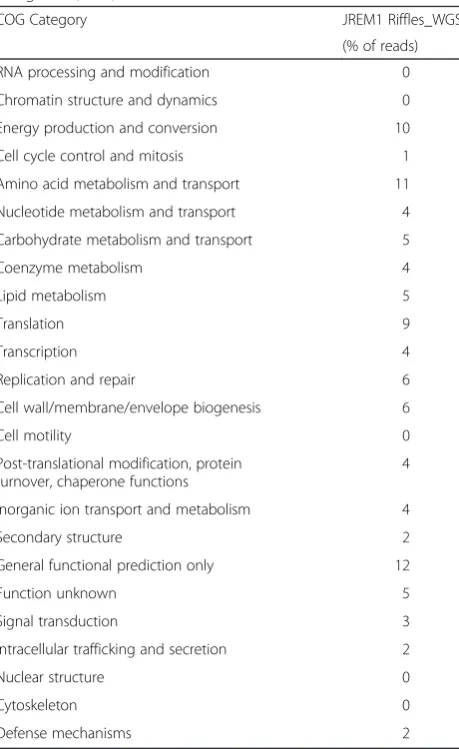
Genes associated with chromatin, cytoskeleton, nuclear structure, and cell motility (Table 9) were notably absent, a finding commensurate with the fact that the predomin-ant taxa in the sample were bacteria. Compared to other representative aquatic metagenomes [22, 32–34], the James River functional assignments, like Mississippi River, were in line with intensive aquaculture, a lake experien-cing algal bloom, and sludge, and very different from Chesapeake Bay. KEGG metabolic pathway maps provided deeper insight into the ecosystem functions conducted by the James River microbiota. Although the most complete identified pathways were associated with basic cellular maintenance (carbohydrate, amino acid, lipid, and energy
metabolism), a substantial number of partial metabolic pathways were related to xenobiotic biodegradation and metabolism. Multiple reaction links were evident for path-ways involved in processing or degrading atrazine, benzoate, bisphenol, chlorobenzene, chlorocyclohexane, ethylbenzene, PAHs, naphthalene, nitrotoluene, toluene, and xylene, many of which are PBTs. In many cases, the predicted xenobiotic pathways were indicated by abundances of identified enzymes exceeding 100 reads. For example, toluene degradation (enzyme entry 3.1.1.45) was implicated by 820 enzyme identifications, dioxin metabolism (en-zyme entry 1.14.13.1) was implicated by 555 en(en-zyme assignments, and benzoate degradation (enzyme entry 6.2.1.25) was implicated by 492 enzymes. Although the proportional representation among the SEED cat-egories was not well matched between James and Mississippi Rivers, the functional links implicated in the James River metagenome, especially the abun-dance of xenobiotic biodegradation pathways, coin-cided well with the links exhibited in two Mississippi River metagenomes (St. Cloud and Twin Cities [22]). It is important to note that this is only a snapshot of the response of the microbial consortium to an-thropogenic substances delivered to James River. It remains to be determined how quickly and to what degree the consortium shifts; if the river responds to increased amounts of synthetic compounds in much the same way as the human microbiome does [36], shifts in taxa and function could occur on the order of days. More complex sampling strategies across spatio-temporal scales are necessary to address this issue.
Additional results
This study revealed details of the function of the river as a medium for transmission of numerous infectious agents [37–39] , and garnered a wealth of epidemiologically-relevant data. Both prokaryotes and eukaryotes with health and disease implications were re-vealed by the taxonomic summaries. Numerous reads from both libraries matched plant and domestic animal pathogens: 21 % of the top 254 taxa in the WGS library and 28 % of the top 230 OTUs in the 16S library. Not-able among the known human, food crop, and fish path-ogens were Agrobacterium (0.5 % of WGS reads, 0.2 % of 16S reads), Bacteroides (0.9 % of WGS, 0.01 % of 16S),Burkholderia(1.5 % of WGS, 0.01 % of 16S) Chro-mobacterium(0.3 % of WGS, 0.2 % of 16S),Comamonas
(1.7 % of WGS, 0.07 % of 16S),Flavobacterium (2 % of WGS, 0.4 % of 16S),Legionella(0.08 % of WGS, 0.01 % of 16S), Mycobacterium (1 % of WGS, 0.005 % of 16S),
Novosphingobium (0.2 % of WGS, 0.004 % of 16S), pathogenic Pseudomonas species (3 % of WGS, 1 % of 16S), Ralstonia (0.7 % of WGS, 0 % of 16S), Vibrio Table 9Functional information: Composition of functional
categories (COG)
COG Category JREM1 Riffles_WGS
(% of reads)
RNA processing and modification 0
Chromatin structure and dynamics 0
Energy production and conversion 10
Cell cycle control and mitosis 1
Amino acid metabolism and transport 11
Nucleotide metabolism and transport 4
Carbohydrate metabolism and transport 5
Coenzyme metabolism 4
Lipid metabolism 5
Translation 9
Transcription 4
Replication and repair 6
Cell wall/membrane/envelope biogenesis 6
Cell motility 0
Post-translational modification, protein turnover, chaperone functions
4
Inorganic ion transport and metabolism 4
Secondary structure 2
General functional prediction only 12
Function unknown 5
Signal transduction 3
Intracellular trafficking and secretion 2
Nuclear structure 0
Cytoskeleton 0
(0.4 % of WGS, 0 % of 16S), and pathogenic Enterobacte-riaceae (0.11 % of WGS, 0.11 % of 16S ). In addition, several of the cyanobacteria (Nostocophycideae, Oscilla-toriophycideae, Synechococcophycidea) detected in this sample have been noted in other metagenomic studies of toxic blooms [38], and are considered potentially pathogenic because the toxins they produce under bloom conditions have adverse effects on both aquatic living resources and humans. Of the 50 top eukaryotes de-tected based on MEGAN read abundance in the WGS data, 6 were known human, plant, and animal parasites or pathogens; notably Trichodina, Leishmania, Trypano-soma,Plasmodium,Naegleria, andBotryotinia.
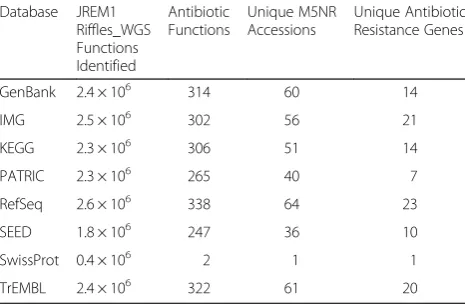
Out of the 2 % of reads revealed by MG-RAST to be associated with COG defense mechanisms (Table 9), 78 % were for multidrug resistance and 5 % were specif-ically for antibiotic resistance (Table 10), representing 13 different antibiotic resistance genes. These findings are consistent with the work of others [40] where antibiotic-resistant bacteria were isolated from freshwater samples from 16 US rivers at 22 sites, and studies showing high levels of antibiotic resistance in rivers in the UK [41], China [42], India [43], and Cuba [44]. The detection of antibiotic resistance genes is not necessarily surprising, given that so many natural organisms display resistance [45]; however, recent work in the Hudson River [46] documented a positive correction between counts of the fecal indicator Enterococcus and levels of resistant bac-teria, and demonstrated a shared sewage-agricultural-domesticated animal associated source. Moreover, the study of Chinese rivers [42] detected asyntheticplasmid vector-originated ampicillin resistance gene in samples from six rivers, with higher levels being found in habi-tats that receive more untreated waste. This synthetic plasmid has a number of industrial and agricultural applications and there is a large chance of uncontrolled discharge into the environment. Alternately, antibiotic resistance may be transferred to other members of the river consortium by other genetic processes. Antibiotic
resistance has been called one of the most pressing and urgent public health crises in the world [47], and our work, combined with the studies cited above, suggest that river water may serve as a significant reservoir or incubator for antibiotic resistance genes, where inputs of the waste from treated animals and humans could alter background levels of antibiotic resistance in the environment [44].
The implications of finding such a diverse array of pathogenic species in recreational waters are profound and indicate the utility of a metagenomic approach for early detection and prevention of WBDOs. However, there are a number of caveats to consider regarding the current data set and analyses. First, these assignments do not necessarily imply that the predicted organisms were living because the analysis was based on DNA, not RNA, and the DNA could have come from dead cells and/or dormant organisms from a previous contamin-ation event. Second, the assignments depend on the stringency of alignment settings and, because the ge-nomes of disease-causing organisms are generally more thoroughly studied and reported than the genomes of free-living organisms, the prevalence of pathogen assign-ments may be biased due to the over-representation of pathogenic genomes in the databases. In other words, some of these assignments may be non-pathogenic or-ganisms that have never been sequenced but are related to highly studied pathogens of humans, fishes, or crops. Finally, the sample is only a snapshot, as it was collected from a single segment of James River on a single day; conversely, one might speculate that some of the patho-genic groups detected that are not commonly observed in North America may be a signal of globalization and an indication of the changing demographic of Rich-mond’s human population.
In addition to the epidemiological ramifications of this metagenomic dataset, the novel ecological information it provides is notable. For example, other researchers who have studied the microbial consortia of rivers have con-cluded that river microbes generally are comparable to lake consortia [17, 48, 49]and we expected similar re-sults. In addition, we expected to observe a number of sequences that reflected a“Microbial Loop”[50] as illus-trated for another aquatic system [51], dominated by heterotrophic bacteria and including representatives of cyanobacteria and algae, protozoans, zooplankton (especially nematodes and cladocerans), insects, and ver-tebrates. Indeed, both of these expectations were sup-ported, and we observed that approximately half of the most abundant read assignments corresponded to mi-crobes identified as ecologically significant in lakes [23], fit the expected microbial functional patterns [50], and corresponded to the major groups of freshwater mi-crobes previously described and summarized [24] namely: ultramicrobacteria (made up of three groups
Table 10Functions associated with antibiotic resistance
Database JREM1 Riffles_WGS Functions Identified
Antibiotic Functions
Unique M5NR Accessions
Unique Antibiotic Resistance Genes
GenBank 2.4 × 10⁶ 314 60 14
IMG 2.5 × 10⁶ 302 56 21
KEGG 2.3 × 10⁶ 306 51 14
PATRIC 2.3 × 10⁶ 265 40 7
RefSeq 2.6 × 10⁶ 338 64 23
SEED 1.8 × 10⁶ 247 36 10
SwissProt 0.4 × 10⁶ 2 1 1
Polynucleobacterand other Betaproteobacteria, acI Acti-nobacteria, and certain Alphaproteobacteria), opportun-istic heterotrophs, phototrophs, and filamentous bacteria. Also as expected, the most commonly observed species in James River metagenome annotated reads was
Polynucleobacter, corresponding to other large river biome reports [22, 25]. Likewise, a large proportion of the detected metabolic processes corresponded to the
“natural” microbial loop. Interestingly, both taxonomic and functional analysis also revealed that a large compo-nent of the James River microbial consortium is process-ing a diverse suite of anthropogenic substances, providing especially a baseline reference for investigating the natural variability and function of bacteria that process polycyclic aromatic hydrocarbons, a group of microbes that are largely unexplored in the waters of this region. As was observed for the upper Mississippi River [22, 25], taxa represented in the James River meta-genome were linked to the varied anthropogenic effects ranging from urban, suburban, and industrial, to forested land and agriculture (Table 11). It was striking that nearly half of the dominant bacterial groups (48 % of the top 50 species identified by WGS, 31 % of the major OTUs identified by 16S) were associated with degrad-ation of pollutants and PBTs, sludge and other biological waste materials, or pathogenicity. At least 11 different prokaryote groups commonly associated with bioremedi-ation were indicated as present in the top 50 groups; most numerous among these were degraders of dichlo-roethane, polyaromatic and chlorinated hydrocarbons, methyl tertiary butyl ether, and PCBs, represented by
Polaromonas, Acidovorax, Nocardioides, and Burkhol-deria. Another seven species commonly used in industrial-scale production of metals, antibiotics, and spinosyns were indicated (including the genera Delftia,
Cupriavidus, and Saccharopolyspora). It is notable that, although they accounted for fewer assignments, tens of thousands of hits implicated presence of bacteria known
to process endocrine disruptors such as BPA (e.g., Rho-dococcus [52] and Sphingomonas [53]). Such a diverse set of indicators of industrial effluent implies heavy im-pact upon this reach of James River by industrial and medical waste. However, as for the predicted pathogens, the present data set, being derived from WGS, does not provide a definitive determination of whether these mi-crobes were active components of the James River eco-system or whether they represent some transient populations introduced by runoff or other hydrological processes. The assemblage of industry- and medical-re-lated microbes might be a consequence of the fact that the sample location is in the vicinity of CSOs, indicating that either the microbes or the substrates they metabolize are regularly disposed of to the sewer system. Similarly, the occurrence of so many different types of hydrocarbon de-graders is likely a signal of railway and automotive non-point source runoff in addition to the permitted hydrocar-bon and other point-source discharges. Whatever the sources, this metagenome snapshot indicates that a large portion of the ecological services provided by microbes of James River are related to biodegradation of anthropogen-ically introduced compounds.
Conclusions
This first published whole-genome report of the iconic James River is among the few existing metagenome re-ports for large river biomes. Rivers provide numerous ecosystem services for humans and we are especially dependent on them for fresh water supply and sanitation purposes. This metagenome analysis illustrates that the core freshwater planktonic bacterio- and eukaryoplank-ton communities of this non-tidal portion of James River closely mirror the upper Mississippi River [22, 25], both of which differ from lake systems studied in a similar manner. This metagenome provides evidence that there exists a river consortium response to anthropogenic pol-lution and illustrates that the epidemiologically-relevant
Table 11Putative roles of the most abundant bacterial and eukaryotic OTUs
JREM1 Riffles_WGS JREM1 Riffles_16S
Putative Role % OTUs reads % OTUs reads
Bacteria
Common free-living 52 1072474 68 2832637
Pollution degraders 22 484716 10 90537
Sludge, industrial, and medical waste 12 133200 9 184336
Pathogens (human, crops, and fish) 14 297920 12 132914
Eukaryote
Common free-living 52 3468 – –
Terrestrial/agriculture/aquaculture 33 1123 – –
Pathogens (human, crops, and fish) 14 261 – –
members of the James River microbial consortium are not a trivial component of the ecosystem and include organisms with genes for antibiotic resistance, which has recently been documented to be an important compo-nent of the human microbiome [54]. However, not all strains in the pathogenic genera detected are human or agricultural pathogens, and a limitation of this study is that pathogenic or virulent markers associated with the organisms found by sequencing were not further evalu-ated using PCR assays. Furthermore, because the current findings are based on limited sampling, generalizations cannot be made regarding spatio-temporal distributions of the indicated macro- and microbial communities. Deeper knowledge of associated interactions and poten-tial ecological and environmental implications require more robust studies with intensive samplings throughout the watershed; such an approach will enhance our un-derstanding of the occurrence, interactions, and ultim-ately the functions of these microbes, informing management and restoration efforts. The combined eco-logical and epidemioeco-logical analysis illustrates that a metagenomic approach is appropriate for addressing the challenges in identifying contamination sources and es-tablishing cumulative risk metrics, and demonstrates the tremendous potential of ecogenomic approaches which, when applied over space and time, could be a valuable tool for epidemiology - specifically for monitoring the simultaneous presence, movement, and evolution of WBDO agents including bacteria, cyanobacteria, viruses, and eukaryotes. This and further studies should there-fore allow health agencies to better identify organism-specific health risks and to enhance waterborne disease prevention efforts.
Abbreviations
BPA:Bisphenol A; CSO: Combined sewer overflow; Db: Database; FNU: Formazin nephelometric unit, a nephelometric turbidity measure; M5NR: M5 non-redundant protein database; PBT: Persistent bioaccumulative toxins; PCB: Polychlorinated biphenyl; TMDL: Total maximum daily load; WBDO: waterborne disease outbreaks.
Competing interests
The authors declare that they have no competing interests.
Authors’contributions
BLB conceived of the study, performed the sampling, DNA extraction, carried out the molecular genetic studies, participated in the sequence alignment, and drafted the manuscript. RVL participated in study design, site selection, and provided epidemiological input. RBF participated in study design, sequencing, and antibiotic resistance analysis. MCR participated in the sequence alignment and bioinformatics analysis. FMC participated in the design of the study and protist analyses. HLE participated in bioinformatic analyses and sequence alignment. VG assisted with impervious surface, data analyses, and figures. KPK provided data analysis, bioinformatics, and annotation. TLK performed some sequencing and statistical analyses. All authors read and approved the final manuscript.
Acknowledgements
This work was supported by the Virginia Commonwealth University Department of Biology and by GenEco, LLC, Richmond, Virginia. Partial funding for 16S sequencing was provided by the Aquatic Ecology Branch of
the US Geological Survey’s Leetown Science Center. This paper is contribution #56 from the VCU Rice Rivers Center. The Jeffress Trust Awards in Interdisciplinary Research partially supported the contribution of M.C. Rivera. The authors acknowledge Arthur Butt and Roger Stewart of Virginia Department of Environmental Quality for responding to our Freedom of Information Act request and providing data relating to James River and its uses, Blair Krusz of Virginia Department of Conservation and Recreation for assistance with mapping, and Robin Johnson of US Geological Survey Leetown Science Center for sequencing support. The authors thank Michael Sadowsky, Christopher Staley, and Trevor Gould for sharing Mississippi River sequence accessions. The authors also appreciate the valuable insight provided by two anonymous reviewers, and acknowledge John Miller and Aaron Aunins at the US Geological Survey, Leetown Science Center for critical review of this report. Use of trade, product, or firm names does not imply endorsement by the U.S. Government.
Author details 1
Department of Biology, Virginia Commonwealth University, 1000 W Cary Street, Richmond, VA 23284, USA.2Environmental Epidemiology Division, Virginia Department of Health, 109 Governor Street, Richmond, VA 23219, USA.3Department of Microbiology and Immunology, Virginia
Commonwealth University, 1101 East Marshall Street, Richmond, VA 23298, USA.4School of Life Sciences, Virginia Commonwealth University, 1000 W Cary Street, Richmond, VA 23284, USA.5Virginia Department of Conservation and Recreation, Soil and Water Conservation, 600 East Main Street, Richmond, VA 23219, USA.6Argonne National Laboratory, Biosciences Division, 9700 South Cass Avenue, Argonne, IL 60439, USA.7US Geological Survey, Aquatic Ecology Branch, Leetown Science Center, 11649 Leetown Road, Kearneysville, WV 25430, USA.
Received: 26 January 2015 Accepted: 19 August 2015
References
1. Smock LA, Wright AB, Benke AC. Atlantic Coast Rivers of the Southeastern United States. In: Benke AC, Cushing CE, editors. Rivers of North America. New York: Academic; 2005. p. 72–122.
2. National Landcover Database. [http://www.mrlc.gov/nlcd2006.php]. 3. Virginia Department of Environmental Quality: Persistent bioaccumulative
toxic chemicals and toxics release inventory. [http://www.deq.state.va.us/ Programs/Air/AirQualityPlanningEmissions/SARATitleIII/
SARA313ToxicsReleaseInventory.aspx].
4. Hlavsa MC, Roberts VA, Anderson AR, Hill VR, Kahler AM, Orr M, et al. Surveillance for waterborne disease outbreaks and other health events associated with recreational water - United States, 2007–2008. Morbid Mortal Week Rept. 2011;60:1–32.
5. Harwood VJ, Staley C, Badgley BD, Borges K, Korajkic A. Microbial source tracking markers for detection of fecal contamination in environmental waters: Relationships to pathogens and human health outcomes. FEMS Microb Rev. 2014;38:1–40.
6. Newton R, Bootsma M, Morrison H, Sogin M, McLellan S. A microbial signature approach to identify fecal pollution in the waters off an urbanized coast of Lake Michigan. Microb Ecol. 2013;65:1011–23.
7. Unno T, Jang J, Han D, Kim JH, Sadowsky MJ, Kim OS, et al. Use of barcoded pyrosequencing and shared OTUs to determine sources of fecal bacteria in watersheds. Environ Sci Technol. 2010;44:7777–82.
8. Mutreja A, Kim DW, Thomson NR, Connor TR, Lee JH, Kariuki S, et al. Evidence for several waves of global transmission in the seventh cholera pandemic. Nature. 2011;477:462–6.
9. Aarestrup FM, Brown EW, Detter C, Gerner-Smidt P, Gilmour MW, HArmsen D, et al. Integrating genome-based informatics to modernize global disease monitoring, information sharing, and response. Emerg Infect Dis. 2012;18, e1. 10. Clean Water Act Section 303(d). [water.epa.gov/lawsregs/guidance/303.cfm]. 11. Meyer F, Paarmann D, D’Souza M, Olson R, Glass EM, Kubal M, et al. The
metagenomics RAST server–a public resource for the automatic phylogenetic and functional analysis of metagenomes. BMC Bioinformatics. 2008;9:386. 12. Huson DH, Mitra S, Ruscheweyh H-J, Weber N, Schuster SC. Integrative analysis
14. Bartram AK, Lynch MD, Stearns JC, Moreno-Hagelsieb G, Neufeld JD. Generation of multimillion-sequence 16S rRNA gene libraries from complex microbial communities by assembling paired-end Illumina reads. Appl Environ Micro. 2011;77:3846–52.
15. Kent WJ. BLAT—the BLAST-like alignment tool. Genome Res. 2002;12:656–64. 16. Dutilh BE, Schmieder R, Nulton J, Felts B, Salamon P, Edwards RA, et al.
Reference-independent comparative metagenomics using cross-assembly: crAss. Bioinformatics. 2012;28:3225–31.
17. Ghai R, Rodriguez-Valera F, McMahon KD, Toyama D, Rinke R, deOliveira TCS, et al. Metagenomics of the water column in the pristine upper course of the Amazon River. PLoS One. 2011;6, e23785.
18. Ghai R, Hernandez CM, Picazo A, Mizuno CM, Ininbergs K, Dı́ez B, et al. Metagenomes of Mediterranean coastal lagoons. Sci Rep. 2012;2:490. 19. Holben B. GC Fractionation allows comparative total microbial community
analysis, enhances diversity assessment, and facilitates detection of minority populations of bacteria. In: DeBruijn FJ, editor. Handbook of molecular microbial ecology I: Metagenomics and complementary approaches. New York: John Wiley & Sons, Inc; 2011. p. 183–96.
20. Oh S, Caro-Quintero A, Tsementzi D, DeLeon-Rodriguez N, Luo C, Poretsky R, et al. Metagenomic insights into the evolution, function, and complexity of the planktonic microbial community of Lake Lanier, a temperate freshwater ecosystem. Appl Environ Microbiol. 2011;77:6000–11. 21. Mukherjee S, Huntemann M, Ivanova N, Kyrpides NC, Pati A. Large-scale
contamination of microbial isolate genomes by Illumina PhiX control. Stand Genomic Sci. 2015;10:18.
22. Staley C, Gould TJ, Wang P, Phillips J, Cotner JB, Sadowsky MJ. Core functional traits of bacterial communities in the Upper Mississippi River show limited variation in response to land cover. Front Microbiol. 2014;5:1–11.
23. Newton RJ, Jones SE, Eiler A, McMahon KD, Bertilsson S. A guide to the natural history of freshwater lake bacteria. Microbiol Mol Biol Rev. 2011;75:14–49. 24. Pernthaler J. Freshwater microbial communities. In: Rosenberg E et al., editors. The Prokaryotes–Prokaryotic Communities and Ecophysiology Chapter 6. Berlin Heidelberg: Springer-Verlag; 2013. p. 97–112. 25. Staley C, Unno T, Gould TJ, Jarvis B, Phillips J, Cotner JB, et al. Application of
Illumina next-generation sequencing to characterize the bacterial community of the Upper Mississippi River. J Appl Microbiol. 2013;115:1147–58. 26. Jeon CO, Park W, Ghiorse WC, Madsen EL.Polaromonas naphthalenivorans
sp. nov., a degrading bacterium from naphthalene-contaminated sediment. Int J Syst Evol Micro. 2004;54:93–7. 27. Wen A, Fegan M, Hayward C, Chakraborty S, Sly L. Phylogenetic
relationships among members of theComamonadaceae, and description of Delftia acidovorans(den Dooren de Jong 1926 and Tamaoka et al. 1987) gen. nov., comb. nov. Int J Syst Bacteriol. 1999;49:567–76.
28. Khan S, Sistla S, Dhodapkar R, Parija SC. FatalDelftia acidovoransinfection in an immunocompetent patient with empyema. Asian Pac J Trop Biomed. 2012;2:923–4.
29. Chotikanatis K, Bäcker M, Rosas-Garcia G, Hammerschlag MR. Recurrent intravascular-catheter-related bacteremia caused byDelftia acidovoransin a hemodialysis patient. J Clin Microbiol. 2011;49:3418–21.
30. Boon N, Top EM, Verstraete W, Siciliano SD. Bioaugmentation as a tool to protect the structure and function of an activated-sludge microbial community against a 3-chloroaniline shock load. Appl Environ Microbiol. 2003;69:1511–20. 31. Abraham JM, Simon GL.Comamonas testosteronibacteremia: a case report
and review of the literature. Infec Dis Clin Prac. 2007;15:272–3. 32. Wang Z, Zhang X-X, Huang K, Miao Y, Shi P, Liu B, et al. Metagenomic
profiling of antibiotic resistance genes and mobile genetic elements in a tannery wastewater treatment plant. PLoS One. 2013;8, e76079. 33. Rodriguez-Brito B, Li L, Wegley L, Furlan M, Angly F, Breitbart M, et al. Viral
and microbial community dynamics in four aquatic environments. ISME J. 2010;4:739–51.
34. Steffen MM, Li Z, Effler TC, Hauser LJ, Boyer GL, Wilhelm SW. Comparative metagenomics of toxic freshwater cyanobacteria bloom communities on two continents. PLoS One. 2012;7, e44002.
35. Rusch DB, Halpern AL, Sutton G, Heidelberg KB, Williamson S, Yooseph S, et al. The Sorcerer II Global Ocean Sampling expedition: Northwest Atlantic through eastern tropical Pacific. PLoS Biol. 2007;5, e77.
36. Suez J, Korem T, Zeevi D, Zilberman-Schapira G, Thaiss CA, Maza O, et al. Artificial sweeteners induce glucose intolerance by altering the gut microbiota. Nature. 2014;514:181–6.
37. World Health Organization. Emerging issues in water and infectious disease. Geneva: World Health Organization; 2003.
38. Kinge CNW, Mbewe M, Sithebe NP. Detection of bacterial pathogens in river water using multiplex-PCR. In: Hernandez-Rodriguez P, Gomez APR, editors. Polymerase Chain Reaction. InTech; 2012.
39. Lampel KA, Al-Khaldi S, Cahill SM. Bad Bug Book–Handbook of Foodborne Pathogenic Microorganisms and Natural Toxins. 2nd ed. Washington, DC: US Food and Drug Administration, US Department of Health and Human Services; 2012.
40. Ash RJ, Mauck B, Morgan M. Antibiotic resistance of gram-negative bacteria in rivers, United States. Emerg Infect Dis. 2002;8:713–6.
41. Wellington EMH, Boxall ABA, Cross P, Feil EJ, Gaze WH, Hawkey PM, et al. The role of the natural environment in the emergence of antibiotic resistance in Gram-negative bacteria. Lancet Infec Dis. 2013;13:155–65. 42. Chen J, Jin M, Qui ZG, Guo C, Chen Z-L, Shen Z-Q, et al. A survey of drug
resistanceblagenes originating from synthetic plasmid vectors in six Chinese rivers. Environ Sci Technol. 2012;46:13448–54.
43. Fick J, Söderström H, Lindberg RH, Phan C, Tysklind M, Larsson DGJ. Contamination of surface, ground, and drinking water from pharmaceutical production. Envir Toxicol Chem. 2009;28:2522–7.
44. Graham DW, Olivares-Rieumont S, Knapp CW, Lima L, Werner D, Bowen E. Antibiotic resistance gene abundances associated with waste discharges to the Almendares River near Havana, Cuba. Environ Sci Technol. 2011;45:418–24. 45. Quintiliani Jr R, Sahm DF, Courvalin P. Mechanism of resistance to antimicrobial
agents. In: Murray PR, Baron EJ, Pfaller MA, Tenover FC, Yolken RH, editors. Manual of clinical microbiology. 7th ed. Washington: ASM Press; 1999. p. 1505–25. 46. Young S, Juhl A, O’Mullan GD. Antibiotic-resistant bacteria in the Hudson
River Estuary linked to wet weather sewage contamination. J Water Health. 2013;11:297–310.
47. Wise R, Hart T, Cars O, Streulens M, Helmuth R, Huovinen P, et al. Antimicrobial resistance is a major threat to public health. BMJ. 1998;317:609–10. 48. Winter C, Hein T, Kavka G, Mach RL, Farnleitner AH. Longitudinal changes in
the bacterial community composition of the Danube River: a whole- river approach. Appl Environ Microbiol. 2007;73:421–31.
49. Kirchman DL, Dittel AI, Findlay SEG, Fischer D. Changes in bacterial activity and community structure in response to dissolved organic matter in the Hudson River, New York. Aquat Microb Ecol. 2004;35:243–57.
50. Azam F, Fenchel T, Field JG, Gray JS, Meyer-Reil LA, Thingstad F. The ecological role of water-column microbes in the sea. Mar Ecol Prog Ser. 1983;10:257–63. 51. Stahl DA, Flowers JJ, Hullar M, Davidson S. Structure and function of microbial
communities. In: Rosenberg E et al., editors. The Prokaryotes–Prokaryotic Communities and Ecophysiology. Berlin Heidelberg: Springer; 2013. p. 1–29. 52. Villemur R, dos Santos SCC, Ouellette J, Juteau P, Lepine F, Déziel E.
Biodegradation of endocrine disruptors in solid–liquid two-phase partitioning systems by enrichment cultures. Appl Environ Microbiol. 2013;79:4701–11. 53. Carlisle J, Chan D, Golub M, Henkel S, Painter P, Wu KL. Toxicological profile for
bisphenol A Final report of the California Environmental Protection Agency Office of Environmental Health Hazard Assessment. Oakland: California Office of Environmental Health Hazard Assessment; 2009. http://www.opc.ca.gov/ webmaster/ftp/project_pages/MarineDebris_OEHHA_ToxProfiles/ Bisphenol%20A%20Final.pdf.
54. Vaz-Moreira I, Nunes OC, Manaia CM. Bacterial diversity and antibiotic resistance in water habitats: searching the links with the human microbiome. FEMS Microbiol Rev. 2014;38:761–78.
Submit your next manuscript to BioMed Central and take full advantage of:
• Convenient online submission
• Thorough peer review
• No space constraints or color figure charges
• Immediate publication on acceptance
• Inclusion in PubMed, CAS, Scopus and Google Scholar
• Research which is freely available for redistribution