RESEARCH
Expression and epigenomic landscape
of the sex chromosomes in mouse post-meiotic
male germ cells
Charlotte Moretti
1,2,3, Daniel Vaiman
1,2,3, Frederic Tores
4and Julie Cocquet
1,2,3*Abstract
Background: During meiosis, the X and Y chromosomes are transcriptionally silenced. The persistence of repressive chromatin marks on the sex chromatin after meiosis initially led to the assumption that XY gene silencing persists to some extent in spermatids. Considering the many reports of XY-linked genes expressed and needed in the post-meiotic phase of mouse spermatogenesis, it is still unclear whether or not the mouse sex chromatin is a repressive or permissive environment, after meiosis.
Results: To determine the transcriptional and chromatin state of the sex chromosomes after meiosis, we re-analyzed ten ChIP-Seq datasets performed on mouse round spermatids and four RNA-seq datasets from male germ cells purified at different stages of spermatogenesis. For this, we used the last version of the genome (mm10/GRCm38) and included reads that map to several genomic locations in order to properly interpret the high proportion of sex chromosome-encoded multicopy genes. Our study shows that coverage of active epigenetic marks H3K4me3 and Kcr is similar on the sex chromosomes and on autosomes. The post-meiotic sex chromatin nevertheless differs from autosomal chromatin in its enrichment in H3K9me3 and its depletion in H3K27me3 and H4 acetylation. We also identified a posttranslational modification, H3K27ac, which specifically accumulates on the Y chromosome. In parallel, we found that the X and Y chromosomes are enriched in genes expressed post-meiotically and display a higher pro-portion of spermatid-specific genes compared to autosomes. Finally, we observed that pro-portions of chromosome 14 and of the sex chromosomes share specific features, such as enrichment in H3K9me3 and the presence of multicopy genes that are specifically expressed in round spermatids, suggesting that parts of chromosome 14 are under the same evolutionary constraints than the sex chromosomes.
Conclusions: Based on our expression and epigenomic studies, we conclude that, after meiosis, the mouse sex chro-mosomes are no longer silenced but are nevertheless regulated differently than autosomes and accumulate different chromatin marks. We propose that post-meiotic selective constraints are at the basis of the enrichment of spermatid-specific genes and of the peculiar chromatin composition of the sex chromosomes and of parts of chromosome 14.
Keywords: Sex chromosomes, Post-meiotic sex chromatin, MSCI, Spermiogenesis, Mouse, H3K4me3, Crotonylation, H3K9me3, H3K27ac, Chromosome 14
© The Author(s) 2016. This article is distributed under the terms of the Creative Commons Attribution 4.0 International License (http://creativecommons.org/licenses/by/4.0/), which permits unrestricted use, distribution, and reproduction in any medium, provided you give appropriate credit to the original author(s) and the source, provide a link to the Creative Commons license, and indicate if changes were made. The Creative Commons Public Domain Dedication waiver (http://creativecommons.org/ publicdomain/zero/1.0/) applies to the data made available in this article, unless otherwise stated.
Background
Sex chromosomes differ from autosomes in their genome organization, gene content and gene expression. At the
basis of those differences is the fact that they are under different evolutionary constraints due to loss of recom-bination and sexual antagonism (i.e., when a gene is ben-eficial to one sex but detrimental to the other) [1–6]. In mammalian males, sex chromosomes are highly hetero-morphic and only recombine via a small region usually located at the tip of the chromosome (the PAR, pseudo-autosomal region), while in females the X chromosome
Open Access
*Correspondence: julie.cocquet@inserm.fr
1 Institut National de la Sante et de la Recherche Medicale (INSERM) U1016, Institut Cochin, Paris, France
can recombine. Meaning that, compared to a classic pair of autosomes, the X only recombines two-thirds of the time and most of the Y chromosome does not recombine at all, and is hence called MSY for male-specific region on the Y [7, 8].
One particular phenomenon which affects mamma-lian sex chromosome gene content and expression takes place in male germ cells: During meiosis, the X and Y chromosomes are transcriptionally silenced by a series of chromatin-based events. The precise role of meiotic sex chromosome inactivation (MSCI) is unknown, but it is conserved and essential in all mammals studied so far and in more distant species such as C. elegans (see [9–
12] for reviews). While XY chromosomes are enriched in genes expressed in spermatogonia, they are devoid of genes expressed during meiosis, as a consequence of MSCI [13, 14]. Whether or not XY chromosomes remain to some extent silent after meiosis is still controversial (see below).
Based on many studies performed using mostly mouse as a model, MSCI is known to start in spermatocytes at the pachytene stage of meiotic prophase I with phos-phorylation of histone H2A variant X by ATR- and MDC1-mediated spreading of this signal over the sex chromosomes [15, 16]. This is followed by changes in histone posttranslational modifications, such as di- and trimethylation of the lysine 9 of histone H3 (H3K9me2 and me3) and ubiquitination of histone H2A (uH2A), and recruitment of heterochromatin proteins (CBX1 and CBX3) [17–21]. Some other changes in the sex chroma-tin appear later, such as deacetylation of histones H3 and H4 [19], replacement of the canonical histones H3 (H3.1 and H3.2) by H3.3 variant and methylation of the lysine 20 of histone H4 (H4K20me) at mid-pachytene [22]. All these changes in the composition of the sex chromatin are accompanied by its compaction and re-localization at the periphery of the spermatocyte nucleus in a structure called the sex body [23].
After meiosis, in spermatids, the sex chromatin (either from the X or the Y chromosome since spermatids are haploid) can still be easily distinguished from autosomal chromatin, as a more DAPI-dense structure immediately adjacent to the constitutive heterochromatin regrouped into one or two chromocenters (Fig. 1a) [24–26]. Some of the repressive chromatin marks and chromatin-asso-ciated proteins observed on the sex body during meiosis (H3K9me2 and H3K9me3, CBX1 and CBX3) are still vis-ibly enriched on the post-meiotic sex chromatin [24–26]. These heterochromatin-like features suggest that XY gene silencing persists in spermatids, with most genes repressed and only a few “escapees” [24–28]. There are nevertheless many reports of sex chromosome-encoded genes expressed and needed in the post-meiotic phase of
spermatogenesis [29–36] and, in 2008, Mueller et al. have demonstrated that the mouse X chromosome is actually enriched in multicopy genes expressed in spermatids [37].
Interestingly, (re)activation of XY gene expression in spermatids coincides with changes in nucleosomal histones and histone modifications which appear, by immunofluorescence, to coat the post-meiotic sex chro-matin, such as H2A.Z [24], H2A.B3 (also known as H2A. Lap1) [38], histone lysine crotonylation Kcr [39, 40], his-tone 3 lysine 4 di- and trimethylation (H3K4me2 and H3K4me3) [19, 22], and histone 4 lysine 8 2-hydroxy-butyrate (H4K8_hib) [41] (see Fig. 1b). Presence/enrich-ment of histone variants and histone posttranslational modifications (PTM) on the post-meiotic sex chromatin has been shown to correlate with XY gene expression and, when abnormal, to lead to sperm differentiation defects and male infertility [34, 42–44]. Initially, accumu-lation of histone variants and PTM onto the post-meiotic sex chromatin was deduced from immunofluorescence observations; but when looked at by chromatin immu-noprecipitation followed by high-throughput sequencing (ChIP-Seq), discrepancies with immunofluorescence data were observed. Indeed, by ChIP-Seq, Kcr does not appear to cover more the X chromosome than autosomes [39], and H4K8_hib is even less present on the X chromosome than on autosomes [41]; this is despite the fact that both marks are enriched at the transcriptional start site (TSS) of many post-meiotic activated X-encoded genes (i.e., genes which are upregulated in spermatids compared to spermatocytes) [39, 41]. No conclusion could be drawn for the Y chromosome since, in the mm9 version of the mouse genome available at that time (mm9), only 15% of the Y chromosome was assembled (cf. Fig. 1c).
Therefore, in the present study, we sought to compare the composition of the sex chromatin with that of auto-somal using ChIP-Seq and the last version of the mouse genome (mm10/GRCm38). We re-analyzed ten ChIP-Seq datasets performed on mouse round spermatids and showed that active epigenetic marks are similarly present on the sex chromosomes and on autosomes, but that the post-meiotic sex chromatin nevertheless differs from autosomal chromatin in its content in repressive chro-matin marks and in histone acetylation. We also identify a histone PTM, H3K27ac, which specifically accumu-lates on the Y chromosome, suggesting that regulation of the X and Y chromosomes may differ during sperm differentiation.
post-meiotically and display a higher proportion of spermatid-specific genes compared to autosomes though with a range of gene expression values start-ing lower than autosomal genes. Finally, we found that chromosome 14 and the sex chromosomes share some specific features, such as enrichment in H3K9me3 and the presence of clusters of spermatid-specific genes amplified only in rodents, suggesting that part of chro-mosome 14 is under the same evolutionary constraints than the sex chromosomes.
Overall, we conclude that, after meiosis, the mouse sex chromosomes are no longer silenced but are nevertheless regulated differently than autosomes and accumulate dif-ferent chromatin marks. MSCI does not appear to have a strong impact on XY gene expression; we propose that other selective constraints such as the regulatory effect of the X versus Y chromosome intragenomic conflict driven by Slx/Sly [45] are at the basis of the significant enrich-ment of round spermatid-specific genes on the sex chro-mosomes and on chromosome 14, and of the peculiar features of their chromatin after meiosis.
Results
Conserved and specific features of the post‑meiotic sex chromatin
There have been several reports of enrichment of histone variants or histone posttranslational modifications on the PMSC based on immunofluorescence observations. This is the case of H2A variants H2A.Z and H2A.B3 (aka H2A.Lap1) [24, 38], H3.3 variant [22], and of histone PTM H3K4me2 [19], H3K4me3 [22], H3K9me2 [19, 22,
25, 26], H3K9me3 [22], H4K16ac [25], histone lysine cro-tonylation Kcr [39] and histone 4 lysine 8 2-hydroxybu-tyrate H4K8_hib [41]. ChIP-Seq analyses also highlighted the specific enrichment of Kcr and H2A.B3 at the TSS of a subset of activated X-linked genes after meiosis, as well as the depletion of H4K8_hib on the X chromosome [38,
39, 41].
We sought to determine to what extent sex chroma-tin differs from autosomal chromachroma-tin by systematically re-analyzing 10 ChIP-Seq datasets of histone PTM per-formed in mouse purified round spermatids using the last version of the mouse genome (mm10/GRCm38).
Fig. 1 Post-meiotic sex chromatin. a Immunofluorescence pictures of a round spermatid nucleus stained with DAPI (left in black and white; right
This last version (mm10) is more complete than the pre-vious version (mm9, NCBI built 37) especially regarding Y chromosome sequence (see Fig. 1c) but is still scarcely used in the literature. Importantly, to include multicopy genes in our analysis, reads which mapped perfectly to several genomic regions were not ignored and were dis-tributed to one location picked randomly.
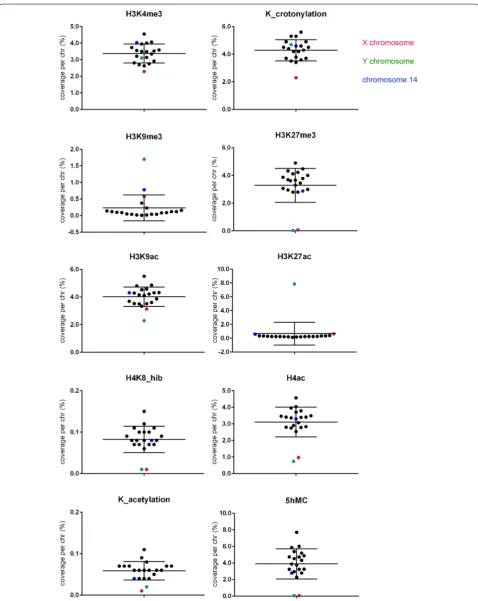
For each ChIP-Seq dataset, we compared the coverage, i.e., total number of base pairs covered by the chromatin mark, on the X chromosome, the Y chromosome and all autosomes (Fig. 2; Additional file 1). We particularly compared coverage between the sex chromosomes and autosomes of equivalent length and number of genes (i.e., chromosomes 3 and 6 for the X chromosome, and chro-mosomes 16 and 18 for the Y chromosome, see Table 1
and Additional file 1). Chromosome per chromosome coverage of ChIP peaks was determined in base pair (Additional file 2) and reported to the total length of each chromosome (Fig. 2; Additional file 1). A snapshot of the obtained ChIP-Seq peaks on portion of relevant chromo-somes is shown in Additional file 3.
With this method, H3K4me3 and Kcr, two active chro-matin marks which appear enriched on the PMSC based on immunofluorescence observations [22, 39, 41], did not have a higher coverage of the sex chromosomes than of autosomes: H3K4me3 and Kcr coverage of the Y was found within the range of that of autosomes, while X chromosome coverage was in fact slightly lower (Fig. 2; Additional files 1, 2 and 3).
With the same approach, we analyzed the repressive chromatin marks H3K9me3 and H3K27me3. Consistent with immunofluorescence observations, H3K9me3 was found enriched on the PMSC compared to autosomes by ChIP-Seq. This enrichment is particularly striking for the Y chromosome since 1.7% of the Y appears covered by H3K9me3 compared to 0.09 and 0.04% of chromosomes 16 and 18, respectively (Fig. 2; Additional file 1). In total, H3K9me3 coverage of the Y chromosome accounts for 25% of its entire genome coverage (while the Y only rep-resents 3.4% of the genome). In comparison, 0.58% of the X is covered by H3K9me3 (compared to 0.1 and 0.04% of chromosomes 3 and 6, respectively) and the X chro-mosome accounts for 16% of H3K9me3 entire genome coverage (while the X represents 6.3% of the genome). Surprisingly, we observed that chromosome 14 is the sec-ond chromosome most enriched in H3K9me3 (0.78% of its length) with H3K9me3 coverage on chromosome 14 accounting for 16% of its entire genome coverage (while chromosome 14 only represents 4.6% of the genome) (Fig. 2; Additional file 1).
As for H3K27me3, it is particularly depleted on both sex chromosomes after meiosis (Fig. 2; Additional files 1 and 2) with 0.07% of the X and 0.03% of the Y
chromosome covered by this mark compared to 2.8, 2.95, 3 and 3.3% of chromosomes 3, 6, 16 and 18, respec-tively (genome coverage: 3.2%) (Fig. 2). The difference in H3K27me3 between the sex chromosomes and auto-somes is also very striking when comparing any portion of the sex chromosomes with that of autosomes (Addi-tional file 3). These results are in agreement with previ-ous immunofluorescence observations [22, 25].
H3K27me3 and H3K27ac are mutually exclusive; we therefore investigated H3K27ac location in post-meiotic germ cells. Interestingly, we observed an enrichment in H3K27ac on the Y chromosome with 7.9% of the Y cov-ered by this mark compared to 0.3 and 0.2% of chromo-somes 16 and 18, respectively (genome coverage: 0.6%). This is not the case of the X chromosome since 0.6% is covered by H3K27ac compared to 0.2 and 0.3% of chro-mosomes 3 and 6, respectively (Fig. 2; Additional files 1,
2 and 3). To the best of our knowledge, enrichment of H3K27ac on the Y has never been described before; we therefore performed immunofluorescence detection and observed that approximately 50% (28/55) of round sper-matids display enrichment of H3K27ac over the PMSC, while the other 50% display a strong diffuse signal not particularly brighter over the PMSC (Fig. 3; Additional file 4). These observations suggested an enrichment of H3K27ac on the Y chromosome (in Y-bearing sperma-tids which represent ~50% of spermasperma-tids) but not on the X (diffuse signal in X-bearing spermatids, which rep-resent ~50% of spermatids). To confirm that, we stud-ied a mouse model with a large deletion (>96%) of its Y chromosome (deletion of the male-specific region of the Y chromosome long arm, MSYq- males) [8, 46]. In this model, the vast majority of round spermatids (59/65) displays a bright diffuse H3K27ac enrichment, without enrichment over the PMSC (Fig. 3; Additional file 4) confirming that H3K27ac enrichment is specific of the Y chromosome.
Looking at other available round spermatid ChIP-Seq datasets for chromatin marks, we found that PMSC is particularly depleted in histone 4 lysine 8 2-hydroxy-butyrate (H4K8_hib) in acetylated histone H4 (H4ac) and globally in histone acetylation (K_acetylation) (Fig. 2; Additional files 1, 2 and 3). This confirms previ-ous observations that the X chromosome is depleted in H4K8_hib and H4K8_ac (histone 4 lysine 8 acetylation) in spermatocytes and round spermatids [41]. There is also slightly less H3K9ac on PMSC than on autosomes when normalized to chromosome size (Fig. 2; Additional files 1 and 2).
and show that the Y chromosome is also devoid of 5hMC (Fig. 2; Additional files 1 and 2).
Dynamics of XY gene expression during spermatogenesis
To compare PMSC features with gene expression pro-files, we next re-analyzed RNASeq datasets performed on purified mouse germ cells at different stages of sper-matogenesis (spermatogonia B, pachytene spermato-cytes, round spermatids and elongating spermatids) [47], using the same mapping parameters we used to analyze
ChIP-Seq datasets (i.e., last version of the mouse genome and parameters allowing the mapping of reads from mul-ticopy genes). Using these datasets, we compared the dynamics of expression of sex chromosome-encoded and autosomal genes, according to their RPKM value. The threshold RPKM value (0.22) above which a gene was considered as expressed was calculated by comparing the expression levels of exons and intergenic regions, as pre-viously described in Ramsköld et al. [48]. Importantly, in our analysis we considered one Ensembl gene ID equals Table 1 Mouse chromosome statistics (from mm10/GRC38 Ensembl gene 81)
Chromosomes X Y 1 2 3 4 5 6 7 8
Length (Mb) including gaps 171 92 195 182 160 157 152 150 145 129
Nber of Genes 2607 1570 3431 3751 2891 2863 3250 2348 3472 1786
Nber of Genes expressed at some
me during spermatogenesis 1310 358 1723 2119 1451 1763 1932 1207 1799 1239
% of Genes expressed at some point
of spermatogenesis 50,25 22,80 50,22 56,49 50,19 61,58 59,45 51,41 51,81 69,37
p value of χ2 test for X chromosome
versus autosomes (% of expressed genes)
6,77E-69 9,81E-01 9,04E-07 9,65E-01 3,32E-17 1,97E-12 4,16E-01 2,27E-01 1,74E-36
p value of χ2 test for Y chromosome versus autosomes (% of expressed genes)
6,77E-69 1,91E-74 8,37E-112 8,06E-71 6,88E-135 5,63E-126 9,30E-72 7,82E-83 5,10E-160
Fig. 3 Post-meiotic Y chromosome is enriched in H3K27ac. Immunofluorescence detection of H3K27ac (red) in round spermatid nuclei. DAPI (blue) was used to stain nuclei. The most DAPI-dense round region is the chromocenter (i.e., the constitutive pericentromeric heterochromatin) the less DAPI-dense structure adjacent to the chromocenter is the post-meiotic sex chromatin (PMSC) and is indicated by an arrow. Anti-H3K9me3 (in
one gene, that is to say related genes (such as genes of the same family or copies of the same gene) were not pooled and treated individually.
The X chromosome
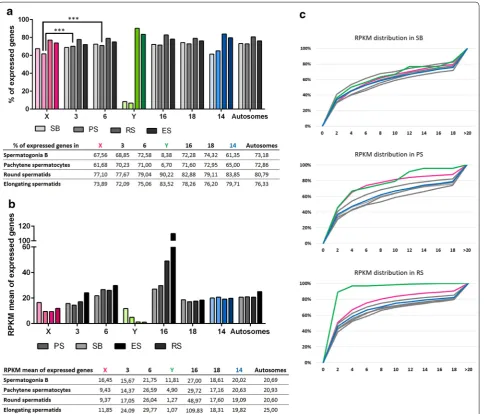
First, we found that, of the 2607 genes present on the X chromosome, 50.25% (1310 genes) are expressed at least during one stage of spermatogenesis; the same value was obtained for genes on chromosome 3 and chromosome 6 which can be used as reliable comparisons for the X chromosome in term of both length and number of genes (Table 1). It is noteworthy to indicate that for subsequent analysis we took into account genes that are at least expressed in one stage and ignored the genes which are completely silenced during spermatogenesis.
Just prior to meiosis, in spermatogonia B cells, the pro-portion of genes expressed varies from approximately 60–70% depending on the chromosome (Fig. 4a). The proportion of expressed X-linked genes is within the range of autosomes, i.e., similar to chromosome 3 but significantly different from chromosome 6 (Fig. 4a; Addi-tional file 5). Similarly, comparison of RPKM values of all genes showed that expression values of X-linked genes are within the range of that of autosomal genes but still with individual differences: this time, the X chromosome values differ from those obtained for chromosome 3 but are similar to chromosome 6 values (Fig. 4b; Additional file 6). These differences reflect the high heterogeneity between autosomes and should be kept in mind when comparing sex chromosomes to autosomes.
At the pachytene stage of meiosis, not only a lower pro-portion of X-linked genes is expressed compared to auto-somes (Fig. 4a; Additional file 5) but the RPKM mean value of X-linked genes is also decreased (Fig. 4b; Addi-tional file 6). A higher proportion of pachytene-repressed genes (i.e., expressed before meiosis in type B spermato-gonia but no more actively transcribed in pachytene) was also observed among X-linked genes compared to auto-somal genes (Fig. 5; Additional file 7), as expected as a consequence of MSCI. However, we still observed many X-encoded genes indicated as “expressed” in pachy-tene spermatocytes. Those are in fact genes which were expressed before pachytene but of which transcription products are still present in pachytene despite transcrip-tion shut down.
After meiosis, in round spermatids, the majority of pachytene-repressed genes do not recover their prior level of expression and were considered as round sper-matids non-reactivated genes (Fig. 5). This is true for autosomal genes and X-encoded genes (Fig. 5; Additional file 7). Of note, an identical proportion of X-linked genes than of autosomal genes are expressed in round sperma-tids (Fig. 4a; Additional file 5). Surprisingly, 30.46% of
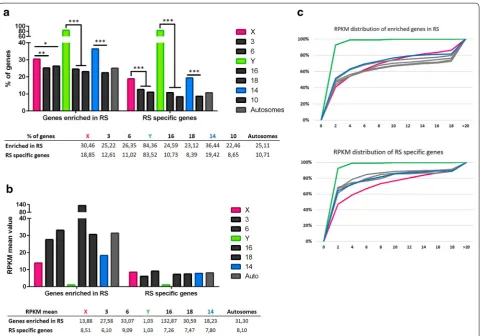
X-encoded expressed genes are enriched in round sper-matids (i.e., expressed higher in round spersper-matids than in pachytene spermatocytes). This is, overall, signifi-cantly higher than for autosomal genes (25.22 and 26.35% for chromosomes 3 and 6, respectively) (Fig. 6; Addi-tional file 8). Finally, we found that ~18% of X-encoded expressed genes are specifically expressed post-meioti-cally. This proportion of genes is also significantly higher for the X chromosome than for autosomes (12.61 and 11.02% for chromosomes 3 and 6, respectively) (Fig. 6; Additional file 8). In order to determine whether the high proportion of X-encoded round spermatid-specific genes is due to the abundance of X-linked multicopy genes and to the fact that, in our analysis, we considered one Ensembl gene ID equals one gene, we undertook an addi-tional analysis in which highly similar genes (i.e., genes of the same “family”) were treated as one gene (Additional file 9). The results obtained did not significantly differ from the initial analysis meaning that the chromosome X is genuinely enriched in single-copy genes and multi-copy genes specifically expressed at the round spermatids stage (Additional file 9).
Regarding the expression intensity (RPKM) of the genes enriched in round spermatids, the mean value is lower for X-encoded genes than for autosomal genes (chr 3, m = 27.58; chr 6, m = 33.07; X chr, m = 13.88), but unexpectedly it is not significantly different (Fig. 6b, c; Additional file 10). Chromosome 16 displays the high-est RPKM value (m = 132.87), an odd characteristic explained by the presence of genes massively expressed after meiosis: Tnp1, Prm1 and Prm2 (which, respectively, encode transition protein 1, protamines 1 and 2). Indeed, their expression value in round spermatids is over 5700 RPKM. Finally, although RPKM means of round sperma-tid-specific genes are in the same range for the X chro-mosome and autosomes (from 7.26 to 9.09), X-linked genes display a distribution of RPKM values that is sig-nificantly different from that of autosomal genes (Fig. 6c; Additional file 10).
The Y chromosome
Ssty2 or Srsy gene family, located on the Y chromo-some long arm. Indeed, the proportion of Y-linked genes expressed during spermatogenesis was dramatically increased when only genes (and not pseudogenes) were
analyzed (based on the data reported by Soh et al. [8]), and highly similar gene family members of the Y chro-mosome were treated as a single gene ID (see Additional file 9).
Fig. 4 Dynamics of XY gene expression and autosomal gene expression during spermatogenesis. a Percentage of expressed genes in spermatogo-nia B (SB), pachytene spermatocytes (PS), round spermatids (RS) and elongating spermatids for the sex chromosomes (X and Y), five representative chromosomes (chromosomes 3, 6, 14, 16 and 18) and all autosomes. In spermatogonia B, the proportion of expressed genes is similar between the X chromosome and autosomes. At the pachytene stage of meiosis I, the proportion of X-linked expressed genes is decreased due to MSCI. After meiosis, the proportion of expressed genes is similar between the X chromosome and autosomes. The Y chromosome is depleted in genes expressed before meiosis but enriched in round spermatids expressed genes. The percentage values are indicated in the table. The level of statistical significance is marked with three asterisks (*) if p < 0.001. b RPKM mean values of expressed genes in spermatogonia B, pachytene spermatocytes, round spermatids and elongating spermatids for the sex chromosomes (X and Y), five representative chromosomes (chromosomes 3, 6, 14, 16 and 18) and all autosomes. The expression level of X- and Y-linked genes is similar to that of autosomal genes in spermatogonia B. The value is indicated in the table. c Distribution of RPKM values of expressed genes in spermatogonia B, pachytene spermatocytes and round spermatids. The X-axis
In spermatogonia B cells, only 30 Y-linked genes are expressed; this represents 8.38% of all Y-encoded expressed genes compared to 72.28% of chromosome 16 and 74.32% of chromosome 18 expressed genes (Fig. 4a; Additional file 5). Its RPKM mean value is, however, not significantly different from the corresponding autoso-mal values (Fig. 4b; Additional file 6). This result can be explained in light of the RPKM value distributions which are overall similar for Y-linked genes and autosomal genes (Fig. 4c; Additional file 6).
At pachytene stage, most of the spermatogonia expressed genes are repressed or completely shut down: 7.54% of expressed genes are pachytene-repressed genes, which means that 90% of the spermatogonial B expressed genes are repressed at the pachytene stage of meiosis. This proportion is not comparable in chromosome 16 and chromosome 18 (Fig. 5; Additional file 7). As a con-sequence, the proportion of Y-encoded genes “expressed” at this stage drops to 6.7% (Fig. 4a; Additional file 5); their RPKM mean value drops down to 4.90 and is signifi-cantly lower than that of autosomes (Fig. 4b; Additional file 5). Strikingly, 90% of Y-linked expressed genes are in fact expressed after meiosis (Fig. 4a), the vast majority of them (83.52%) being exclusively de novo expressed in round spermatids (genes first expressed at the sperma-tid stage) (Fig. 6a) and still found expressed in elongating spermatids (Fig. 4a). These values are significantly higher for the Y than for autosomes (Figs. 4a, 6a; Additional files
5 and 8). The extremely low level of their RPKM values is a peculiarity of Y-linked genes expressed in round sper-matids (Figs. 4c, 6c; Additional files 6 and 10).
Chromosome 14
Chromosome 14 stands out compared to other auto-somes (more particularly to chromosome 10 which can be used as a reliable comparison for chromosome 14 in term of both length and number of genes) and resem-bles that of the X in its high proportion in spermatid-enriched genes (~36.44%) and in spermatid-specific genes (~19.42%, Fig. 6a; Additional file 8). The mapping of these spermatid-specific genes revealed two regions that are both deprived of round spermatid non-reacti-vated genes and densely composed of round spermatid-specific genes (Fig. 7; genes listed in Additional file 11). The RPKM mean value of this group of genes is inciden-tally lower than that of spermatid-specific autosomal genes (3.61 compared to 7.80). Those genes belong to the α-takusan family which has been massively amplified in two regions of mouse chromosome 14 (Fig. 8).
Discussion
Based on immunofluorescence data of many studies [19,
22, 24–26, 38, 39, 41], the post-meiotic sex chromatin forms a peculiar structure which appears to accumulate more active and repressive histone marks than auto-somes. These marks are crucial for the regulation of XY gene expression after meiosis and for normal sperm dif-ferentiation; changes in the composition of sex chromatin are associated with deregulation of XY genes, abnormal sperm differentiation and male infertility [34, 42, 43]. Here, we compared the post-meiotic sex chromatin with autosomal chromatin using ChIP-Seq analyses. In par-allel, we studied the dynamics of XY gene expression
during spermatogenesis using RNA-Seq datasets from purified mouse germ cells.
The presence of active marks on the PMSC correlates with expression of many XY‑encoded genes
post‑meiotically
First, we found that, following the global transcrip-tional shut down of XY gene expression during meio-sis, chromatin marks associated with open chromatin and gene expression (i.e., H3K4me3 and Kcr) cover the sex chromosomes in the same way as they cover auto-somes. This contrasts with immunofluorescence data in which H3K4me3 and Kcr signals appear more intense on the PMSC than on the rest of the nucleus [22, 39,
40] (and personal observations). A similar discrepancy
has previously been reported by Dai and colleagues for H4K8_hib and H4K8_ac; indeed, these marks appear enriched on the post-meiotic X and Y chromosomes by immunofluorescence, but their coverage of the X chro-mosome (obtained by ChIP-Seq) is poor compared to that of autosomes [41]. The authors hypothesized that the X chromosome regions covered by these marks could be particularly accessible to antibodies. Discrepancy between IF and ChIP-Seq may also be explained by the fact that sex chromatin is denser than autosomal chro-matin (as suggested by DAPI staining); therefore, sex chromatin immunofluorescence signal accumulates in a smaller, denser region than for autosomes, and appears to be brighter. A similar artifact has been unraveled by Perche and colleagues, who have demonstrated that
Fig. 6 Sex chromosomes and chromosome 14 are enriched in genes expressed after meiosis. a Proportion of round spermatid (RS) enriched genes and round spermatid (RS)-specific genes for the sex chromosomes (X and Y), five representative chromosomes (chromosomes 3, 6, 14, 16 and 18) and all autosomes. The proportion of round spermatid-enriched genes and round spermatid-specific genes is significantly higher for the sex chromosomes and chromosome 14 than for the other autosomes. The level of statistical significance is marked with one asterisk (*) if p < 0.05, two (**) if p<0.01.(*) and three (***) if p<0.001. b RPKM mean values of round spermatid-enriched genes and specific genes for sex chromosomes (X and Y), five representative chromosomes (chromosomes 3, 6, 14, 16 and 18) and all autosomes. Round spermatid-specific genes encoded by the sex chromosomes display significantly lower values than autosomes. The values are indicated in the table. c Distribution of RPKM values of round spermatid-enriched genes and round spermatid-specific genes. The X-axis represents categories of RPKM range of values (0–2, 2–4, 4–6, etc.), and the Y-axis, the percentage of genes in each category. X-linked genes expression values are indicated in pink, Y-linked genes expression values are in
macro-H2A enrichment on the inactive X of female somatic cells was in fact due to a higher density in nucle-osomes [49]. One should nevertheless keep in mind that, in contrary to immunofluorescence experiments, ChIP-Seq analyses are performed on a pool of round spermatids from step 1 to step 8 and may mask/aver-age differences between spermatids at different steps of spermiogenesis. Besides, it is worth noting that inde-pendently of the width of their genome coverage, active chromatin marks such as H3K4me3, H2A.B3, Kcr and H4K8_hib are enriched at the TSS of X-encoded and autosomal genes expressed post-meiotically [38, 39, 41] (and personal observations).
Since the sex chromosomes appear to accumulate active chromatin marks in the same way as autosomes after meiosis, we investigated expression of XY genes at that stage. Several studies have concluded that the X chromosome is still under the influence of MSCI after meiosis since they observed that only a small number
of genes are expressed from the X chromosome in post-meiotic cells [25, 50, 51]. These studies were based on microarray analyses and either ignored multicopy genes or considered all genes of the same family (all cop-ies of the same gene) as one gene. Here, using param-eters allowing interpretation of multicopy genes, we found that the X chromosome is not depleted in genes expressed post-meiotically. Au contraire, a high number of X genes are expressed after meiosis; the X chromo-some even encompasses a higher proportion of genes which are upregulated in round spermatids than auto-somes. Also a higher proportion of genes with sperma-tid-specific expression (de novo expressed genes, i.e., first expressed at the spermatid stage) was found on the X than on autosomes. Our data are in line with results obtained by [37] which showed that the mouse X chro-mosome encodes 273 genes (which belongs to 33 mul-ticopy gene families) with predominant expression after meiosis.
To the best of our knowledge, no thorough description of the dynamics of mouse Y gene expression during sper-matogenesis has been performed so far. This is probably due to the peculiar structure of the mouse Y chromo-some (composed of ampliconic euchromatin for >95% of its sequence [8]) and to the fact that most studies used the previous version of the mouse genome (mm9) which is incomplete in terms of Y chromosome sequence. Here, we found that the vast majority of Y-encoded expressed genes are exclusively expressed after meiosis (~83% of expressed genes compared to ~11% for chromosome 16), but with very low expression values. This reflects the presence of 2 gene families (Sly and Ssty) represent-ing more than 400 genes in total [8], and which are exclu-sively expressed in spermatids [52, 53].
It is important to note that the threshold value above which a gene is considered as expressed is a critical parameter. For the present study, this value was calcu-lated using a method comparing expression levels of exons and intergenic regions, previously described in Ramsköld et al. [48], and which is lower than the one chosen in other studies such as in [54]. In spite of that, many Y- and X-encoded ampliconic genes which belong to families of genes specifically expressed after meiosis had expression values below that threshold and were con-sidered as silent (~2/3rd of all Y-linked genes). Since the conservation between ampliconic genes of the same fam-ily sometimes reaches 99%, it is impossible to precisely determine which gene members are transcribed and which are not. Soh et al. have estimated transcription of Y ampliconic gene families in whole testicular RNA-Seq
datasets based on the search of sequence variants that distinguish individual members of each gene family. Out of the 432 genes and 366 pseudogenes of Sly/Ssty fami-lies they could infer, they found evidence of transcription of at least 25% of them (n = 208). Transcription of Srsy
genes was too low to be confidently confirmed [8]. These results are in agreement with those found in our analysis, since we found ~300 Y-encoded genes which are specifi-cally expressed after meiosis.
Specific features of the PMSC
ChIP-Seq analyses revealed that the sex chromatin bears a signature different from that of autosomal chromatin, characterized by enrichment in H3K9me3 and depletion in histone H4 acetylation, H3K27me3 and 5-hydroxy-methylcytosine. These results are in agreement with previous studies in which H3K9me3 enrichment and H3K27me3 depletion have been observed on the sex chromatin during and after meiosis, by immunofluores-cence [19, 22, 25].
Repressive chromatin marks H3K9me3 and H3K27me3 are considered to be mutually exclusive [55]. H3K27me3 is usually present at gene-rich regions, while H3K9me3 has been shown to localize to regions with tandem repeats (i.e., centromeres, telomeres and long terminal repeats) but is also found at unique sites, near satellite repeats or long terminal repeats [56]. Here, we found H3K9me3 is more present on the sex chromosomes than on autosomes (with H3K9me3 coverage of the sex chro-mosomes representing ~40% of H3K9me3 entire genome coverage) and, in comparison, covers more of the Y than
of the X chromosome. Despite its highly ampliconic structure, the mouse Y content is similar in interspersed-repeat to mouse autosomes and is rather gene dense. Since more than 95% of its sequence is made of ampli-conic euchromatin [8], heterochromatinization of the Y cannot account for H3K9me3 enrichment. A lysine resi-due cannot be both methylated and acetylated; yet, no major depletion in H3K9ac was observed on the post-meiotic sex chromatin, but this is not surprising since H3K9ac is located at the transcription start sites (TSS) of active genes, while H3K9me3 is reduced at TSS and maps to intergenic regions [57, 58].
Analysis of ChIP-Seq data also revealed that PMSC is depleted in acetylated histone H4 and in acetylated his-tone globally. Depletion in acetylated hishis-tone H4 had been observed on sex chromosomes during meiosis [19] and, recently, Goudarzi et al. have reported the deple-tion of the X chromosome in acetylated and butyrylated histone H4 residues during and after meiosis [59]. Since two recent studies have shown that BET bromodomain proteins (such as BRDT and BRD4) which are involved in transcriptional activation and chromatin remodeling dur-ing spermatogenesis, can bind to acetylated histone H4 lysine residues but not to butyrylated or crotonylated res-idues [59, 60], it is clear that the expression of sex chro-mosome-encoded genes is controlled (at least in part) by distinct pathway(s) than that of autosomal genes, in post-meiotic cells. Besides, histone H4 hyper acetylation and BET bromodomain proteins have been shown to be essential for the chromatin remodeling events which ulti-mately lead to the replacement of histones by protamines during spermatid elongation [61]. Histone H4 hyper acetylation starts a few days after the round spermatid stage, in elongating spermatids. To date, this process has only been studied globally, but it would be interesting to investigate whether the dynamics of histone acetylation and removal in elongating spermatids is different for the sex chromosomes compared to other chromosomes.
Finally, genome mapping of 5-hydroxymethylcyto-sine had previously shown that this DNA modification is less present on the post-meiotic X chromosome than on autosomes [47]; our study confirmed this observa-tion and showed that the Y chromosome is also devoid of 5hMC.
Distinct feature between the X and Y chromosomes
H3K27 residue can either be acetylated or methyl-ated, and both modifications are enriched at the TSS. Our analyses showed that the Y chromosome, while devoid of H3K27me3, is enriched in H3K27ac. Since H3K27ac marks the TSS and enhancers of active genes [62], enrichment of H3K27ac on the Y may be correlated with the fact that many Y chromosome-encoded genes
are expressed post-meiotically. Despite the presence of many spermatid-expressed genes on the X chromosome, we did not observe a particular enrichment of H3K27ac compared to autosomes suggesting that X and Y some gene regulation may differ. The X and Y chromo-somes, while sharing specific features, bear significant differences and may be considered individually rather than as a whole. Using a similar approach, it would be interesting to look at the X and Y chromatin composi-tion in other cell types, germinal and somatic, as well as in other organisms.
Dynamic of XY gene expression during spermatogenesis
Our analysis provides a comparison of XY gene expres-sion and autosomal gene expresexpres-sion throughout sper-matogenesis. Based on those data, we can conclude that, before meiosis, a similar proportion of genes is expressed from the X chromosome and from autosomes, while only a few (30) Y genes are expressed. At the pachytene stage of meiosis, as a consequence of MSCI, a large majority of X and Y genes (76.05 and 90%) can be considered as repressed (i.e., at least twofold downregulated in pachy-tene spermatocytes compared to spermatogonial B cells), compared to ~40% of autosomal genes.
Interestingly, most genes (whether autosomal or sex chromosome-encoded) which are expressed in sper-matogonia and repressed in spermatocytes are not “reac-tivated” after meiosis, suggesting very distinct genetic programs between the spermatogonia stage and the meiotic/post-meiotic phase. This is in agreement with results obtained in recent transcriptomic studies which described a switch in global gene expression at the ini-tiation of pachynema [50, 54]. After meiosis, despite the fact that the transcription of some genes with spermatid-specific function starts in spermatocytes [54], there is still a substantial number of genes of which expression is enriched in spermatids or even spermatid specific; the sex chromosomes and chromosome 14 are particularly enriched in those genes compared to autosomes.
Portions of chromosome 14 may be under similar evolutionary constraints than the sex chromosomes
the α-takusan genes are specifically expressed after meio-sis, are enriched in H3K9me3 and have been massively amplified in the mouse lineage, with ~277 genes found in total. Those are features shared with the sex chromo-some-encoded genes, Slx/Sly and Spin/Ssty gene families [32, 35, 53, 64] which have been shown to be involved in the X versus Y chromosome post-meiotic intragenomic conflict (also known as sex chromosome drive). At the basis of this phenomenon is the presence of (a) selfish gene(s) (or transmission distorter) on the X chromosome which favors its own transmission when not balanced.
Slx and Sly have been shown to be regulators of this pro-cess via their opposite effects on gene expression [45]. The involvement of α-takusan genes in this phenomenon remains to be determined, but our results suggest that they are under similar evolutionary constraints than Slx/ Sly and Spin/Ssty gene families. X chromosome drivers are thought to prompt the development of a resistant Y chromosome and of autosomal suppressors (see [65] for a recent review). It is therefore tempting to speculate that the α-takusan gene family could act as a potential auto-somal suppressor of the intragenomic conflict between
Slx and Sly gene families. Investigations on the α-takusan
genes during spermiogenesis will surely shed light on the mechanism(s) underlying this intragenomic conflict.
Is H3K9me3 enrichment on the PMSC a consequence of MSCI or of the competition between the sex chromosomes?
It is intriguing that portions of chromosome 14 which a priori are not submitted to MSCI are enriched in H3K9me3. In that respect, α-takusan genes are prob-ably not the only autosomal genes with this chromatin feature associated with gene amplification, but maybe the most striking example of autosomal gene amplifi-cation. As such, the Speer gene family located on chro-mosome 5 is another example of autosomal ampliconic spermatid-specific genes [45, 66, 67] but less numer-ous than α-takusan genes; it also appears enriched in H3K9me3 (Fig. 7). This might represent the first evidence that H3K9me3 enrichment on the PMSC is due to the post-meiotic intragenomic conflict rather than to MSCI. To address this question, it will be required to determine whether H3K9me3 enrichment on gene-rich portions of chromosome 14 and chromosome 5 is established in spermatocytes or in spermatids.
Whether or not H3K9me3 enrichment is initiated at meiosis or later, it does not prevent XY gene exsion in spermatids. Our data suggest that the pres-ence of active chromatin marks, such as H3K4me3, Kcr, H3K9ac and, particularly for the Y, H3K27ac at the TSS of the genes located in an H3K9me3-rich repressive
environment is sufficient to ensure transcription by the RNA-Pol II enzyme (Fig. 7).
Conclusion
In mouse post-meiotic cells, the composition of sex chro-matin significantly differs from that of autosomes, such as its enrichment in H3K9me3. The sex chromosomes also contain a higher proportion of genes expressed at their highest after meiosis, though often with lower expres-sion values than autosomal genes. We propose that these features are consequences of the post-meiotic X versus Y intragenomic conflict rather than a consequence of a repressive chromatin environment inherited from the meiotic silencing of sex chromosomes. In other species than the mouse, such as in the cattle and domestic pig [7,
68, 69] sex chromosomes encode clusters of ampliconic genes, it would therefore be interesting to investigate their PMSC composition and dynamics of gene expres-sion during spermatogenesis.
Methods
ChIP‑Seq analyses
Round spermatids ChIP-Seq datasets from [39, 41, 57,
70, 71] were analyzed as follows. Only those with a high number of reads and a good FastQC report were con-sidered. All samples and input were single end and were aligned using Heng Li Burros-Wheeler aligner BWA [72] version 0.7.5a-r405 with “mem” command against last mouse genome release mm10 (see Additional file 12). By default with BWA, reads which do not map uniquely on the genome are distributed to one location picked randomly. Briefly, BWA-MEM algorithm works by seed-ing alignments with maximal exact matches (MEMs) and then extending seeds with the affine-gap Smith-Waterman algorithm (SW). In case of multiple primary alignments, -c INT discards a MEM if it has more than INT occurrence in the genome. The maximum is set to 10,000. Peaks were then called with MACS [73] v1.4 using default parameters (p value cut off for peak detec-tion = 1e−05; mfold parameters = 10.32), cf. Additional
file 12. Decreasing the mfold parameters values did not change the interpretation of ChIP-Seq data. Analyses were partly performed using Mississippi Galaxy Web site
https://mississippi.snv.jussieu.fr/.
Expression analyses
RNA-Seq datasets from [47] (GSE35005) were analyzed by GenoSplice (http://www.genosplice.com) using the following parameters: Reads were aligned using STAR 2.4.2a [75] on Mouse Genome version GRCm38 (see also Additional file 12). All genes (including pseudogenes) were taken into account. Gene counts were computed using featureCounts from the Subread package ver-sion 1.4.6-p5 [76]. RPKM values were computed from Subread results. Ensembl 81 was used for gene annota-tion. Reads which mapped at different locations were assigned to the location with the best score or to one location picked randomly by the program (option-M, see line commands in Additional file 12). The limit is set to 10 (i.e., reads which mapped to 10 or more locations with a similar score were excluded; this represents less than 0.5% of all reads, cf. Additional file 12). The thresh-old RPKM value above which a gene was considered as expressed was calculated by comparing the expression levels of exons and intergenic regions (i.e., intersection of density plots), as previously described in Ramsköld et al, see Additional file 13 [48]. Individual threshold RPKM values vary among datasets from 0.15 to 0.27, yielding to an average threshold RPKM value of 0.22. Genes de novo expressed are genes found to be expressed (RPKM > 0.22) at one particular stage (pachytene stage or in round sper-matids) and not before. Pachytene-repressed genes are genes that are at least twofold downregulated compared to their RPKM value in spermatogonial B cells. Round spermatids non-reactivated genes are genes defined as repressed in pachytene stage (see above) which do not recover at least half of their spermagonia B RPKM value in round spermatids. Genes enriched in round sperma-tids are genes that are at least twofold upregulated com-pared to their RPKM value in pachytene spermatocytes. To visualize the distribution of RPKM values, Excel com-plementary module “Analysis ToolPak” was used to cat-egorize genes according to their RPKM values (0–2, 2–4, 4–6, etc.).
Annotation of the genome
Genome Decoration Page (http://www.ncbi.nlm.nih.gov/ genome/tools/gdp/) was used to produce graphic repre-sentation of round spermatid-specific genes, Speer genes, H3K9me3 and RNA-Pol II genomic locations on chro-mosomes 3, 5, 6, 10, 14, 16, 18, X and Y.
Immunofluorescence
Immunofluorescence experiments were performed on round spermatids following a protocol adapted from Barlow et al. [77] and previously described in [34]. Anti-H3K9me3 (Millipore) and anti-H3K27ac (active
motif) were used at 1/200. Animal procedures were subjected to local ethical review (Comite d’Ethique pour l’Experimentation Animale, Universite Paris Descartes; registration number CEEA34.JC.114.12).
Ensembl analysis
Ensembl BLAST Web site (http://www.ensembl.org/ Multi/Tools/Blast) was used to search for genes related to takusan gene family. Using several gene accession IDs as queries, a total of 277 related genes (with >50% iden-tity) were found; all mapped to chromosome 14. The analysis in which highly similar gene family members of the X and Y chromosome were treated as a single gene (Additional file 9) was performed as follows: Ensembl Biomart Web site (http://www.ensembl.org/biomart) was used to search for highly similar genes (with >80% identity) on the X and Y chromosomes. For the X chro-mosome, combination of the gene ID of identified members of multicopy gene families and the RNA-Seq data was used to analyze and collapse highly related genes into one single gene ID. For the Y chromosome, the multicopy gene-collapsed analysis was based on Soh et al. data and combined with the RNA-Seq data.
Statistics
Analyses of chromatin marks coverage were performed by determining the 95% confidence interval (see Addi-tional file 1). To compare the number of genes (based on their expression status) encoded by the sex chromo-somes, chromosome 14 and representative autochromo-somes, we performed Chi-square tests (see Additional files 5, 7
and 8). To compare distribution of RPKM values, Mann and Whitney tests were performed (see Additional files
6 and 9).
Additional files
Additional file 1. Table showing individual chromosome coverage (reported to total chromosome length) of 9 histone PTM (i.e., H3K4me3, Kcr, H3K9ac, H4K8_hib, H4ac, K_acetylation, H3K9me3, H3K27ac, H3K27me3) and 5-hydroxymethylcytosine in round spermatids. Values are indicated for the sex chromosomes, chromosome 14 and representa-tive autosomes. The mean coverage values, standard deviation (SD) and boundaries (maximum and minimum) values of the 95% confidence interval (CI) are reported underneath. Those values were calculated based on data collected from all chromosomes or from only autosomes (i.e., excluding values for the X and Y chromosomes). Values which are outside the 95% CI calculated for all chromosomes are represented in italic; values which are outside the 95% CI calculated for “only autosomes” are repre-sented in bold and underscored.
Abbreviations
ChIP Seq: chromatin immunoprecipitation followed by high-throughput sequencing; H3K4me3: trimethylation of lysine 4 on histone H3; H3K9ac: acety-lation of lysine 9 on histone H3; H3K9me3: trimethyacety-lation of lysine 9 on histone H3; H3K27ac: acetylation of lysine 27 on histone H3; H3K27me3: trimethylation of lysine 27 on histone H3; H4ac: acetylation of histone H4; H4K8_ac: acetyla-tion of lysine 8 on histone H4; H4K8_hib: 2-hydroxyisobutyrylaacetyla-tion of lysine 8 on histone H4; K_acetylation: lysine acetylation; Kcr: lysine crotonylation; MSCI: meiotic sex chromosome inactivation; MSY: male-specific region of the Y chromosome; PMSC: post-meiotic sex chromatin, i.e., the X and Y chromatin in spermatids; PS: pachytene spermatocytes; PTM: posttranslational modifications; RPKM: reads per kilobase of transcript per million reads mapped; RNA Seq: high-throughput sequencing of RNA; RS: round spermatids; SB: spermatogonia B; TSS: transcription start site; uH2A: monoubiquitinated histone H2A.
Authors’ contributions
JC and CM designed the study and prepared the manuscript. FT and JC devel-oped the workflow to analyze ChIP-Seq data. CM analyzed RNA-Seq data. JC performed immunofluorescence experiments. DV provided experimental and statistical guidance. All authors read and approved the final manuscript.
Author details
1 Institut National de la Sante et de la Recherche Medicale (INSERM) U1016, Institut Cochin, Paris, France. 2 Centre National de la Recherche Scientifique (CNRS), UMR8104, Paris, France. 3 Faculté de Médecine, Université Paris Descartes, Sorbonne Paris Cité, Paris, France. 4 INSERM U1163, Université Paris Descartes, Sorbonne Paris Cité, Institut Imagine, 24 Boulevard du Montpar-nasse, 75015 Paris, France.
Acknowledgements
The authors wish to thank James Turner for critical reading of the manuscript, Sophie Rousseaux and Saadi Khochbin for sharing H4K8_hib ChIP-Seq data and for helpful discussions, and Christophe Antoniewski from the ARTbio bioinformatics analysis facility (Sorbonne Universités, UPMC Université, CNRS, Institut de Biologie Paris Seine) for help with Mississippi Galaxy Web site. The authors also thank the Histology, Immunostaining and Laser Microdissec-tion Facility, and the Cellular Imaging Facility of the Cochin Institute (INSERM U1016, CNRS UMR8104, Université Paris Descartes).
Competing interests
The authors declare that they have no competing interests.
Ethical approval and consent to participate
Animal procedures were subjected to local ethical review (Comite d’Ethique pour l’Experimentation Animale, Universite Paris Descartes; registration number CEEA34.JC.114.12).
Funding
This work was supported by Inserm (Institut National de la Sante et de la Recherche Medicale), Cnrs (Centre National de la Recherche Scientifique), Université Paris Descartes, the Agence Nationale de la Recherche program ANR-12–JSV2-0005–01 (to J.C.) and a Marie Curie fellowship FP7-PEOPLE-2010-IEF-273143 (to J.C.). The funding bodies did not have any role in the design of the study, the collection, analysis, and interpretation of data nor in the writing of the manuscript.
Received: 13 July 2016 Accepted: 17 October 2016
Additional file 3. Graphic representation of the ChIP-Seq profiles of H3K9me3, H3K27ac, H3K27me3, H4ac, H3K4me3 and Kcr over the sex chromosomes (X and Y) and two representative autosomes (chromosome 3 and chromosome 18) using IGV (Integrative Genomic Viewer). RefSeq genes are indicated underneath.
Additional file 4. Extended panel from Fig. 3. Immunofluorescence detection of H3K27ac (red) in round spermatid nuclei. DAPI (blue) was used to stain nuclei. The most DAPI-dense round region is the chro-mocenter (i.e., the constitutive pericentromeric heterochromatin) the less DAPI-dense structure adjacent to the chromocenter is the post-meiotic sex chromatin (PMSC) and is indicated by an arrow. Anti-H3K9me3 (in green) marks the chromocenter and the PMSC in wild type (WT) round spermatids. Two types of staining were observed: either a brighter signal co-localizing with the PMSC (top panel, n= 28/55), or a diffuse bright sig-nal in the nucleus (middle panel, n=27/55). As control, round spermatids with a large deletion of the Y chromosome (MSYq-) were used (bottom panel). The vast majority of MSYq- round spermatids analyzed (59/65) did not display any enrichment of H3K27ac on the PMSC, indicating that in WT spermatids only the Y and not the X is enriched n H3K27ac. Additional file 5. Tables presenting the results of Chi-square tests per-formed on the number of X- or Y-encoded expressed genes compared to autosomal expressed genes throughout spermatogenesis.
Additional file 6. Graphic representation of the mean rank values obtained with Mann and Whitney tests and tables presenting the results of Mann and Whitney tests performed on the RPKM values of X- and Y-encoded genes compared to that of autosomal genes in spermatogo-nia B (SB), pachytene spermatocytes (PS) and round spermatids (RS). P indicates the obtained p value (*, p < 0.05; **, p < 0.01; p < 0.001). Additional file 7. Tables presenting the results of Chi-square tests performed on the number of pachytene (PS) repressed genes and PS repressed genes that are not reactivated in round spermatids (RS) for the X and Y chromosomes compared to representative autosomes. Additional file 8. Tables presenting the results of Chi-square tests per-formed on the number of genes enriched in round spermatids (RS) and on the number of RS-specific genes for the X and Y chromosomes and chromosome 14 compared to representative autosomes.
Additional file 9. Analysis of single-copy genes and collapsed multicopy gene family of the sex chromosome. a Table presenting the number of X-encoded single-copy genes and multicopy gene family expressed throughout spermatogenesis, enriched in round spermatids (RS) or round spermatids (RS) specific. A Chi-square test has been performed on the number of genes expressed at each stage, genes enriched in RS or RS-spe-cific genes for the X chromosome compared to representative autosomes.
b Table presenting the number of Y-encoded single-copy genes and multicopy gene family expressed throughout spermatogenesis, enriched in round spermatids (RS) or round spermatids (RS) specific. A Chi-square test has been performed on the number of genes expressed at each stage, genes enriched in RS or RS-specific genes for the Y chromosome compared to representative autosomes. c Tables presenting the RPKM mean and RPKM sum of the Y-linked multicopy gene family expressed in round spermatids (RS).
Additional file 10. Graphic representation of the mean rank values obtained with Mann and Whitney tests and tables presenting the results of Mann and Whitney tests performed on the RPKM values of enriched genes in round spermatids (RS) and round spermatid (RS)-specific genes on the X and Y chromosomes compared to that of representative auto-somes. P indicates the obtained p value (*, p < 0.05; **, p < 0.01; p < 0.001). Additional file 11. List of the round spermatid-specific genes of the chromosome 14.
Additional file 12. Detailed protocol and information regarding the RNA-Seq and ChIP-Seq analysis.
Additional file 13.a RPKM threshold determination. Reads were mapped to Ensembl Genes (in blue) and to intergenic regions (in red). By comparing the expression levels of exons and intergenic regions, the intersection of the density plots was used to determine the threshold
References
1. Ellegren H. Sex-chromosome evolution: recent progress and the influence of male and female heterogamety. Nat Rev Genet. 2011;12(3):157–66. 2. Bellott DW, Hughes JF, Skaletsky H, Brown LG, Pyntikova T, Cho TJ,
Koutseva N, Zaghlul S, Graves T, Rock S, et al. Mammalian Y chromo-somes retain widely expressed dosage-sensitive regulators. Nature. 2014;508(7497):494–9.
3. Mueller JL, Skaletsky H, Brown LG, Zaghlul S, Rock S, Graves T, Auger K, Warren WC, Wilson RK, Page DC. Independent specialization of the human and mouse X chromosomes for the male germ line. Nat Genet. 2013;45(9):1083–7.
4. Cortez D, Marin R, Toledo-Flores D, Froidevaux L, Liechti A, Waters PD, Grutzner F, Kaessmann H. Origins and functional evolution of Y chromo-somes across mammals. Nature. 2014;508(7497):488–93.
5. Deng X, Berletch JB, Nguyen DK, Disteche CM. X chromosome regulation: diverse patterns in development, tissues and disease. Nat Rev Genet. 2014;15(6):367–78.
6. Rice W. Sexually antagonistic genes: experimental evidence. Science. 1992;256:1436–9.
7. Li G, Davis BW, Raudsepp T, Pearks Wilkerson AJ, Mason VC, Ferguson-Smith M, O’Brien PC, Waters PD, Murphy WJ. Comparative analysis of mammalian Y chromosomes illuminates ancestral structure and lineage-specific evolution. Genome Res. 2013;23(9):1486–95.
8. Soh YQ, Alfoldi J, Pyntikova T, Brown LG, Graves T, Minx PJ, Fulton RS, Kremitzki C, Koutseva N, Mueller JL, et al. Sequencing the mouse Y chro-mosome reveals convergent gene acquisition and amplification on both sex chromosomes. Cell. 2014;159(4):800–13.
9. Turner JM. Meiotic sex chromosome inactivation. Development (Cam-bridge, England). 2007;134(10):1823–31.
10. van der Heijden GW, Eijpe M, Baarends WM. The X and Y chromosome in meiosis: how and why they keep silent. Asian J Androl. 2011;13(6):779–80. 11. Turner JM. Meiotic silencing in mammals. Annu Rev Genet.
2015;49:395–412.
12. Checchi PM, Engebrecht J. Heteromorphic sex chromosomes: navigating meiosis without a homologous partner. Mol Reprod Dev. 2011;78(9):623–32.
13. Wang PJ, McCarrey JR, Yang F, Page DC. An abundance of X-linked genes expressed in spermatogonia. Nat Genet. 2001;27(4):422–6.
14. Zhang YE, Vibranovski MD, Landback P, Marais GA, Long M. Chromo-somal redistribution of male-biased genes in mammalian evolution with two bursts of gene gain on the X chromosome. PLoS Biol 2010;8(10). pii:e1000494.
15. Ichijima Y, Ichijima M, Lou Z, Nussenzweig A, Camerini-Otero RD, Chen J, Andreassen PR, Namekawa SH. MDC1 directs chromosome-wide silencing of the sex chromosomes in male germ cells. Genes Dev. 2011;25(9):959–71.
16. Royo H, Prosser H, Ruzankina Y, Mahadevaiah SK, Cloutier JM, Baumann M, Fukuda T, Hoog C, Toth A, de Rooij DG, et al. ATR acts stage specifically to regulate multiple aspects of mammalian meiotic silencing. Genes Dev. 2013;27(13):1484–94.
17. Baarends WM, Hoogerbrugge JW, Roest HP, Oooms M, Vreeburg J, Hoeijmakers JHJ, Grootegoed JA. Histone ubiquitination and chromatin remodeling in mouse spermatogenesis. Dev Biol. 1999;207:322–33. 18. Baarends WM, Wassenaar E, van der Laan R, Hoogerbrugge J,
Sleddens-Linkels E, Hoeijmakers JH, de Boer P, Grootegoed JA. Silencing of unpaired chromatin and histone H2A ubiquitination in mammalian meiosis. Mol Cell Biol. 2005;25(3):1041–53.
19. Khalil AM, Boyar FZ, Driscoll DJ. Dynamic histone modifications mark sex chromosome inactivation and reactivation during mammalian spermato-genesis. Proc Natl Acad Sci USA. 2004;101(47):16583–7.
20. Cowell IG, Aucott R, Mahadevaiah SK, Burgoyne PS, Huskisson N, Bon-giorni S, Prantera G, Fanti L, Pimpinelli S, Wu R, et al. Heterochromatin, HP1 and methylation at lysine 9 of histone H3 in animals. Chromosoma. 2002;111(1):22–36.
21. Motzkus D, Singh PB, Hoyer-Fender S. M31, a murine homolog of Drosophila HP1, is concentrated in the XY body during spermatogenesis. Cytogenet Cell Genet. 1999;86:83–8.
22. van der Heijden GW, Derijck AA, Posfai E, Giele M, Pelczar P, Ramos L, Wansink DG, van der Vlag J, Peters AH, de Boer P. Chromosome-wide nucleosome replacement and H3.3 incorporation during mammalian meiotic sex chromosome inactivation. Nat Genet. 2007;39(2):251–8.
23. Handel MA. The XY body: a specialized meiotic chromatin domain. Exp Cell Res. 2004;296(1):57–63.
24. Greaves IK, Rangasamy D, Devoy M, Marshall Graves JA, Tremethick DJ. The X and Y chromosomes assemble into H2A.Z, containing facultative heterochromatin, following meiosis. Mol Cell Biol. 2006;26(14):5394–405. 25. Namekawa SH, Park PJ, Zhang LF, Shima JE, McCarrey JR, Griswold MD,
Lee JT. Postmeiotic sex chromatin in the male germline of mice. Curr Biol. 2006;16(7):660–7.
26. Turner JM, Mahadevaiah SK, Ellis PJ, Mitchell MJ, Burgoyne PS. Pachytene asynapsis drives meiotic sex chromosome inactivation and leads to substantial postmeiotic repression in spermatids. Dev Cell. 2006;10(4):521–9.
27. Khil PP, Smirnova NA, Romanienko PJ, Camerini-Otero RD. The mouse X chromosome is enriched for sex-biased genes not subject to selection by meiotic sex chromosome inactivation. Nat Genet. 2004;36(6):642–6. 28. Reinke V, Gil IS, Ward S, Kazmer K. Genome-wide germline-enriched and
sex-biased expression profiles in Caenorhabditis elegans. Development (Cambridge, England). 2004;131(2):311–23.
29. Odorisio T, Mahadevaiah SK, McCarrey JR, Burgoyne PS. Transcriptional analysis of the candidate spermatogenesis gene Ube1y and of the closely related Ube1x shows that they are coexpressed in spermatogonia and spermatids but are repressed in pachytene spermatocytes. Dev Biol. 1996;180:336–43.
30. Hendriksen PJM, Hoogerbrugge JW, Themmen APN, Koken MHM, Hoeijmakers JHJ, Oostra BA, van der Lende T, Grootegoed JA. Postmeiotic transcription of X and Y chromosomal genes during spermatogenesis in the mouse. Dev Biol. 1995;170:730–3.
31. Wang PJ, Page DC, McCarrey JR. Differential expression of sex-linked and autosomal germ-cell-specific genes during spermatogenesis in the mouse. Hum Mol Genet. 2005;14(19):2911–8.
32. Reynard LN, Turner JM, Cocquet J, Mahadevaiah SK, Toure A, Hoog C, Bur-goyne PS. Expression analysis of the mouse multi-copy X-linked gene Xlr-related, meiosis-regulated (Xmr), reveals that Xmr encodes a spermatid-expressed cytoplasmic protein, Biol Reprod. 2007;77(2):329–35. 33. Reynard LN, Cocquet J, Burgoyne PS. The multi-copy mouse gene
Sycp3-like Y-linked (Sly) encodes an abundant spermatid protein that interacts with a histone acetyltransferase and an acrosomal protein. Biol Reprod. 2009;81(2):250–7.
34. Cocquet J, Ellis PJ, Yamauchi Y, Mahadevaiah SK, Affara NA, Ward MA, Burgoyne PS. The multicopy gene Sly represses the sex chro-mosomes in the male mouse germline after meiosis. PLoS Biol. 2009;7(11):e1000244.
35. Cocquet J, Ellis PJ, Yamauchi Y, Riel JM, Karacs TP, Rattigan A, Ojarikre OA, Affara NA, Ward MA, Burgoyne PS. Deficiency in the multicopy Sycp3-like X-linked genes Slx and Slxl1 causes major defects in spermatid differen-tiation. Mol Biol Cell. 2010;21(20):3497–505.
36. Yang F, Skaletsky H, Wang PJ. Ubl4b, an X-derived retrogene, is specifically expressed in post-meiotic germ cells in mammals. Gene Expr Patterns. 2007;7(1–2):131–6.
37. Mueller JL, Mahadevaiah SK, Park PJ, Warburton PE, Page DC, Turner JM. The mouse X chromosome is enriched for multicopy testis genes show-ing postmeiotic expression. Nat Genet. 2008;40(6):794–9.
38. Soboleva TA, Nekrasov M, Pahwa A, Williams R, Huttley GA, Tremethick DJ. A unique H2A histone variant occupies the transcriptional start site of active genes. Nat Struct Mol Biol. 2011;19(1):25–30.
39. Tan M, Luo H, Lee S, Jin F, Yang JS, Montellier E, Buchou T, Cheng Z, Rousseaux S, Rajagopal N, et al. Identification of 67 histone marks and histone lysine crotonylation as a new type of histone modification. Cell. 2011;146(6):1016–28.
40. Montellier E, Rousseaux S, Zhao Y, Khochbin S. Histone crotonylation specifically marks the haploid male germ cell gene expression program: Post-meiotic male-specific gene expression. Bioessays. 2011;34(3):187–93. 41. Dai L, Peng C, Montellier E, Lu Z, Chen Y, Ishii H, Debernardi A, Buchou
T, Rousseaux S, Jin F, et al. Lysine 2-hydroxyisobutyrylation is a widely distributed active histone mark. Nat Chem Biol. 2014;10(5):365–70. 42. Baarends WM, Wassenaar E, Hoogerbrugge JW, Schoenmakers S, Sun
ZW, Grootegoed JA. Increased phosphorylation and dimethylation of XY body histones in the Hr6b-knockout mouse is associated with derepres-sion of the X chromosome. J Cell Sci. 2007;120(Pt 11):1841–51. 43. Sin HS, Barski A, Zhang F, Kartashov AV, Nussenzweig A, Chen J,