An Analysis of Temporal Rainfall Variability in Argungu Area over the
Last Half Climatic Year (1995-2012):
Implication on Rainfed Crop Production
Usman Lawal Gulma
Department Of Geography, Adamu Augie College of Education Argungu, Kebbi State, Nigeria
Doi:10.5901/ajis.2013.v2n12p117
Abstract
This paper analyzes rainfall variability in Argungu area. Data for half climatic year 1995-2012 were obtained from Argungu station of Kebbi Agriculture and Rural Development Authority. Analysis of variance (ANOVA) was used to analyze the data. The results show that there is statistically significant difference in annual rainfall over the years. Analysis further revealed that the month of August, 2010 has the highest rainfall amount of 1066mm with the year 1996 receiving the least annual rainfall amount within the period under study respectively. The study recommends that since annual rainfall in the area is characterized by fluctuations, irrigation agriculture should be developed and supported by government to compliment rain-fed agriculture to encourage crop production in the area.
Keywords: Rainfall, Variability, Significant, Analysis, Rain-fed
1. Introduction
Rainfall is an important aspect in both climatic and geomorphic studies. The amount of rainfall in a given region is influenced by many factors among them relief, wind speed and direction (relative to coastal orientation) and distance from the ocean. For instance when humid air masses moving across a region are forced to rise over highlands/plateau tends to bring heavy rainfall (Ayoade, 1988 in Yusuf et al, 2012).
Rainfall variability which is the degree to which rainfall amounts vary across an area or through time is an important characteristic of the climate of an area. There are two types of rainfall variability; areal (spatial) and temporal. The study of the latter is important in understanding climate change. Areal variability is the variation of rainfall amounts at various locations across a region for a specific time interval while temporal variability is the amounts at a given location across a time interval. Both temporal and areal variability of precipitation may be measured in various ways. The resulting numerical value can be used to characterize the climate of a region and to deduce evidence of climate change.
According to Food and Agriculture Organization (FAO, 2002), rainfall variability from years to days is as much a characteristic of climate as the total amounts recorded. Low values, however, do not necessarily lead to drought, nor is drought necessarily associated with rainfall. Agricultural droughts occur when water supply is insufficient to cover crop or livestock water requirements. In addition to reduced rainfall, a number of factors may lead to agricultural drought some of them not always obvious (FAO, 2002).
Agricultural productions in the study area suffers from the effects of rainfall variability due to fluctuations, unreliable nature coupled with uneven spread during crop growing periods often resulting in crop failure over past one and half decade. Sometimes, not even the introduction of early maturing seeds could help the situation as in most cases rainfall start late and terminate early.
The aim of this paper therefore is to analyze rainfall variability and impact of such on crop production in Argungu.
2. Data Sources and Method of Analysis
The data used for this study is secondary. Rainfall records of Argungu for eighteen year period (1995-2012) were collected from Kebbi Agricultural and Rural Development Authority zone 1 weather station. Analysis of Variance (ANOVA) was used to analyze monthly rainfall.
2.1 Study Area
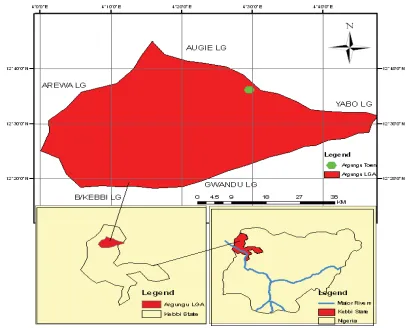
Argungu is located between latitude 12030'33"N to 12040'54"N and longitude 4020'54"E to
4030'54"E covering an area of 428 KM2 and elevation of 241 meters above sea level. It is bounded
by Yabo Local Government area of Sokoto state to the North-East, in the South by Gwandu and Birnin Kebbi Local Government areas, while to the North and West by Augie and Arewa Local Government areas respectively.
The study area enjoys tropical continental type of climate, which is largely controlled by two air masses namely; tropical maritime and tropical continental blowing from Atlantic and Sahara desert respectively. The air masses determined the two dominant seasons, wet and dry. Humidity is 27% while wind blow at 11Km/h in ESE direction.
Argungu receive a mean annual rainfall of 800mm between May to September with a peak period in August, the remaining period of the year is dry. The average temperature is 260C and can
rise up to 400C in the peak of hot season (March-July). However, during harmattan, (December –
February) temperature falls to 210C.
Two groups of soils can be identified in the study area, the upland and Fadama soils. The Fadama consist of two distinct phases: wet and dry season operations. These two soil groups are generally characteristic of Sokoto Rima Basin. While the upland soils are generally sandy and well drained, the Fadama soils are generally clayey and hydromorphic which range from deep well drained soils, loamy sand, sandy loam, clay and clay loam.
Figure 1: Location Map of the Study Area
3. Results and Discussion
The table below represent summarized monthly and annual rainfall data for the 1995-2012 for Argungu station. Maximum, average and minimum figures for monthly and annual rainfall for the area were also computed.
Table 1: Maximum, average and minimum rainfall at Argungu station 1995-2012
Source: Kebbi Agriculture and Rural Development Authority Zone 1
ANNUAL
JAN FEB MAR APR MAY JUN JUL AUG SEP OCT NOV DEC
1995 0 0 0 71 0 129 136 137 49 0 0 0 522
1996 0 0 0 0 70 97 64 95 6 0 0 0 332
1997 0 0 0 4 139 106 160 153 43 4 0 0 609
1998 0 0 0 10 35 114 136 193 167 15 0 0 670
1999 0 0 0 1 68 34 131 258 249 58 0 0 799
2000 0 0 0 0 12 163 371 249 119 30 0 0 944
2001 0 0 0 10 43 102 314 266 95 4 0 0 834
2002 0 0 0 8 16 71 223 229 175 153 0 0 875
2003 0 0 0 2 38 78 234 261 152 14 0 0 779
2004 0 0 0 9 83 28 132 273 55 18 0 0 598
2005 0 0 0 0 26 84 174 148 102 19 0 0 553
2006 0 0 0 0 69 102 171 283 121 44 0 0 790
2007 0 0 0 0 108 52 385 227 127 0 0 0 899
2008 0 0 0 7 103 99 108 188 204 17 0 0 726
2009 0 0 0 0 15 80 77 218 152 51 0 0 593
2010 0 0 0 15 70 155 191 468 96 71 0 0 1066
2011 0 3 0 0 40 144 98 158 146 15 0 0 604
2012 0 8 0 0 44 40 152 188 106 135 0 0 673
MAX 0 8 0 71 139 163 385 468 249 153 0 0 1066
AVG 0 1 0 10.94737 58.84211 96.89474 191.6842 234.7368 127 42.15789 0 0 733.2632
MIN 0 0 0 0 0 28 64 95 6 0 0 0 332
Fig 2: Graph showing maximum, average and minimum Rainfall
The graph above shows the maximum average and monthly trends in rainfall of the study area. Cumulatively, the month of August has the highest maximum of 468mm with average of 235mm and minimum of 95mm respectively over the last eighteen years (1995-2005).
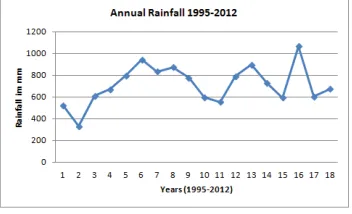
Figure 3: Graph showing annual rainfall 1995-2012
The graph of rainfall analyzed indicated the variability in rainfall trend for eighteen year period 1995-2012 which is characterized by fluctuations. The mean annual rainfall of the area being 800mm shows that at least for ten years, the area has witnessed low rainfall amount with the lowest (332mm) experienced in 1996 which is a drought year. However, the year 2010 received the highest rainfall amount of 1066mm.
Furthermore, at least for ten years within the period, agricultural production experienced low yield because most of the crops grown in the area (millet, sorghum, beans rice and groundnut) requires an average of 500mm-800mm (FAO, 1991)) of rainfall.
Table 2: Showing total sum, average and variance of Rainfall 1995-2012Argungu Station.
SUMMARY Count Sum Average Variance
1995 12 522 43.5 3512.818
1996 12 332 27.66667 1661.879
1997 12 609 50.75 4594.568
1998 12 670 55.83333 5524.697
1999 12 799 66.58333 9242.811
2000 12 944 78.66667 15195.88
2001 12 834 69.5 12071.18
2002 12 875 72.91667 8887.538
2003 12 779 64.91667 9376.265
2004 12 598 49.83333 6659.606
2005 12 553 46.08333 4108.447
2006 12 790 65.83333 8096.697
2007 12 899 74.91667 14809.17
2008 12 726 60.5 5949.909
2009 12 593 49.41667 5134.447
2010 12 1066 88.83333 18565.06
2011 12 604 50.33333 4368.424
Figure 4: Graph showing monthly distribution of highest rainfall amount year 2010 (1066mm)
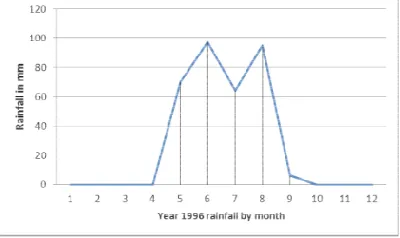
Figure 5: Graph showing monthly distribution of lowest rainfall amount year 1996 (332mm)
Table 3 above indicate that there is a statistically significant difference in annual rainfall amount in Argungu between 1995-2012 since between groups variation is greater than within group variation
4. Conclusion and Recommendations
4.1 Conclusion
The study findings revealed that there is a great variability in rainfall amount in Argungu area. This was furher confirmed by the result of analysis carried out for the period 1995-2012. Fluctuations in rainfall affect crop production in the study area over greater part of the period under study.
Finally, rainfall variability in the area is an indication of climate change being experienced globally for which the study area is not an exception.
4.2 Recommendations
The significance of information on rainfall variability of Argungu area is vital for planning more ANOVA
Source of Variation SS df MS F P-value F crit
Between Groups 1202523.981 11 109320.4 54.26792086 1.6534E-54 1.835818655
Within Groups 410949.1111 204 2014.456
References
Ayoade J.O. (1988) in Yusuf Y.O and Mohammed N.A (2012), An Assesment of Spatial Distribution of Rainfall Amount in Zaria, Kaduna State. Proceedings of 52 Annual Conference of Association of Nigerian Geographers. Usmanu Danfodio University
FAO (2002), Analysis of Rainfall Variability in Sub-Saharan Africa in the 1961-2002 Period. Agrometeorology Working Paper No. 9 Retrieved from http://www.fao.org/nr/climpag/pub.
FAO (1991), Water Requirements of Crops. Natural Resources Management and Environment Department. Retrieved from http://www.fao.org/docrep/U3160E/U3160E00.
Jackson J. (1989), Climate Water and Agriculture in the Tropics. Longman Scientific and Technical New York, USA.
Jawoo K. (2010), Rainfall Variability and Crop Yield Potential. Harvest Choice Labs. Retrieved from http://harvestchoice.org/labs/rainfall-variability-and-crop-yield-potential.
Rukman W; Athur H; Esther T and Kristoff C. (2008), Rainfall Variabilty and its Impact on Dryland Cropping in Victoria. Department on Environment and Primary Industries