Identification of banana fusarium wilt using supervised classification
algorithms with UAV-based multi-spectral imagery
Huichun Ye
1,2,3,
Wenjiang Huang
1,2,3*,
Shanyu Huang
4,
Bei Cui
1,2,3,
Yingying Dong
1,2,
Anting Guo
1,2,5,
Yu Ren
1,2,5,
Yu Jin
6(1. Key Laboratory of Digital Earth Science, Institute of Remote Sensing and Digital Earth, Chinese Academy of Sciences, Beijing 100094, China;
2. Aerospace Information Research Institute, Chinese Academy of Sciences, Beijing 100094, China; 3. Key Laboratory of Earth Observation, Hainan Province, Sanya 572029, China; 4. Chinese Academy of Agricultural Engineering Planning & Design, Beijing 100125, China;
5. University of Chinese Academy of Sciences, Beijing 100049, China;
6. School of Electronics and Information Engineering, Anhui University, Hefei 230601, China)
Abstract: The disease of banana Fusarium wilt currently threatens banana production areas all over the world. Rapid and large-area monitoring of Fusarium wilt disease is very important for the disease treatment and crop planting adjustments. The objective of this study was to evaluate the performance of supervised classification algorithms such as support vector machine (SVM), random forest (RF), and artificial neural network (ANN) algorithms to identify locations that were infested or not infested with Fusarium wilt. An unmanned aerial vehicle (UAV) equipped with a five-band multi-spectral sensor (blue, green, red, red-edge and near-infrared bands) was used to capture the multi-spectral imagery. A total of 139 ground sample-sites were surveyed to assess the occurrence of banana Fusarium wilt. The results showed that the SVM, RF, and ANN algorithms exhibited good performance for identifying and mapping banana Fusarium wilt disease in UAV-based multi-spectral imagery. The overall accuracies of the SVM, RF, and ANN were 91.4%, 90.0%, and 91.1%, respectively for the pixel-based approach. The RF algorithm required significantly less training time than the SVM and ANN algorithms. The maps generated by the SVM, RF, and ANN algorithms showed the areas of occurrence of Fusarium wilt disease were in the range of 5.21-5.75 hm2, accounting for 36.3%-40.1% of the total planting area of bananas in the study area. The results also showed that the inclusion of the red-edge band resulted in an increase in the overall accuracy of 2.9%-3.0%. A simulation of the resolutions of satellite-based imagery (i.e., 0.5 m, 1 m, 2 m, and 5 m resolutions) showed that imagery with a spatial resolution higher than 2 m resulted in good identification accuracy of Fusarium wilt. The results of this study demonstrate that the RF classifier is well suited for the identification and mapping of banana Fusarium wilt disease from UAV-based remote sensing imagery. The results provide guidance for disease treatment and crop planting adjustments.
Keywords: banana fusarium wilt, UAV-based multi-spectral remote sensing, support vector machine, artificial neural network, random forest
DOI: 10.25165/j.ijabe.20201303.5524
Citation: Ye H C, Huang W J, Huang S Y, Cui B, Dong Y Y, Guo A T, et al. Identification of banana fusarium wilt using supervised classification algorithms with UAV-based multi-spectral imagery. Int J Agric & Biol Eng, 2020; 13(3): 136–142.
1 Introduction
Banana (Musa spp.) is the most popular fruit crop and is
Received date: 2019-11-16 Accepted date: 2020-03-16
Biographies:Huichun Ye, PhD, Assistant Research Fellow, research interests:
agricultural remote sensing, Email: [email protected]; Shanyu Huang, PhD, Assistant Research Fellow, research interests: agricultural remote sensing and precision agriculture, Email: [email protected]; Bei Cui, PhD, Assistant Research Fellow, research interests: quantitative remote sensing research on the vegetation, Email: [email protected]; Yingying Dong, PhD, Associate Research Fellow, research interests: remote sensing in agricultural diseases and insect pests, Email: [email protected]; Anting Guo, PhD candidate, research interests: UAV remote sensing application in agriculture, Email: [email protected];
Yu Ren, PhD candidate, research interests: agricultural remote sensing and
precision agriculture, Email: [email protected]; Yu Jin, Master degree candidate, research interests: crop classification and image processing, Email: [email protected].
*Corresponding author: Wenjiang Huang, PhD, Professor, research interests:
agricultural remote sensing. Mailing address: No.9 Dengzhuang South Road, Haidian District, Beijing 100094, China. Tel: +86-10-82178169, Email: [email protected].
widely cultivated in tropical and subtropical climatic regions. Fusarium wilt of banana, also called Panama disease, is a serious soilborne fungal disease caused by the fungus Fusarium oxysporum
f. sp. cubense race 4 (Foc 4)[1]. Currently, this disease threatens banana production areas worldwide[2]. It is disseminated either through infected plant material, contaminated soil, tools, or footwear or due to flooding and inappropriate sanitation measures[2]. The first visible signs of Fusarium wilt are yellowing or splitting of the oldest leaves, followed by leaf wilt and buckling, forming a ‘skirt’ around the pseudostem before falling off[3]
. At present, chemical treatment of infected plants is often ineffective. Once a diseased plant is found, ‘timely removal’ is the best way to avoid the formation of a disease center[4]. Therefore, timely monitoring of the occurrence of banana Fusarium wilt disease is very important for the disease treatment and crop planting adjustments.
rice[11,12], and grey leaf spot in maize[13]. When plants are infected with diseases, the leaf water, pigment content and internal structure undergo changes, which are reflected in the spectral signature of the plants[18]. Many spectral features of vegetation were found in the red-edge band that is related to changes in chlorophyll content and leaf area index[14-16], and significant changes were observed when bananas were infected with Fusarium wilt. In recent years, various lightweight multispectral sensors that include the red-edge band (i.e., MicaSense RedEdge MTM) were designed specifically for unmanned aerial vehicle (UAV) platforms for vegetation monitoring[17]. With the rapid development of UAV technology, UAVs have been increasingly used for acquiring imagery to extract phenotypic information of crops rapidly due to their advantages (i.e., high spatial resolution, ease of operation, high flexibility, and acquisition of data on demand)[18-21]. Moreover, scale effects and scaling have become one of the most important research topics in remote sensing[22]. Different spatial resolution images show different landscape characteristics, and data with higher spatial resolution usually get more accurate estimates[23]. However, seeking very high resolution data is unnecessary and unrealistic in the agriculture application at a regional scale as it is expensive and difficult to process. Therefore, it is very important to choose a suitable spatial resolution image for agricultural monitoring. At present, studies using remote sensing technology to monitor Fusarium wilt of banana are scarce.
Lu and Weng[24] stated that the success of any image classification is not only the use of appropriate imagery but also the use of a suitable classification method. Supervised algorithms are widely used because they are more robust than model-based approaches[25]. These classifiers can learn the characteristics of target classes from training samples and apply this information to the unclassified data[26]. The literature shows that a variety of supervised classification algorithms such as decision trees (DT), k-nearest neighbors (kNN) method, artificial neural networks (ANN), support vector machines (SVM), and random forest (RF)
have been developed and tested for crop monitoring and/or land cover classification using remote sensing data[27-32]. Among these methods, the SVM, RF, and ANN algorithms are the most popular classification algorithms for remote sensing of the Earth’s surface[33].
The objectives of this study are to (i) evaluate the performance of the SVM, RF, and ANN classifiers for classifying imagery into areas infested or not infested with banana Fusarium wilt, and (ii) assess the effect of different resolutions on the identification accuracy of banana Fusarium wilt disease to provide a reference for large-scale applications of satellite-based data. The results will provide guidance for disease treatment and crop planting adjustments.
2 Materials and methods
2.1 Study area
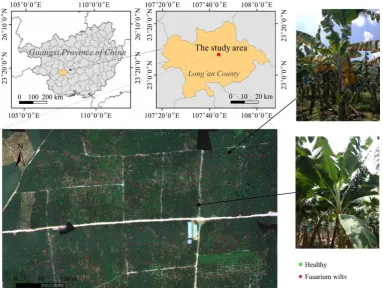
The study area is located in Long’an County, Guangxi Province, China (23°7'58.8''N, 107°43'55.2''E) (Figure 1). It has a subtropical monsoon climate, characterized by year-round sufficient sunshine and rainfall. The average rainfall is 1200 mm a year and the mean annual temperature is 20.8°C-22.4°C. The soil is a sandy loam with pH 4.1, ammonium N content of 17.0 mg/kg, available P content of 180.3 mg/kg, available K content of 140.8 mg/kg, and organic matter content of 17 g/kg in the 0-40 cm soil layer. The field crops were bananas with the variety “Williams B6”. The banana variety has a leaf number of 34-36, the plant height is about 2.4-3.0 m, the growth period is 10- 12 months, and the annual yield is 45 000-60 000 kg/hm2. The farm was developed in September 2015 and the planting distance was 2.0 m by 2.6 m (planting density of 130 plants/hm2). The area was harvested for the first time in November 2016. By August 2018 (the time of field investigation in this study), the third generation of bananas had appeared in the field. In the study area, nearly 40% of banana plants were infected with Fusarium wilt of different severity.
2.2 Data collection
In this study, a total of 139 sample plots were surveyed on 7 to 9 August 2018 to assess the occurrence of banana Fusarium wilt disease as ground truth data. Each plot had at least one banana plant. Figure 1 shows the distribution of ground survey sites. The samples were classified into two categories: healthy samples (total of 66) and Fusarium wilt diseased samples (total of 73). The classification standard adopted in this paper is mainly based on the ratio of yellow leaf disease area to total leaf area, which accounts for less than 1% is considered healthy, otherwise it is considered to be diseased. Finally, a total of 100 samples were randomly selected for calibration and the remaining samples were used for validation.
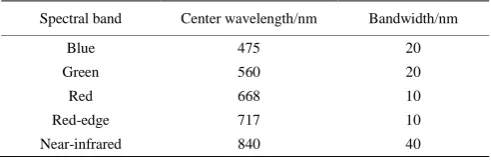
The acquisition of the multi-spectral imagery was conducted using a DJI Phantom 4 quadcopter (DJI Innovations, Shenzhen, China) on 7 August 2018. This UAV was equipped with a five-band
multi-spectral camera (MicaSense RedEdge MTM, MicaSense, Inc., Seattle, WA, USA). The camera has a spectral range of 400 to 900 nm with a 47.2° field of view. It has five spectral bands: blue, green, red, RE, and near-infrared (NIR). The spectral bands have a ground sampling distance (GSD) of 8 cm at a flying height of 120 m above ground (Table 1), which were the conditions in this study. The sensor has a global shutter and all bands are aligned; the images have 12-bit radiometric resolution and the image capture rate is 1 Hz. In this study, the flight plan ensured cross-track and along-track overlap of 80% and a calibrated reflectance panel was imaged directly before and after each flight and used for reflectance calibration using the empirical line method.
Table 1 Characteristics of the MicaSense RedEdge MTM multi-spectral camera
Spectral band Center wavelength/nm Bandwidth/nm
Blue 475 20
Green 560 20
Red 668 10
Red-edge 717 10
Near-infrared 840 40
2.3 Classification algorithms
In this study, the RF, ANN, and SVM classifiers were used to identify and map banana fusarium wilt disease.
2.3.1 Support Vector Machine (SVM)
SVM is a non-parametric supervised statistical learning classifier and has become increasingly popular for remote sensing classification[34-36]. The SVM algorithm was developed by Vapnik[37]. The objective is to try to find the optimal hyperplane in the n-dimensional classification space with the largest difference between the classes[33]. Polynomial and radial basis function (RBF) kernels are the most commonly used functions for classification[38-40]. A number of studies have found that the RBF is superior to the polynomial kernel for the classification of remote sensing data[40-42]. There are two parameters that need to be set when using an SVM classifier with the RBF kernel, i.e., the cost function (C) and the kernel width parameter (γ)[43]. The C
parameter trades off the misclassification of training examples against the simplicity of the decision surface[44]. The γ affects the smoothness of the class-dividing hyperplane[29]. A high C value may lead to over-fitting, whereas an increase in the γ value will affect the shape of the class-dividing hyperplane, which may affect the classification accuracy results[29].
2.3.2 Random forest (RF)
RF is one of the most popular DT-based ensemble models and
was first proposed by Breiman[45]. It can be described as an ensemble of classification trees, where each tree votes on the class assigned to a given sample, with the most frequent answer winning the vote[46]. RF is an ensemble of many independent individual classification and regression trees (CART) and is defined as[47]:
{h(x, θk), k=1,2,…i…}
where, h represents the RF classifier, x is the input variable, and {θk} represents the independently identically distributed random predictor variables, which are used for generating each CART tree[45]. The final response of the RF is calculated based on the output of all DT.
Two parameters are required for the RF model, namely, the number of predictors that are considered at each fork of the tree (mtry) and the number of random trees assembled during model building (ntree)[33]. Theoretical and empirical research has demonstrated that the classification accuracy is less sensitive to
ntree than to the mtry parameter[26,48]. It was reported that an increase in the values of mtry resulted in a higher predictive performance of the model and the attribution of higher importance to fewer variables[49]. Therefore, it is necessary to optimize the parameters mtry and ntree to maximize the model accuracy[50].
The advantages of RF are low computational burden and easy to determine which parameters to use[51]. Over-fitting is less of an issue than in a single DT and there is no need to prune the trees which is a tedious task[52]. Although RF has shown high accuracy and ability to model complex interactions among variables, it is a ‘‘black-box’’ because the individual trees cannot be estimated separately[53].
2.3.3 Artificial neural networks (ANN)
An ANN classifier can be described as a parallel computing system consisting of an extremely large number of simple processors with interconnections[33]. It is a mathematical model that is inspired by the structure and functional aspects of biological neural networks. It consists of an interconnected group of artificial neurons and processes information using a connectionist approach to computation. The ANN was originally designed as a pattern-recognition and data analysis tool that mimics the neural storage and analytical operations of the brain. It has a distinct advantage in that it is non-parametric and requires little or no a priori knowledge of the distribution model of input data[40]. Moreover, the ANN fits an arbitrary decision boundary to separate the data points and produces high classification accuracy[40,54]. ANNs have successfully been applied to remote sensing in many fields[33,55-57].
2.4 Data processing and accuracy assessment
After training, the validation samples were used for an accuracy assessment; a confusion matrix was developed and the overall accuracy and the Kappa coefficient were calculated[58,59]. The overall accuracy is the sum of the correctly classified plots divided by the total number of plots. A Kappa value of 1 represents a perfect agreement, whereas a value of 0 represents no agreement. The data processing and classifications were conducted in ENVI 5.3 (Exelis Visual Information Solutions, Inc., Broomfield, CO, USA) and “RandomForest” package[60]. The distribution maps of banana Fusarium wilt were created in ArcGIS 10.2 (ESRI, Inc., Redlands, CA, USA).
3 Results
3.1 Accuracy assessment of different classifiers for extracting Fusarium wilt disease
In this study, the verification samples were used to determine the classification accuracy of banana Fusarium wilt with different classifiers (Table 2). The results showed that the SVM, RF, and ANN classifiers exhibited good performance for identifying Fusarium wilt disease in UAV-based multi-spectral imagery. All classifiers achieved comparable overall accuracies, which were higher than 90%. The SVM had the highest accuracy (overall accuracy=91.4% and Kappa coefficient=0.80), followed by the ANN (overall accuracy=91.1% and Kappa coefficient=0.79) and RF (overall accuracy=90.0% and Kappa coefficient =0.77). However, the RF algorithm required much less training time. The training times of the SVM and ANN were 11.6 and 2.0 times longer, respectively than that of the RF (Table 3). Overall, the comprehensive performance of the RF was superior to those of the SVM and ANN for identifying banana Fusarium wilt disease with acceptable accuracy. Furthermore, the performances of the input data with and without the red-edge band were compared. The results showed that the inclusion of the red-edge band increased the identification accuracy of banana Fusarium wilt in this study. The increases in the overall accuracy were 2.9%, 2.9%, and 3.0% for the SVM, RF, and ANN algorithms, respectively.
Table 2 Identification accuracy of banana Fusarium wilt for the pixel-based method using the SVM, RF, and ANN
classifiers
Classifier
Red-edge band included Red-edge band excluded Contribution of red-edge band
for overall accuracy/% Overall
accuracy/% Kappa coefficient
Overall accuracy/%
Kappa coefficient
SVM 91.4 0.80 88.5 0.75 2.9
RF 90.0 0.77 87.1 0.72 2.9
ANN 91.1 0.79 88.1 0.73 3.0
Table 3 Computational cost of the use of the SVM, RF, and ANN classifiers with the inclusion of the red-edge band
Classifier Training time
SVM 10 h and 24 min
RF 54 min
ANN 1 h and 50 min
3.2 Simulation of the resolution of satellite-based imagery
In order to assess the accuracy of images with a different spatial resolution for identifying banana Fusarium wilt, the original UAV imagery was chosen to resample to generate images with 0.5 m, 1 m, 2 m, and 5 m resolution. RF classifier was used because it was superior to SVM and ANN classifiers for banana Fusarium wilt identification in general. Table 4 lists the results of
the identification accuracy of locations of infested or non-infested plants using the RF algorithm with different resolution imagery. The results showed that the overall accuracy and Kappa coefficient decreased with a decrease in the resolution. When the imagery with the red-edge band was used, the overall accuracies for the 0.5 m, 1 m, and 2 m resolution were 87.0%, 84.7%, and 84.6%, respectively and the Kappa coefficients were 0.71, 0.67, and 0.66. The overall accuracy and Kappa coefficient were lowest for the 5 m resolution imagery, with an overall accuracy of 70.6% and a Kappa coefficient of 0.41. The results also showed that the inclusion of the red-edge band increased the identification accuracy of banana Fusarium wilt for the different resolutions. The increases in the overall accuracy were 1.9%, 1.7%, 1.8%, and 4.7% for the 0.5 m, 1 m, 2 m, and 5 m resolution imagery, respectively.
Table 4 Identification accuracy of banana Fusarium wilt using the RF classifier for images with different resolutions
Spatial resolution
/m
Red-edge band included Red-edge band excluded Contribution of red-edge band
for overall accuracy/% Overall
accuracy/% Kappa coefficient
Overall accuracy/%
Kappa coefficient
0.5 87.0 0.71 85.1 0.69 1.9
1 84.7 0.67 83.0 0.63 1.7
2 84.6 0.66 82.8 0.62 1.8
5 70.6 0.41 65.9 0.32 4.7
3.3 Mapping the distribution of banana Fusarium wilt
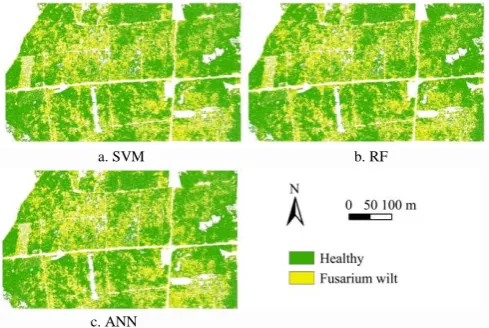
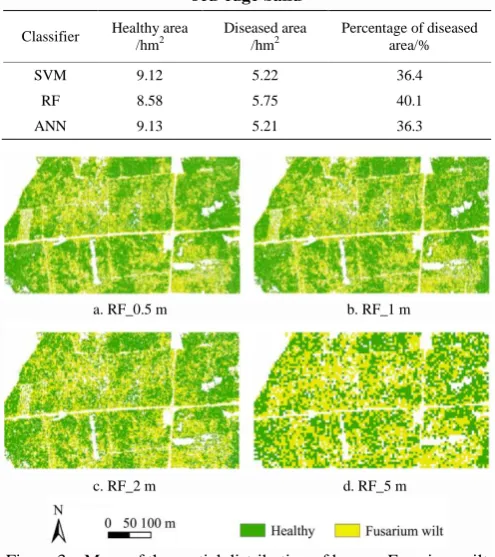
Based on discriminant models of banana Fusarium wilt established by SVM, RF and ANN algorithms in different resolutions, the spatial distributions of banana Fusarium wilt infected regions in the study area were mapped. Figure 2 shows the maps of the spatial distribution of banana Fusarium wilt infected regions using SVM, RF and ANN classifiers with the red edge band. As can be seen in Figure 2, all the maps presented similar distributions trend with regard to the occurrence of banana Fusarium wilt disease. The results in Table 5 show the areas of the healthy regions and Fusarium wilt infected regions for the input data with the red-edge band, the areas of Fusarium wilt disease were in the range of 5.21-5.75 hm2, accounting for 36.3%-40.1% of the total planting area of bananas in the study area. Figure 3 shows the maps of banana Fusarium wilt infected regions obtained from imagery with 0.5 m, 1 m, 2 m, and 5 m resolution. It is observed that the maps exhibit the same overall distribution of banana plants infected with Fusarium wilt. However, the maps with 0.5, 1, and 2 m resolution (Figures 3a to 3c) show local details better than the map with 5 m resolution (Figure 3d).
a. SVM b. RF
c. ANN
Figure 2 Maps of the spatial distribution of banana Fusarium wilt infected regions in the study area using SVM, RF and ANN
Table 5 Areas of Fusarium wilt infected regions obtained by the SVM, RF and ANN classifiers with the inclusion of the
red-edge band
Classifier Healthy area /hm2
Diseased area /hm2
Percentage of diseased area/%
SVM 9.12 5.22 36.4
RF 8.58 5.75 40.1
ANN 9.13 5.21 36.3
a. RF_0.5 m b. RF_1 m
c. RF_2 m d. RF_5 m
Figure 3 Maps of the spatial distribution of banana Fusarium wilt infected regions in the study area using RF classifier with the inclusion of the red-edge band for different resolution images
4 Discussion
The results of this study indicated that the SVM, RF, and ANN classifiers used on the UAV-based multi-spectral imagery have good potential to identify and map banana Fusarium wilt disease. All classifiers yielded similar classification results with an overall accuracy higher than 90%, but the RF algorithm required less training time. The training time of the SVM and ANN were 11.6 and 2.0 times longer, respectively than that of the RF. The high computational cost is a bottleneck of SVM applied to large scale problems[61]. Some studies have shown that ANNs have a reputation for being hard to use and to optimize, which is true of most implementations that require the user to set all parameters[26,33]. Therefore, the comprehensive performance of the RF was superior to those of the SVM and ANN for identifying banana Fusarium wilt disease within acceptable accuracy. Some researchers have also demonstrated that the RF requires the setting of fewer parameters and is faster to implement than the SVM and ANN classifiers[26,33,62,63].
We also simulated the most common resolutions of satellite-based imagery (such as 0.5 m resolution WorldView series imagery, 1 m resolution GF-2 imagery, 2 m resolution GF-6 imagery, 5 m resolution RapidEye imagery) to assess the effects of imagery with different spatial resolution on the identification accuracy of banana Fusarium wilt disease. The results showed that imagery with a spatial resolution higher than 2 m had better classification accuracy (overall accuracy >80%). When the resolution decreased to 5 m, the classification accuracy decreased to 70.6%. This might be related to the plant spacing of bananas (2.0 m by 2.6 m) in the area. When the resolution is higher than 2 m, the image pixels can be considered as pure pixels or nearly
pure pixels, i.e., a single pixel corresponds to a single spectral signature. When the resolution is 5 m, the image pixels are mixed pixels, i.e., a single pixel contains several banana plants and has a mixture of spectral features. Therefore, satellite-based imagery with a resolution higher than 2 m has good potential for identifying and mapping banana Fusarium wilt disease.
The results showed that the inclusion of the red-edge band resulted in 2.9%-3.0% increases in overall accuracy for the 0.08 m resolution imagery. This is attributed to the fact that the leaf chlorophyll content of the banana plants decreases significantly as the infection of Fusarium wilt progresses[64], and the red-edge region is highly sensitive to changes in chlorophyll[16,65]. The changes in the red-edge band have been used as an indicator of vegetation stress[9]. However, the imagery obtained by the MicaSense RedEdge MTM sensor only has five spectral bands, which cannot fully reveal the differences in spectral characteristics between healthy and diseased plants. Hyperspectral data should be used for further studies on the sensitivity of certain bands to Fusarium wilt of bananas. In addition, differences in the spectral characteristic between Fusarium wilt and other yellowing phenomena caused by other stresses (i.e., drought stress and nutrition deficiency) should also be examined.
5 Conclusions
This study evaluated the performance of SVM, RF, and ANN classifiers used with UAV-based multi-spectral imagery to identify the locations that were infested or not infested with banana Fusarium wilt. The results showed that the SVM, RF, and ANN classifiers were well suited to identify and map banana Fusarium wilt with UAV-based multi-spectral imagery. The overall accuracies of the SVM, RF, and ANN were 91.4%, 90.0%, and 91.1%, respectively, for the pixel-based approach. The RF algorithm required far less training time than the SVM and ANN algorithms. The maps generated by the SVM, RF and ANN had similar distributions trend with regard to the occurrence of Fusarium wilt disease. The areas of occurrence of Fusarium wilt disease were in the range of 5.21-5.75 hm2, accounting for 36.3%-40.1% of the total planting area of bananas in the study area. The results also showed that the inclusion of the red-edge band resulted in increases in the overall accuracy of 2.9%-3.0% for the 0.08 m resolution imagery. A simulation of the resolutions of satellite-based imagery (i.e., 0.5 m, 1 m, 2 m, and 5 m resolutions) showed that imagery with a spatial resolution higher than 2 m resulted in good identification accuracy of Fusarium wilt. The results of this study indicate that the RF has good potential for identifying and mapping banana Fusarium wilt disease from UAV-based remote sensing imagery; this provides guidance for disease treatment and crop planting adjustment.
Acknowledgements
This research was funded by the Hainan Provincial Key R&D Program of China (ZDYF2018073), National Natural Science Foundation of China (41571354), Hainan Provincial
Major Science and Technology Program of China
acknowledge the National Meteorological Information Center of China, Guangxi Jiejiarun Technology Co., Ltd. and Guangxi Jinsui Agriculture Group Co., Ltd. for the experiments.
[References]
[1] Shen Z, Xue C, Penton C R, Thomashow L S, Zhang N, Wang B, et al. Suppression of banana Panama disease induced by soil microbiome reconstruction through an integrated agricultural strategy. Soil Biol Biochem, 2019; 128: 164–174.
[2] Ordonez N, Seidl M F, Waalwijk C, Drenth A, Kilian A, Thomma B P H J, et al. Worse comes to worst: bananas and Panama disease-when plant and pathogen clones meet. Plos Pathog, 2015; 11(11): e1005197.
[3] Van den Berg N, Berger D K, Hein I, Birch P R, Wingfield M J, Viljoen A. Tolerance in banana to Fusarium wilt is associated with early up‐regulation of cell wall‐strengthening genes in the roots. Molecular plant pathology, 2007; 8(3): 333–341.
[4] Lin B, Shen H. Fusarium oxysporum f. sp. cubense. In: Wan F, Jiang M, Zhan A, editors. Biological Invasions and Its Management in China: Volume 2. Singapore: Springer Singapore, 2017; pp. 225–236.
[5] Shi Y Y, Huang W J, Ye H C, Ruan C, Xing N, Geng Y, et al. Partial least square discriminant analysis based on normalized two-stage vegetation indices for mapping damage from rice diseases using PlanetScope datasets. Sensors, 2018; 18(6): 1901.
[6] Jin X, Jie L, Wang S, Qi H J, Li S W. Classifying wheat hyperspectral pixels of healthy heads and Fusarium head blight disease using a deep neural network in the wild field. Remote Sens, 2018; 10(3): 395. [7] Mahlein A K, Alisaac E, Al Masri A, Behmann J, Dehne H W, Oerke E C.
Comparison and combination of thermal, fluorescence, and hyperspectral imaging for monitoring fusarium head blight of wheat on spikelet scale. Sensors, 2019; 19(10): 2281.
[8] Huang W J, Lamb D W, Niu Z, Zhang Y, Liu L, Wang J. Identification of yellow rust in wheat using in-situ spectral reflectance measurements and airborne hyperspectral imaging. Precis Agric, 2007; 8(4-5): 187–197. [9] Huang W J, Guan Q, Luo J, Zhang J, Zhao J, Liang D, et al. New
optimized spectral indices for identifying and monitoring winter wheat diseases. IEEE Journal of Selected Topics in Applied Earth Observations and Remote Sensing, 2014; 7(6): 2516–2524.
[10] Shi Y, Huang W J, Gonzalez-Moreno P, Luke B, Dong Y, Zheng Q, et al. Wavelet-based rust spectral feature set (WRSFs): a novel spectral feature set based on continuous wavelet transformation for tracking progressive host-pathogen interaction of yellow rust on wheat. Remote Sens, 2018; 10(4): 525.
[11] Huang J, Liao H, Zhu Y, Sun J, Sun Q, Liu X. Hyperspectral detection of rice damaged by rice leaf folder (Cnaphalocrocis medinalis). Comput Electron Agr, 2012; 82: 100–107.
[12] Yang C M. Assessment of the severity of bacterial leaf blight in rice using canopy hyperspectral reflectance. Precis Agric, 2010; 11(1): 61–81. [13] Dhau I, Adam E, Mutanga O, Ayisi K, Abdel-Rahman E M, Odindi J, et al.
Testing the capability of spectral resolution of the new multispectral sensors on detecting the severity of grey leaf spot disease in maize crop. Geocarto Int, 2018; 33(11): 1223–1236.
[14] Xie Q, Dash J, Huang W, Peng D, Qin Q M, Mortimer H, et al. Vegetation Indices Combining the Red and Red-Edge Spectral Information for Leaf Area Index Retrieval. IEEE Journal of Selected Topics in Applied Earth Observations and Remote Sensing, 2018; 11(5): 1482–1493. [15] Filella I, Penuelas J. The red edge position and shape as indicators of plant chlorophyll content, biomass and hydric status. Int J Remote Sens, 1994; 15(7): 1459–1470.
[16] Dash J, Curran P J. The MERIS terrestrial chlorophyll index. Int J Remote Sens, 2004; 25(23): 5403–5413.
[17] Duncan A M, Vacaliuc B, Larson M D, Davis C, Hughes D, Corcoran K, editors. Integration and operation of a sUAS-based multi-modal imaging payload equipped with a novel communication system enabling autonomous platform control. Unmanned Systems Technology XXI 2019; Baltimore, Maryland, United States: International Society for Optics and Photonics.
[18] Deng L, Mao Z, Li X, Hu Z, Yan Y. UAV-based multispectral remote sensing for precision agriculture: A comparison between different cameras. ISPRS J Photogramm, 2018; 146: 124–136.
[19] Dash J P, Watt M S, Pearse G D, Heaphy M, Dungey H S. Assessing very high resolution UAV imagery for monitoring forest health during a simulated disease outbreak. ISPRS J Photogramm, 2017; 131: 1–14.
[20] Liu B, Shi Y, Duan Y, Wu W. UAV-based crops classification with joint features from orthoimage and DSM data. International Archives of the Photogrammetry, Remote Sensing & Spatial Information Sciences, 2018; XLII-3: 1023–1028.
[21] Liu K, Zhou Q B, Wu W B, Xia T, Tang H J. Estimating the crop leaf area index using hyperspectral remote sensing. J Integr Agr, 2016; 15(2): 475–91.
[22] Li N, Xie G, Zhou D, Zhang C, Jiao C. Remote sensing classification of marsh wetland with different resolution images. J Resour Ecol, 2016; 7(2): 107–114.
[23] Fisher J R, Acosta E A, Dennedy-Frank P J, Kroeger T, Boucher T M. Impact of satellite imagery spatial resolution on land use classification accuracy and modeled water quality. Remote Sens Ecol Conserv, 2018; 4(2): 137–149.
[24] Lu D, Weng Q. A survey of image classification methods and techniques for improving classification performance. Int J Remote Sens, 2007; 28(5): 823–870.
[25] Niemeyer J, Rottensteiner F, Soergel U. Contextual classification of lidar data and building object detection in urban areas. Isprs J Photogramm, 2014; 87: 152–165.
[26] Belgiu M, Dragut L. Random forest in remote sensing: A review of applications and future directions. Isprs J Photogramm, 2016; 114: 24–31. [27] Zheng Q, Huang W, Cui X, Shi Y, Liu L. New spectral index for
detecting wheat yellow rust using Sentinel-2 multispectral imagery. Sensors, 2018; 18(3): 868.
[28] Ma H, Jing Y, Huang W, Shi Y, Dong Y, Zhang J, et al. Integrating early growth information to monitor winter wheat powdery mildew using multi-temporal Landsat-8 imagery. Sensors, 2018; 18(10): 3290. [29] Thanh Noi P, Kappas M. Comparison of random forest, k-nearest
neighbor, and support vector machine classifiers for land cover classification using Sentinel-2 imagery. Sensors, 2018; 18(1): 18. [30] Rumpf T, Mahlein A K, Steiner U, Oerke E C, Dehne H W, Plümer L.
Early detection and classification of plant diseases with support vector machines based on hyperspectral reflectance. Comput Electron Agr, 2010; 74(1): 91–99.
[31] Chemura A, Mutanga O, Dube T. Separability of coffee leaf rust infection levels with machine learning methods at Sentinel-2 MSI spectral resolutions. Precis Agric, 2017; 18(5): 859–881.
[32] Hou J C, Hu Y H, Hou L X, Guo K Q, Satake T. Classification of ripening stages of bananas based on support vector machine. Int J Agric & Biol Eng, 2015; 8(6): 99–103.
[33] Raczko E, Zagajewski B. Comparison of support vector machine, random forest and neural network classifiers for tree species classification on airborne hyperspectral APEX images. European Journal of Remote Sensing, 2017; 50(1): 144–154.
[34] Cheng G, Han J W, Zhou P C, Guo L. Multi-class geospatial object detection and geographic image classification based on collection of part detectors. ISPRS J Photogramm, 2014; 98: 119–132.
[35] George R, Padalia H, Kushwaha S P S. Forest tree species discrimination in western Himalaya using EO-1 Hyperion. Int J Appl Earth Obs Geoinf, 2014; 28: 140–149.
[36] Ma L, Fu T, Blaschke T, Li M, Tiede D, Zhou Z, et al. Evaluation of feature selection methods for object-based land cover mapping of unmanned aerial vehicle imagery using random forest and support vector machine classifiers. Isprs Int J Geo-Inf, 2017; 6(2). doi: 10.3390/ijgi6020051
[37] Vapnik V N. The nature of statistical learning theory. New York: Springer; 1995.
[38] Dixon B, Candade N. Multispectral landuse classification using neural networks and support vector machines: one or the other, or both? Int J Remote Sens, 2008; 29(4): 1185–1206.
[39] Huang C, Davis L S, Townshend J R G. An assessment of support vector machines for land cover classification. Int J Remote Sens, 2002; 23(4): 725–749.
[40] Omer G, Mutanga O, Abdel-Rahman E M, Adam E. Performance of support vector machines and artificial neural network for mapping endangered tree species using WorldView-2 data in Dukuduku Forest, South Africa. IEEE Journal of Selected Topics in Applied Earth Observations and Remote Sensing, 2015; 8(10): 4825–4840.
[41] Karatzoglou A, Meyer D, Hornik K. Support vector machines in R. J Stat Softw, 2006; 15(9): 1–28.
[43] Ballanti L, Blesius L, Hines E, Kruse B. Tree species classification using hyperspectral imagery: A comparison of two classifiers. Remote Sens, 2016; 8(445): 1–18.
[44] Gola J, Webel J, Britz D, Guitar A, Staudt T, Winter M, et al. Objective microstructure classification by support vector machine (SVM) using a combination of morphological parameters and textural features for low carbon steels. Comp Mater Sci., 2019; 160: 186–196.
[45] Breiman L. Random forests. Mach Learn, 2001; 45: 5–32.
[46] Sun L Y, Schulz K. The improvement of land cover classification by thermal remote sensing. Remote Sens, 2015; 7(7): 8368–8390.
[47] Feng Q, Liu J, Gong J. UAV remote sensing for urban vegetation mapping using random forest and texture analysis. Remote Sens, 2015; 7(1): 1074–1094.
[48] Ghosh A, Fassnacht F E, Joshi P K, Koch B. A framework for mapping tree species combining hyperspectral and LiDAR data: Role of selected classifiers and sensor across three spatial scales. Int J Appl Earth Obs Geoinf, 2014; 26: 49–63.
[49] Oliveira S, Oehler F, San-Miguel-Ayanz J, Camia A, Pereira J M C. Modeling spatial patterns of fire occurrence in Mediterranean Europe using Multiple Regression and Random Forest. Forest Ecol Manag, 2012; 275: 117–129.
[50] Tatsumi K, Yamashiki Y, Torres M A C, Taipe C L R. Crop classification of upland fields using Random forest of time-series Landsat 7 ETM+data. Comput Electron Agr, 2015; 115: 171–179.
[51] Puissant A, Rougier S, Stumpf A. Object-oriented mapping of urban trees using Random Forest classifiers. International Journal of Applied Earth Observations Geoinformation, 2014; 26(1): 235–245.
[52] Rodriguez-Galiano V F, Ghimire B, Rogan J, Chica-Olmo M, Rigol-Sanchez J P. An assessment of the effectiveness of a random forest classifier for land-cover classification. Isprs J Photogramm, 2012; 67: 93–104.
[53] Prasad A M, Iverson L R, Liaw A. Newer classification and regression tree techniques: Bagging and random forests for ecological prediction. Ecosystems, 2006; 9(2): 181–199.
[54] Licciardi G A, Villa A, Dalla Mura M, Bruzzone L, Chanussot J, Benediktsson J A. Retrieval of the Height of Buildings From
WorldView-2 Multi-Angular Imagery Using Attribute Filters and Geometric Invariant Moments. IEEE Journal of Selected Topics in Applied Earth Observations and Remote Sensing, 2012; 5(1): 71–79. [55] Jiang H, Rusuli Y, Amuti T, He Q. Quantitative assessment of soil
salinity using multi-source remote sensing data based on the support vector machine and artificial neural network. Int J Remote Sens, 2019; 40(1): 284–306.
[56] Mas J F, Flores J J. The application of artificial neural networks to the analysis of remotely sensed data. Int J Remote Sens, 2008; 29(3): 617–663.
[57] Zhang C, Xie Z. Combining object-based texture measures with a neural network for vegetation mapping in the Everglades from hyperspectral imagery. Remote Sens Environ, 2012; 124: 310–320.
[58] Congalton R G. A review of assessing the accuracy of classifications of remotely sensed data. Remote Sens Environ, 1991; 37(1): 35–46. [59] Foody G M. Classification accuracy comparison: Hypothesis tests and
the use of confidence intervals in evaluations of difference, equivalence and non-inferiority. Remote Sens Environ, 2009; 113(8): 1658–1663. [60] Van der Linden S, Rabe A, Held M, Jakimow B, Leitão P J, Okujeni A, et
al. The EnMAP-Box—A Toolbox and Application Programming Interface for EnMAP Data Processing, 2015; 7(9): 11249–11266. [61] Zhang R, Ma J. An improved SVM method P‐SVM for classification of
remotely sensed data. Int J Remote Sens, 2008; 29(20): 6029–6036. [62] Chan J C W, Beckers P, Spanhove T, Vanden Borre J. An evaluation of
ensemble classifiers for mapping Natura 2000 heathland in Belgium using spaceborne angular hyperspectral (CHRIS/Proba) imagery. Int J Appl Earth Obs, 2012; 18: 13–22.
[63] Shao Y, Campbell J B, Taff G N, Zheng B J. An analysis of cropland mask choice and ancillary data for annual corn yield forecasting using MODIS data. Int J Appl Earth Obs, 2015; 38: 78–87.
[64] Dong X, Wang M, Ling N, Shen Q, Guo S. Potential role of photosynthesis-related factors in banana metabolism and defense against Fusarium oxysporum f. sp cubense. Environ Exp Bot, 2016; 129: 4–12. [65] Clevers J G P W, de Jong S M, Epema G F, van der Meer F, Bakker W H,