Method for UAV spraying pattern measurement with PLS model based
spectrum analysis
Ruirui Zhang
1,2,3,4,
Yao Wen
1,2,3,4,
Longlong Li
1,2,3,4,
Liping Chen
1,2,3,4*,
Gang Xu
1,2,3,4,
Yanbo Huang
5,
Qing Tang
1,2,3,4,
Tongchuan Yi
1,2,3,4(1. National Research Center of Intelligent Equipment for Agriculture, Beijing Academy of Agricultural And Forestry Sciences, Beijing 100097, China; 2. Beijing Research Center of Intelligent Equipment for Agriculture, Beijing Academy of Agricultural And Forestry Sciences, Beijing 100097, China; 3. National Center for International Research on Agricultural Aerial Application Technology, Beijing Academy of Agricultural And Forestry Sciences, Beijing 100097, China; 4. Beijing Key laboratory of Intelligent Equipment Technology for
Agriculture, Beijing Academy of Agricultural And Forestry Sciences, Beijing 100097, China; 5.United States Department of Agriculture, Agricultural Research Service, Crop Production Systems Research Unit, Stoneville MS 38776, USA)
Abstract: Unmanned aerial vehicle (UAV) chemical application is widely used for crop protection, and spraying pattern is one
of the most important factors that influence the chemical control efficacy. A method for UAV spraying pattern measurement with partial least squares (PLS) model based spectrum analysis was proposed in this study to measure the UAV spraying pattern more accurately. The method involved the steps of fluorescent tracer solution spray and its droplets collection, the spectrum on paper strip acquiring, spectrum processing and analysis, PLS modeling. In order to verify the applicability of the method and obtain the parameters of the PLS model, UAV spraying experiments were performed in the field. Then Fluorescent tracer solution was sprayed and its droplets are collected by paper strip, and the original spectrum on paper strip obtained by a spectrometer was processed by the Savitzky-Golay and standard normalized variable (SNV) method. The prediction model of coverage rate selected as the droplet deposition parameter to measure the UAV spraying pattern, was established by using PLS method. To verify the superiority of the PLS model, a traditional linear regression (LR) model of coverage rate was established simultaneously. The results demonstrate that the method with PLS model based spectrum analysis can measure the UAV spraying pattern effectively, and PLS model has a better performance of RV2=0.94 and RMSEP=0.9446 than that of the
LR model.
Keywords: pattern measurement, UAV spraying, spectrum model, coverage rate, partial least squares method DOI: 10.25165/j.ijabe.20201303.5341
Citation:
Zhang R R, Wen Y, Li L L, Chen L P, Xu G, Huang Y B, et al. Method for UAV spraying pattern measurement
with PLS model based spectrum analysis. Int J Agric & Biol Eng, 2020; 13(3): 22–28.
1 Introduction
Unmanned aerial vehicle (UAV) is typically low cost, light weight and low airspeed aircraft that is developing rapidly and using worldwide in the plant protection. And UAV chemical application is beneficial to improve the utilization of agricultural resources and achieve the goal of precision aerial application[1,2]. Flight height of the UAV and complex downwash flow field of its rotors will directly influence the movement and pattern of the spraying droplets[3,4]. Therefore, the accurate measurement of
Received Date: 2019-12-22 Accepted Date: 2020-03-14
Biographies: Ruirui Zhang, PhD, research interests: agricultural aviation
application, precise spraying. Email: [email protected]; Yao Wen, Engineer, research interests: agricultural aviation application. Email: [email protected]; Longlong Li, PhD, research interests: plant protection machinery and application technology. Email: [email protected]; Gang Xu, PhD, research interests: image processing and information acquisition. Email: [email protected]; Yanbo Huang, PhD, research interests: agricultural aviation application. Email: [email protected]; Qing Tang, PhD, research interest: agricultural aerial spray, Email: [email protected]; Tongchuan Yi, Engineer, research interests: electrics and electronics. Email: [email protected].
*Corresponding author: Liping Chen, Professor, research interests: intelligent agricultural technology, precision agriculture. Mailing address: Beijing Nongke Mansion, No. 11, Shuguang Huayuan Middle Road, Haidian District, Beijing 100097, China. Tel: +86-10-51053425, Email: [email protected].
spraying pattern has an important significance for improving the control efficacy of UAV chemical application[5].
using CFD simulation technique. However, the results should be verified by experiments. Currently, some scholars exploited sensors to detect droplets[16]. Droplet deposition detection system was developed by Zhang et al.[17] using a variable dielectric capacitor. With this system, the droplet deposit volume could be rapidly measured in aerial spray application. However, the sensor was effective for detection of rough spray, and the details need to be improved. There also have been several recent developments to measure spray application and droplet distribution using other methods[18-24], remote sensing, infrared thermography, etc.
As mentioned above, researchers have carried out many studies to achieve the spraying pattern measurement more efficient and accurate. In this study, a method for UAV spraying pattern measurement with partial least squares (PLS) model based spectrum analysis was proposed, and field experiments were conducted to verify the applicability of the method.
2 Materials and methods
2.1 Experimental design
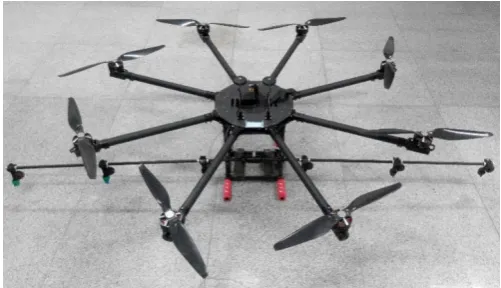
Field experiments were conducted at National Precision Agriculture Research Station (40°10ʹ57ʹʹN, 116°27ʹ27ʹʹE) in China on June 30, 2017. As shown in Figure 1, an 8-rotor UAV used in this experiment and the specifications of the UAV are shown in Table 1.
Figure 1 8-rotor UAV
Table 1 Parameters of UAV
Parameters Technical index
Type TTA-T8-PRO-5, Tian Tu Aviation
Size/mm×mm×mm 2400×2200×450
Rotor diameter/mm 500
Tank capacity/L 10
Average flight height/m 3
Effective spraying swath/m 3
Average flight speed/ m·s-1 1.5
The spraying system of the UAV is consisted of water-pump, spraying boom, nozzles and other components. The system uses the PLD-1206 type diaphragm pump operated at DC 12V and produced flow rates of up to 4.0 L/min, which support the maximum spraying pressure is 1.0 MPa. The spray boom length was 2.4 m, and six LU120-02 type nozzles (Lechler GmbH, Germany) with 128.3 μm volume median diameter (VMD) under pressure 0.3 MPa[25] were equidistantly mounted on it with a spacing of 0.48 m.
Fluorescent brightener RQT-C-3 was used as a fluorescent tracer for the spraying experiment, with a strong fluorescent signal and water solubility, and mixed with water to a final mass concentration of 1.0%. Two tests were performed with the same performance parameters. A ordinary Kraft paper strip with 19.3 mm width and 0.3 mm thickness was adopted as droplet collector. The paper strip is commercial, contains no fluorescent compounds itself, exhibits a degree of water absorbability and is easy to collect and store for the field test.
The sampling layout is shown in Figure 2. Paper strip was mounted on the shelf at a height of 1 m above the ground. To quantify the spraying pattern, water sensitive paper (WSP) cards (Syngenta Crop Protection AG, Switzerland) with the size of 26 mm×76 mm were placed near the paper strip. The sample length of the paper strip was 5 m, which covers the effective spraying swath. 26 WSP cards evenly spaced 0.2 m apart were placed along with the paper strip and the sampling positions were labeled 1-26. Paper strips and WSP cards were collected in sealed bags once dry.
Figure 2 Sampling layout
2.2 Acquiring of the spectrum on paper strip
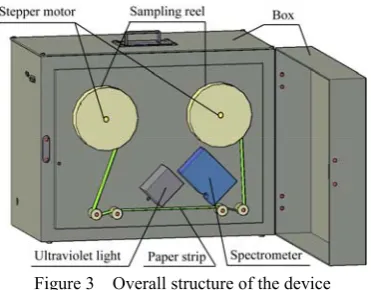
Fluorescent tracer sprayed on the paper strip was excited by ultraviolet light and emitted fluorescence which can be measured by a spectrometer. To improving the spectrum acquisition efficiency, a device was designed. Overall structure of the device is shown in Figure 3, which included ultraviolet light, spectrometer,
sampling reel, stepper motor, and a box.
fluorescent tracer was adopted to acquire the spectral intensity values of the paper strip in this study. The paper strip was wound onto the sample reel with 80-mm-diameter, and a two-phase hybrid stepper motor with a rotating speed of 30 r min-1 was used to drive the shafts of the sample reel. The revolutions of the stepping motor could be converted to a linear distance L (m) of sample reel using Equation (1).
L=40πt+0.15t2 (1) where, t (s) is the sampling time. The sealed structure of the box with the size of 44 cm (length) × 32 cm (width) × 35 cm (height) was was designed to avoid the influence of ambient light.
With an integral time of the spectrometer and sampling time of 100 ms, the spectrum of paper strips was acquired and saved as a CSV file by PC software of the spectrometer. 379 and 376 sets of spectrum were collected in test 1 and test 2 respectively. The spectrum of three sampling points were selected on the paper strip near each corresponding WSP card, spectral average intensity values of the three sampling points were calculated and taken as the original spectrum of samples in each sampling position, and samples were denoted as Sample 1 to Sample 26 in the test 1 or Sample 27 to Sample 52 in the test 2.
Figure 3 Overall structure of the device
2.3 WSP cards analysis
As shown in Figure 4, WSP cards were scanned with a high pixel resolution of 1200 dpi into digital images using a portable scanner. From these WSP images, the coverage rate was calculated via iDAS Pro software[26]. Coverage rate was the ratio of the stained area covered by droplets to the sampled area on WSP cards, which was selected as the droplet deposition parameter to characterize the spraying pattern in this study. And the coverage rate result of the WSP in test 1 and test 2 is shown in Figure 5.
a. Portable scanner b. iDAS Pro software
Figure 4 Image processing system for aerial application quality evaluation
Figure 5 Coverage rate of the WSP
3 Results and discussion
3.1 Spectrum processing and analysis
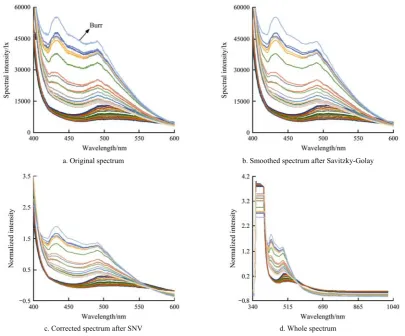
As shown in Figure 6a, the original spectrum of 52 samples in the band range of 400-600 nm on the paper strip was selected to demonstrate the effect of the spectrum processing method.
The spectrum contains not only the information of the sampling point but also other interference components, such as instrument noise and stray light. The Savitzky-Golay method was employed in this study to reduce the random noise of spectrum, this method smooth a signal locally with a low-degree polynomial based on the linear least squares method to a sliding window of data[27]. The degree of the polynomial and the length of the
sliding window are respectively set to 2 and 15 to improve the reliability of the smoothed spectrum. As shown in Figure 6b, it can be seen that original spectrum and smoothed spectrum have the same trends, and several apparent absorption peaks emerged in the 400-600 nm region. It was indicated that the Savitzky-Golay method can effectively remove the noise and the burr of the spectrum, and the useful information of the spectrum was remained.
The standard normalized variable (SNV) method is a common method for eliminating baseline translation and shift caused by light scattering[28], and the principle of SNV is that the absorbance values of each wavelength point in the spectrum satisfy a certain normal distribution. The standard normalized spectral Ziof raw spectral xi was calculated using Equation (2).
i i
x
Z μ
σ −
= (2)
where, μ and σ are the mean and the standard deviation of the spectrum, as shown in Figure 6c.
a. Original spectrum b. Smoothed spectrum after Savitzky-Golay
c. Corrected spectrum after SNV d. Whole spectrum Figure 6 Spectrum processing
As shown in Figure 6c, the spectrum in the wavelength range of 400-600 nm shows a significant fluorescence effect between the 52 samples. The correlation analysis was analyzed between the coverage rate of WSP and the normalized intensity of paper strip in the range of 400-600 nm contains 562 wavelengths. The results of the treatment were shown in Figure 7. It is known from the diagram that the correlation coefficients of the 352 wavelengths in the wavelength range of 414-540 nm are significant and greater than 0.90, therefore normalized intensity in the wavelength range of 414-540 nm of 52 samples were selected as the inputs variables for PLS model. Meanwhile, the wavelength range of 485-495 nm was selected and noted as C485-495 for the LR model[24].
Figure 7 Results of correlation coefficient analysis
3.2 PLS modeling for UAV spraying pattern measurement
The establishment of PLS modeling followed the steps of outlier detection, variable selection, and PLS modeling.
3.2.1 Outlier detection
Outliers arise due to mechanical faults, changes in system behavior, fraudulent behavior, human error, instrument error or simply through natural deviations in populations[29]. When incorporated into PLS model, outliers may lead to erroneous results
with respect to statistical analysis, and reduce the performance of the model significantly. So the detection of outliers is one of the most important steps during the PLS model. Monte Carlo sampling approach was selected as the method for outlier detection and elimination, which was proposed to obtain the distribution of prediction error of each sample[30,31]. The main procedures of this method are as follows:
a. Determine the number of latent variables, calibration samples and test samples.
b. Select calibration and test sets randomly from the whole dataset, which was used to build a prediction model and obtain the prediction errors for samples in the test set.
c. Pretreat calibration data.
d. Implement PLS regression using the non-linear iterative partial least squares (NIPALS) algorithm.
e. Predict the test samples.
f. The mean (MEAN) and standard deviation (STD) of the prediction errors of each sample were employed to diagnose outliers.
The number of Monte-Carlo sampling and sampling ratio is set to 1000 and 0.7, respectively. The result of MEAN and STD of prediction errors of 52 samples is shown in Figure 8, Sample 14, Sample 15, and Sample 41 with the MEAN greater than 4 and the STD greater than 2 were determined to be outliers and removed before modeling. 49 normal samples were retained for further modeling. 33 samples are selected as modeling sets, and 16 samples are selected as validation sets.
3.2.2 Variable selection using Random Frog algorithm
algorithm. The steps of RF algorithm are as follows:
a′. A subset of variables V0 consisting of the number of variables Q was initialized randomly.
b′. A candidate variable subset V* was proposed based on the original subset of variables, and its variables number is a random number Q*. PLS model is established. The regression coefficient of each variable in this PLS model is recorded. Afterwards, the Q* variables which have the largest absolute regression coefficients in PLS model are retained and collected as a candidate subset V*. V* was accepted as V1 with a certain probability. Then V0 was replaced using V1. These iterations are repeated until N loops have finished.
c′. Finally a selection probability of each variable is computed which can be used as the measurement of variable importance. The variable is more likely selected with a large value of probability.
The operation of selecting characteristic variable was conducted on the modeling set. As shown in Figure 9, the normalized intensity of 12 wavelengths with the probability greater than 0.3, including 414.34 nm, 419.45 nm, 427.09 nm, 429.64 nm, 435.81 nm, 446.68 nm, 505.15 nm, 507.99 nm, 513.67 nm, 516.15 nm, 521.47 nm, 521.82 nm, were selected as the sensitive variable of the PLS model by iterative modeling.
Figure 8 Mean/standard deviation plot of prediction errors
Figure 9 Results using RF algorithm 3.2.3 Modeling using PLS regression algorithm
Unlike LR, PLS regression provides an approach based on principal components analysis (PCA) to analyze data with strongly collinear correlated, noisy, and even incomplete variables in both X and Y[33]. In which, the precision of the model parameters is improved along with the increasing number of relevant variables and observations. And the matrix of predictor variables X and the matrix of response variables Y was pretreated firstly. A PLS model was established by the PLS regression NIPALS algorithm, and the regression coefficients that link X and Y were get.
To determine the number of principal components of the PLS model and avoid the impact of redundant information on the model,
10-fold cross validation algorithm was applied. As shown in Figure 10, the tendency of root mean square error of cross validation (RMSECV) was obtained. RMSECV has the minimum value of 0.7870 when the number of latent variables is 7. So that PLS model was established with 7 numbers of latent variables. The value of coverage rate was the outputs of the PLS model. As shown in Figure 11, the modeling determination coefficient RC2 reached to 0.98, the root mean square error of modeling (RMSEC) was 0.5098. The validation determination coefficient RV2 reached to 0.94, the root mean square error of validation (RMSEP) was 0.9446.
Figure 10 Tendency of RMSECV with increasing variables
Figure 11 PLS model for UAV spraying pattern measurement
3.3 Comparison between the result of PLS and LR model
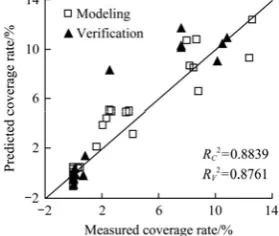
In order to compare and validate the performance of PLS model, a traditional LR model for UAV spraying pattern measurement was established. Based on the average spectral intensity value C485-495 and coverage rate of the WSP, 34 sets of data selected from 52 samples were used to establish the LR model. The remaining 18 sets of data were used to validate the models. The value of coverage rate was represented as y, and C485-495 was represented as x. The LR model expressed as Equation (3):
y=–5.1975+12.5694x (3) As shown in Figure 12, the RC2 reached to 0.88 and the
RMSEC was 1.5109, the RV2 reached to 0.88 and the RMSEP was 1.9404.
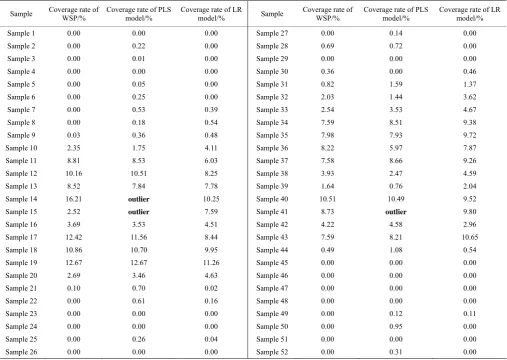
Comparison results between WSP, LR model and PLS model in test 1 and 2 are shown in Figure 13. The coverage rate of WSP, LR model and PLS model is shown in Table 2.
The result indicated that both the LR model and PLS model can predict the value of coverage rate and measure the UAV
spraying pattern. Compared with the LR model, the RMSEC and
RMSEP of PLS model are reduced by 1.0011 and 0.9958, the RC2 and RV2 are increased by 0.10 and 0.06, respectively. Therefore, PLS model is superior to the LR model with the higher correlation coefficient and the lower root mean square error.
a. Test 1 b. Test 2
Figure 13 Comparison results between WSP, LR model and PLS model
Table 2 Coverage rate of WSP, LR model and PLS model
Sample Coverage rate of WSP/%
Coverage rate of PLS model/%
Coverage rate of LR
model/% Sample
Coverage rate of WSP/%
Coverage rate of PLS model/%
Coverage rate of LR model/%
Sample 1 0.00 0.00 0.00 Sample 27 0.00 0.14 0.00
Sample 2 0.00 0.22 0.00 Sample 28 0.69 0.72 0.00
Sample 3 0.00 0.01 0.00 Sample 29 0.00 0.00 0.00
Sample 4 0.00 0.00 0.00 Sample 30 0.36 0.00 0.46
Sample 5 0.00 0.05 0.00 Sample 31 0.82 1.59 1.37
Sample 6 0.00 0.25 0.00 Sample 32 2.03 1.44 3.62
Sample 7 0.00 0.53 0.39 Sample 33 2.54 3.53 4.67
Sample 8 0.00 0.18 0.54 Sample 34 7.59 8.51 9.38
Sample 9 0.03 0.36 0.48 Sample 35 7.98 7.93 9.72
Sample 10 2.35 1.75 4.11 Sample 36 8.22 5.97 7.87
Sample 11 8.81 8.53 6.03 Sample 37 7.58 8.66 9.26
Sample 12 10.16 10.51 8.25 Sample 38 3.93 2.47 4.59
Sample 13 8.52 7.84 7.78 Sample 39 1.64 0.76 2.04
Sample 14 16.21 outlier 10.25 Sample 40 10.51 10.49 9.52
Sample 15 2.52 outlier 7.59 Sample 41 8.73 outlier 9.80
Sample 16 3.69 3.53 4.51 Sample 42 4.22 4.58 2.96
Sample 17 12.42 11.56 8.44 Sample 43 7.59 8.21 10.65
Sample 18 10.86 10.70 9.95 Sample 44 0.49 1.08 0.54
Sample 19 12.67 12.67 11.26 Sample 45 0.00 0.00 0.00
Sample 20 2.69 3.46 4.63 Sample 46 0.00 0.00 0.00
Sample 21 0.10 0.70 0.02 Sample 47 0.00 0.00 0.00
Sample 22 0.00 0.61 0.16 Sample 48 0.00 0.00 0.00
Sample 23 0.00 0.00 0.00 Sample 49 0.00 0.12 0.11
Sample 24 0.00 0.00 0.00 Sample 50 0.00 0.95 0.00
Sample 25 0.00 0.26 0.04 Sample 51 0.00 0.00 0.00
Sample 26 0.00 0.00 0.00 Sample 52 0.00 0.31 0.00
Note: Sample 14, 15, and 41 were outliers determined by Monte Carlo sampling approach in the result of PLS model
4 Conclusions
In this study, a method with PLS model based spectrum analysis was proposed to measure the UAV spraying pattern more accurately, and spraying experiments were conducted in the field to verify the effectiveness of the method. The main conclusions are as follows:
(1) The method involved the steps of fluorescent tracer solution spray and its droplets collection, the spectrum on paper
strip acquiring, spectrum processing and analysis, PLS modeling. And the method can measure the UAV spraying pattern effectively.
modeling.
(3) PLS model was established based on the normalized intensity of 12 sensitive wavelengths, and LR model was established based on the average spectral intensity value of 485-495 nm. The result indicates that the PLS model for UAV spraying pattern measurement has more accuracy than that of the LR model with a better performance of RV2=0.94, RMSEP=0.9446.
(4) The method with PLS model based spectrum analysis provides a new way for the measurement of UAV spray pattern. However, only some preliminary researches for this method were conducted in this study and the accuracy of UAV spraying pattern measurement could be affected by many factors, such as the fluorescent tracer solution concentration, the influences of sprayed chemicals on the excitation and emission wavelengths of the fluorescent tracer, and the integral time of the spectrometer. In future work, further experiments are required to study as many influencing factors as possible to optimize the model for UAV spraying pattern measurement, so that the measurement model can satisfy the evaluation requirements for the high robustness and detection accuracy in different complex conditions.
Acknowledgements
This study was supported by Zhang Ruirui's Beijing Nova Program (No.Z181100006218029), National Natural Science Foundation of China (31601228), BAAFS' Innovation Ability Construction Program 2018 (No.KJCX20180424), National Key R&D Program of China (2016YFD0200701-2).
[References]
[1] Zhou Z Y, Zang Y, Luo X W, Lan Y B, Xue X Y. Technology innovation development strategy on agricultural aviation industry for plant protection in China. Transactions of the CSAE, 2013; 29(24): 1–10. [2] Huang Y B, Thomson S J, Hoffmann W C, Lan Y B, Fritz B K.
Development and prospect of unmanned aerial vehicle technologies for agricultural production management. Int J Agric & Biol Eng, 2013; 6(3): 1–10.
[3] Tang Q, Zhang R R, Chen L P, Xu M, Yi T C, Zhang B. Droplets movement and deposition of an eight-rotor agricultural UAV in downwash flow field. Int J Agric & Biol Eng, 2017; 10(3): 47–56.
[4] Li J Y, Lan Y B, Wang J W, Cheng S D, Huang C, Liu Q, et al. Distribution law of rice pollen in the wind field of small UAV. Int J Agric & Biol Eng, 2017; 10(4): 32–40.
[5] Jensen P K, Olesen M H. Spray mass balance in pesticide application: A review. Crop Protection, 2014; 61: 23–31.
[6] Zhu H, Salyani M, Fox R D. A portable scanning system for evaluation of spray deposit distribution. Computers and Electronics in Agriculture, 2011; 76(1): 38–43.
[7] Ferguson J C, Chechetto R G, O'Donnell C C, Fritz B K, Hoffmann W C, et al. Assessing a novel smartphone application-SnapCard, compared to five imaging systems to quantify droplet deposition on artificial collectors. Computers and Electronics in Agriculture, 2016; 128: 193–198.
[8] Chen S D, Lan Y B, Li J Y, Zhou Z Y, Jin J, Liu A M. Effect of spray parameters of small unmanned helicopter on distribution regularity of droplet deposition in hybrid rice canopy. Transactions of the CSAE, 2016; 32(17): 40–46.
[9] Zhang S C, Xue X Y, Qin W C, Sun Z, Ding S M, Zhou L X. Simulation and experimental verification of aerial spraying drift on N-3 unmanned spraying helicopter. Transactions of the CSAE, 2015; 31(3): 87–93. [10] Wang L, Lan Y B, Hoffmann W C, Fritz B K, Chen D, Wang S M.
Design of variable spraying system and influencing factors on droplets deposition of small UAV. Transactions of the CSAM, 2016; 47(1): 15–22.
[11] Wang X N, He X K, Song J L, Wang Z C, Wang C L, Wang S L, et al. Drift potential of UAV with adjuvants in aerial applications. Int J Agric & Biol Eng, 2018; 11(5): 54–58.
[12] Xue X Y, Tu K, Qin W C, Lan Y B, Zhang H H. Drift and deposition of
ultra-low altitude and low volume application in paddy field. Int J Agric & Biol Eng, 2014; 7(4): 23–28.
[13] Duga A T, Delele M A, Ruysen K, Dekeyser D, Nuyttens D, et al. Development and validation of a 3D CFD model of drift and its application to air-assisted orchard sprayers. Biosystems Engineering, 2017; 154: 62–75.
[14] Zhang B, Tang Q, Chen L P, Zhang R R, Xu M. Numerical simulation of spray drift and deposition from a crop spraying aircraft using a CFD approach. Biosystems Engineering, 2018; 166: 184–199.
[15] Yuan X, Qi L J, Ji R H, Zhang J H, Wang H, Huang S K. Analysis on features of air-velocity distribution and droplets deposition pattern for greenhouse air-assisted mist sprayer. Transactions of the CSAM, 2012; 43(8): 71–77.
[16] Kesterson M A, Luck J D, Sama M P. Development and Preliminary Evaluation of a Spray Deposition Sensing System for Improving Pesticide Application. Sensors, 2015; 15(12): 31965–31972.
[17] Zhang R R, Chen L P, Lan Y B, Xu G, Kan J, Zhang D Y. Development of a deposit sensing system for aerial spraying application. Transactions of the CSAM, 2014; 45(8): 123–127.
[18] Zhang H H, Lan Y B, Lacey R, Hoffmann W C, Martin D E, Fritz B, et al. Ground-based spectral reflectance measurements for evaluating the efficacy of aerially-applied glyphosate treatments. Biosystems Engineering, 2010; 107(1): 10–15.
[19] Lv M Q, Xiao S P, Tang Y, He Y. Influence of UAV flight speed on droplet deposition characteristics with the application of infrared thermal imaging. Int J Agric & Biol Eng, 2019; 12(3): 10–17.
[20] Bae Y, Koo Y M. Flight attitudes and spray patterns of a roll-balanced agricultural unmanned helicopter. Applied Engineering in Agriculture, 2013; 29(5): 675–682.
[21] Zhang D Y, Lan Y B, Wang X, Zhou X G, Cheng L P, Li B, et al. Assessment of aerial agrichemical spraying effect using moderate-resolution satellite imagery. Spectroscopy and Spectral Analysis, 2016; 36 (6): 1971–1977.
[22] Zheng Y J, Yang S H, Lan Y B, Hoffmann C, Zhao C J, Chen L P, et al. A novel detection method of spray droplet distribution based on LIDARs. Int J Agric & Biol Eng, 2017; 10(4): 54–65.
[23] Zhang R R, Wen Y, Yi T C, Cheng L P, Xu G. Development and application of aerial spray droplets deposition performance measurement system based on spectral analysis technology. Transactions of the CSAE, 2017; 33(24): 80–87.
[24] Wen Y, Zhang R R, Cheng L P, Huang Y B, Yi T C, Xu G, Li L L, Andrew J H. A new spray deposition pattern measurement system based on spectral analysis of a fluorescent tracer. Computers and Electronics in Agriculture, 2019; 160: 14–22.
[25] Yang X W, Zhou J Z, He X Q, Herbst A. Influences of nozzle types on pesticide deposition and insecticidal effect to wheat aphids. Transactions of the CSAE, 2012; 28(7): 46–50.
[26] Xu G, Chen L P, Zhang R R. An image processing system for evaluation of aerial application quality. International Conference on Intelligent Information Processing. ACM, 2016.10.1145/3028842.3028895 [27] Hou P G, Li N , Chang J, Wang S T, Song T. Research on analysis of oil
in water based on the joint optimization of Savitzky-Golay smoothing and IBPLS models. Spectroscopy and Spectral Analysis, 2015; 35(6): 1529–1533.
[28] Kamruzzaman M, Makino Y, Oshita S. Rapid and non-destructive detection of chicken adulteration in minced beef using visible near-infrared hyperspectral imaging and machine learning. Journal of Food Engineering, 2016; 170(7): 8–15.
[29] Hodge V J, Austin J. A Survey of Outlier Detection Methodologies. Artificial Intelligence Review, 2004; 22(2): 85–126.
[30] Cao D S, Liang Y Z, Xu Q S, Li H D, Chen X. A new strategy of outlier detection for QSAR/QSPR. Journal of Computational Chemistry, 2010; 31(3): 592–602.
[31] Li H D, Xu Q S, Liang Y Z. libPLS: An integrated library for partial least squares regression and linear discriminant analysis. Chemometrics and Intelligent Laboratory Systems, 2018; 176: 34–43.
[32] Li H D, Xu Q S, Liang Y Z. Random frog: an efficient reversible jump Markov Chain Monte Carlo-like approach for variable selection with applications to gene selection and disease classification. Analytica Chimica Acta, 2012; 740: 20–26.