Modification of colorimetric method based digital soil test kit for
determination of macronutrients in oil palm plantation
Muhammad Yamin
1,2,
Wan Ishak bin Wan Ismail
2,
Muhamad Saufi bin Mohd Kassim
2,
Samsuzana Binti Abd Aziz
2,
Farah Naz Akbar
3,
Redmond R. Shamshiri
4*,
Muhammad Ibrahim
5,
Benjamin Mahns
4(1. Department of Farm Machinery & Power, Faculty of Agricultural Engineering & Technology, University of Agriculture, Faisalabad (38040) Pakistan;
2. Department of Biological and Agricultural Engineering, Faculty of Engineering, Universiti Putra Malaysia, 43400 UPM Serdang, Selangor, Malaysia;
3. Department of Allied Health Sciences, Sargodha Medical College, University of Sargodha (40100) Pakistan; 4. Leibniz Institute for Agricultural Engineering and Bioeconomy, Max-Eyth-Allee 100, 14469 Potsdam-Bornim, Germany;
5. Department of Environmental Sciences & Engineering, Government College University Faisalabad (38000) Pakistan)
Abstract: It is the need of time that oil palm farmers must perform the spatially planned soil analysis to know about the fertilizer sufficient and deficient zones of land. Colorimetric method is a suitable and fast solution of soil analysis for NPK determination using the digital soil test kit. NPK determination procedure with a digital soil test kit was undefined for oil palm. Furthermore, the digital soil test kit determines the passage of light through an opaque medium of soil solution with a specified reagent. Therefore, environmental light may interfere leading to wrong results of NPK measurement. Likewise, this equipment was non-incorporable with the controller of any VRT fertilizer applicator. In this research, these issues were addressed and the NPK measurement procedure was defined for oil palm plantation by modifying the ‘soil to water’ ratio in sample soil solution with an optimum environmental light range of 18-23 W/m2. ‘Soil to water’ ratios were found for nitrogen, phosphorus and potassium as 0.31 to 5.00, 1.00 to 5.00 and 4.50 to 5.00, respectively to fit the requirement of NPK for oil palm in the prescribed range of the equipment. Validation study of modified digital soil test kit showed that 91.7% N, 89.6% P and 93.8% K results of modified digital soil test kit were matched with analytical laboratory method. Thus, the reliability of NPK results using digital soil test kit was enhanced, making the kit incorporable with the controller of variable rate fertilizer applicator through remote monitoring based data acquisition system. The outcome of this research can be used in the development of an IoT network data fusion for dynamic assessment of the NPK variation in the soil and nutrient management in oil palm plantations.
Keywords: digital soil test kit, variable rate fertilizer applicator, oil palm, NPK measurement, data acquisition system, colorimetric method
DOI: 10.25165/j.ijabe.20201304.5694
Citation: Yamin M, Ismail W I W, Kassim M S M, Aziz S B A, Akbar F N, Shamshiri R R, et al. Modification of colorimetric method based digital soil test kit for determination of macronutrients in oil palm plantation. Int J Agric & Biol Eng, 2020; 13(4): 188–197.
1 Introduction
Soil testing is an important part of soil and plant nutrient
Received date: 2020-01-16 Accepted date: 2020-05-13
Biographies:Muhammad Yamin, PhD, Lecturer, research interest: agricultural
mechanization and automation, Email: [email protected]; Wan Ishak bin
Wan Ismail, PhD, Professor Emeritus, research interest: agricultural
mechanization and automation, Email: [email protected]; Muhamad
Saufi bin Mohd Kassim, PhD, Senior Lecturer, research interest: agricultural
mechanization and automation, Email: [email protected]; Samsuzana Binti
Abd Aziz, PhD, Associate Professor, research interest: precision agriculture,
Email: [email protected]; Farah Naz Akbar, MS, Lecturer, research interest: Nutrition Science, Email: [email protected]; Muhammad Ibrahim,
PhD, Associate Professor, research interest: soil science, Email: mibrahim@ gcuf.edu.pk; Benjamin Mahns, PhD, research interests: spectroscopy, soil sensing, Email: [email protected].
*Corresponding author: Redmond R. Shamshiri, PhD, research interests:
digital agriculture, LPWAN sensors, simulation. Leibniz-Institut für Agrartechnik und Bioökonomie, Max-Eyth-Allee 100, 14469 Potsdam, Germany. Tel: +49(0)331-5699422, Email: [email protected].
management. It is a standard practice for the farmers to analyze the soil and specify the required amount of fertilizer for application in the field manually or by Variable Rate Technology (VRT) fertilizer applicators[1]. Soil analysis is the first step toward mapping the amount of macronutrients in the farm. According to the crop plant requirement, farmers or VRT fertilizer application system can compute the needed amount of fertilizer to avoid the under or overdose of nutrients. Among the macronutrients, nitrogen is required for protein formation, chlorophyll synthesis and photosynthesis. Its deficiency reduces the use of solar radiation and impairs nutrient uptake. Phosphorus is used by the plant for root growth its deficiency means the restricted root growth, which leads to the overall growth of the plant. While potassium is important for the transport of assimilates of photosynthesis and enzyme activation. The deficiency of potassium may lead to the abnormality of the mentioned process[2].
Globally, total fertilizer nutrient (N+P2O5+K2O) consumption
fertilizers play important roles in the protective growth of crops and ultimately in terms of higher yields in the capacity of crop production and soil fertility. But continuously uniform application of fertilizers above optimum not only increases the cost of production but also raises a big environmental threat in terms of soil and ground water contamination[4-8].
Nutrient levels that are above optimum do not improve plant growth. Above optimum, nitrogen and phosphorus levels can lead to excessive plant and algal growth in waterways that can degrade drinking water, fisheries and causes methemoglobinemia: anemia, cardiovascular disease, lung disease, sepsis, glucose-6-phosphate- dehydrogenase deficiency, and other metabolic problems in humans[9]. High potassium can lead to an imbalance of base saturation levels as well as high soluble salts. In humans, it causes kidney disease or other conditions, such as heart disease, coronary artery disease, hypertension, diabetes, adrenal insufficiency and pre-existing hyperkalemia[10,11].
Therefore, it is the need of time that farmers must perform the spatially planned soil analysis for macronutrients regularly to know about the fertilizer sufficient and deficient zones of land. But unfortunately, for a good number of soil samples, the cost of soil analysis for NPK in the laboratory is not affordable for most of the farmers. Also, the laboratory methods take a longer time to analyze macronutrients depending upon the number of soil samples while field scenarios can be changed during the time.
Especially, the oil palm farmers face this problem because most of the oil palm plantations in Malaysia have unleveled areas and with the rain water, nutrients may wash very easily and accumulate in lower areas (PPI 2018)[12,13]. Therefore, oil palm growers require an inexpensive, quick, on-the-spot and reliable technique to determine the soil nutrient conditions and apply the desired nutrient in fertilizer deficient zone manually or more efficiently with the help of variable rate fertilizer applicator[2,14-16].
Ion Selective Electrodes (ISE) have good accuracy up to 95%[17] to analyze the soil fast and accurate[18] but five of the main hindrances prevent the farmers from using the ISE method; one, costly equipment and secondly, there are ISE commercially available for N and K but not for P. Thirdly, these equipment need regular calibration with their standard solutions. On the fourth, the sensors installed in equipment have a certain life and can be damaged if not maintained properly. Fifth, ISE equipment has no interfacing system with the controllers of VRT applicators. Other soil nutrient sensing technologies like Near-Infrared Reflectance Spectroscopy (NIRS) and REFS (Reflectance Spectroscopy) are expensive; involve site-specific calibration; require skills to operate and interpret the data[19].
The colorimetric method can be a good alternate for an inexpensive and quick on-the-spot analysis of soil for NPK and may give a good estimation of NPK in accordance with the laboratory method. Many soil test kits are available commercially with color card aid. Therefore, during the color matching process, the accuracy of kit varies from person to person. Luster Leaf, USA, introduced a digital soil test kit (1605 Rapitest Digital Soil Test kit) which can determine NPK of soil for various plants except for oil palm by colorimetric method. NPK determination procedure with this equipment was undefined for oil palm plantation because oil palm needs different amounts of NPK nutrients that do not fit for most of the plants. Therefore, this equipment cannot be used in oil palm plantation.
This equipment uses Light Emitting Diode (LED) based technology and determines the passage of light through an opaque medium developed by the soil solution and specified reagent. Therefore, environmental light may mix with LED light of equipment and affects the results. But the developer does not specify any light conditions to determine NPK by using this equipment. Therefore, in various environmental light conditions, this equipment can give wrong results of NPK. Furthermore, the electronic design of this equipment does not permit the interfacing with any VRT fertilizer applicator to transmit the NPK results directly to the standalone VRT fertilizer applicator.
In this study, the above mentioned issues were resolved by redefining the new NPK measurement levels for the soil of oil palm plantation. Secondly, experiments for establishing the appropriate environmental light conditions were also conducted for adoption in NPK measurement using the digital soil test kit. This enhanced the reliability of NPK measurement results using this equipment. Further, this paper defines the interfacing technique of digital soil test kit with the controller of VRT fertilizer applicators using a newly developed data acquisition system. This system offers a unique remote monitoring approach of recording the NPK results from the existing digital soil test kit. In the end, the modified digital soil test kit was tested to validate new NPK measurement levels in the soil of oil palm plantation with defined environmental light conditions. Thus, the paper explains a definite solution so that oil palm growers can find an easy, quick and reliable way for better nutrient management in their plantations manually or with VRT fertilizer applicators.
2 Material and methods
2.1 Soil fertility standards for oil palm
The International Plant Nutrition Institute has fixed the general application rates for nitrogen, phosphorus (P2O5) and potassium
(K2O) based on Fresh Fruit Bunch (FFB) analysis. These
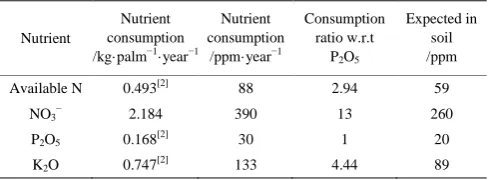
application rates have been mentioned in the ‘nutrient consumption’ column of Table 1. Table 1 also shows the calculated standards for oil palm nutrition in the form of expected nutrients concentration in the soil and nutrient consumption ratios.
Table 1 Macronutrients required by oil palm based on FFB analysis
Nutrient
Nutrient consumption /kg·palm−1·year−1
Nutrient consumption
/ppm·year−1
Consumption ratio w.r.t
P2O5
Expected in soil /ppm
Available N 0.493[2] 88 2.94 59
NO3− 2.184 390 13 260
P2O5 0.168[2] 30 1 20
K2O 0.747[2] 133 4.44 89
2.2 Colorimetric method and soil fertility
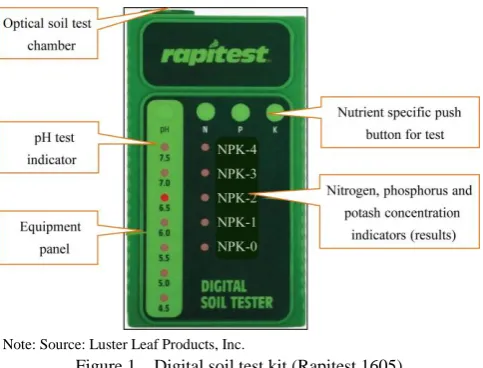
2.2.1 Digital soil test kit (Rapitest 1605)
Since the digital soil test kit (DSTK) shown in Figure 1 measures nitrogen as nitrate (NO3
−
), phosphorus as P2O5 and
potassium as K2O. It employs LED technology for the
determination of the NPK using the colorimetric method. Luster leaf, USA, described the measurement levels (categorical values) of NO3−, P2O5 and K2O for DSTK as shown in Table 2.
down in the next 10-15 min after stirring, the clear liquid is taken in an appropriate test tube with respective reagent and shaken. It takes approximately 10 min to develop color in the test tube. Then the test tube is inserted into the optical soil test chamber of digital soil test kit and the level of the respective nutrient is noted by pushing the specified button for the test. These steps are followed for nitrogen, phosphorus and potassium tests.
Note: Source: Luster Leaf Products, Inc.
Figure 1 Digital soil test kit (Rapitest 1605)
Table 2 Original measurement levels of digital soil test kit
Nitrogen level N4 N3 N2 N1 N0
NO3− (ppm) 80 40 20 10 0
Phosphorus level P4 P3 P2 P1 P0
P2O5 (ppm) 100 50 20 10 5
Potash level K4 K3 K2 K1 K0
K2O (ppm) 900 600 400 200 50
Source: Luster Leaf Products, Inc.
2.2.2 Modification of soil testing procedure for oil palm plantation
In this study, the NPK determination procedure was defined for oil palm by specifying the soil and water ratio in the sample solution. The standard ratio of ‘soil to water’ in sample solution for NPK was 1 to 5 for this kit, but for oil palm plantation, this ratio cannot work because of the range limitation of the digital soil test kit. Table 1 shows that the normal value of NO3− for oil palm
plantation is 260 ppm, which is out of the range of digital soil test kit (Table 2). Therefore the dilution method was used to reduce the ratio of ‘soil to water’ in the sample solution. The dilution method brought the nitrogen measurement within the range of equipment, i.e. 0-80 ppm. Similarly, Table 1 shows that the normal value of K2O for oil palm plantation is 89 ppm, which is
too little to indicate properly by digital soil test kit (Table 2). Therefore, the concentration method was used to increase the ratio of ‘soil to water’ in the sample solution. The concentration method brought the K2O measurement within the range of
equipment properly while P2O5 measurement can be indicated by
the equipment properly without alteration of ‘soil to water’ ratio in the sample solution.
2.2.3 Determination of appropriate light conditions for digital soil test kit
The digital soil test kit uses a bi-color LED as a light source for detecting the passage of light from the solution of soil extract and reagent taken in a test tube. For NO3− test, the green light of
565 nm wavelength is used while the red light of 633 nm is used in the determination of P2O5 and K2O. Soil test results from the
digital soil test kit are affected by mixing of environmental light radiation with the source light of LED. The developer of the kit did not declare the environmental light range for the measurement of NPK using DSTK. Therefore, it is important to determine the appropriate environmental light radiation range for NPK tests. For this purpose, eight different concentration solutions (7, 13, 17, 23, 37, 43, 77 and 85 ppm) from Horiba nitrate calibration solution of 2000 ppm were prepared using the dilution method. These concentrations fall in the range of digital soil test kit from N0-N4. Similarly, eight different concentration solutions (190, 210, 390, 410, 590, 610, 890 and 910 ppm) from Horiba potassium calibration solution of 2000 ppm were prepared to range between K0-K4. While for phosphorus, H3PO4 (85%) solution was used to
develop further 7, 13, 17, 23, 47, 53, 97 and 105 ppm solutions. It is worth considering that plants absorb phosphorus in the form of H2PO4−, HPO42− and PO43− ions which are generated from
phosphoric acid (H3PO4).
Each group of ten different concentration solutions was tested using a digital soil test kit under the environmental (solar based) radiations of 15-26 W/m2 (+0.5) with an increment of 1 W/m2 (+0.5) and data was recorded as shown in Figure 2. It is worth mentioning that environmental light enters from the cap of the test tube, therefore, it must be monitored near the cap of test tube inserted in the optical soil test chamber of DSTK as shown in Figure 2.
Figure 2 Light conditions for digital soil test kit 2.2.4 Development of the ‘digital soil test data acquisition system’ for VRT controllers
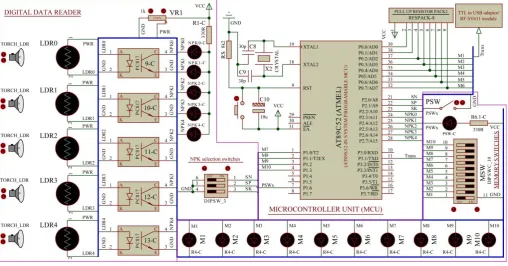
In the original form, a digital soil test kit cannot be integrated with any VRT fertilizer applicator. Thus, soil fertility results cannot be automatically transferred to any VRT controller or computer. Instead a manual procedure is adopted. To eliminate this deficiency, an 8-bit data acquisition system based on Light Dependent Resistor (LDR) was developed which offers a unique remote monitoring approach for recording NPK results from the existing digital soil test kit. It was made possible by installing 5 photocells/light dependent resistors (LDRs) against LED indicators of NPK concentrations in existing digital soil test kit without altering its original circuit or algorithm as shown in Figure 3. A digital data reader (Figure 3 and Figure 4) was also designed as a segment of the data acquisition system which reads NPK results from digital soil test kit using LDRs and transmits to the controller of the variable rate liquid fertilizer applicator for oil palm.
of all LDRs are connected with pin 1 of respective opto-couplers as shown in Figure 4. Pin 4 of all opto-couplers are connected to signal cables attached to an AT89S52 microcontroller while 2 and 3 number pins are connected to the ground. When any of DSTK LEDs of NPK concentration is turned on, the resistance of respective LDR is reduced and triggering voltages are supplied to respective opto-coupler to turn it on. Thus the respective I/O line of AT89S52 microcontroller is grounded in the result of above mentioned action and AT89S52 microcontroller can recognize which LED has been turned on for which concentration of N, P or K (Figure 4).
Figure 3 Addition of LDRs in digital soil test kit
Figure 4 Schematic design of digital soil test data acquisition system Thirty memory locations in the AT89S52 microcontroller were
reserved to store ten results of N, P and K each. These memory locations are selectable by the user using memory switches. AT89S52 microcontroller employed NPK programming switch (PSWx) to record NPK results from digital soil test kit using the following algorithm (Figure 5). ‘R0’ is a register in the microcontroller which was used to pick the N, P or K results, one by one from digital soil test kit and save it to respective memory location allocated for the purpose with the help of accumulator. When ‘PSWx’ is put to a low level signal, microcontroller searches for selected memories out of thirty allocated memories and stores the address of selected memory in ‘R0’. N, P or K result is received in the accumulator from the digital soil test kit and saved to a respective memory location for transmission to the VRT controller with simple TTL to USB converter cable. This frees the researchers and farmers to record and upload the data manually in electronic controllers of variable rate fertilizer applicator eliminating the chance of data handling error. The performance and functionality of the electronic board were evaluated and approved by Adaptive AgroTech Consultancy Int laboratory in Germany.
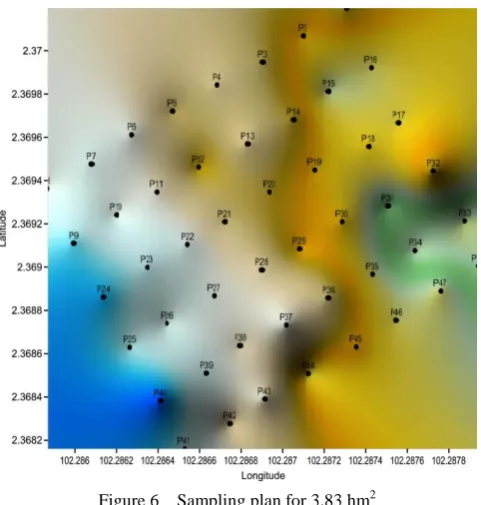
2.2.5 Testing of modified digital soil test kit in oil palm plantation A comprehensive soil study was performed in an oil palm plantation, United Melaka Bhd. (UMB), to validate the NPK
concentrations measured with the help of modified digital soil test kit by comparing with laboratory results and map the NPK status in
the study area. For this purpose, United Melaka Bhd. allocated 3.83 hm2 of oil palm plantation. 48 soil samples were collected from the allocated plantation in the grid format up to the depth of 25 cm. Two sub-samples were collected from each spot and then mixed to make one soil sample of 500-600 g. Sampling points are marked by symbols P1-P48 in Figure 6. Each soil sample was divided into two parts of 250 g and 250-300 g making two groups of 48 soil samples.
Figure 6 Sampling plan for 3.83 hm2
The first group of 48 soil samples was sent for NPK testing to the research department of United Plantations Bhd. (UP), which took about 45 d for completing NPK tests using standard laboratory procedures. During this long time taking analysis, the NPK scenario in the soil of oil palm plantation may change considerably and may not be useful for accurate fertilizer applicator using variable rate fertilizer applicator. Another group of soil samples was tested with the help of a digital soil test kit using a modified procedure for NPK testing (Figure 7). This testing took about 8 h of time. Laboratory and DSTK results were compared to validate the modified procedure in defined light conditions.
Figure 7 NPK testing with digital soil test kit
3 Results and discussion
3.1 Modified NPK testing procedure for oil palm and light conditions
Ignoring the standard ‘soil to water’ ratios for N, P and K
testing procedure, three different ‘soil to water’ ratios were defined for nitrate (NO3−), phosphorus (P2O5) and potassium (K2O) as 0.31
to 5, 1 to 5 and 4.5 to 5 respectively to fit the NPK requirement of oil palm in the capacity of the equipment. Figure 8 describes the modified NPK testing procedure for oil palm. It follows the standard steps described in section ‘0’ except the standard soil to water ratio.
Figure 8 Modified NPK testing procedure for oil palm These new ‘soil to water’ ratios helped to redefine the measurement levels of digital soil test kit for the soil of oil palm plantation as presented in Table 3. For NO3− measurement,
redefined measurable levels are 0, 32, 65, 130 and >260 ppm. While, for P2O5, there is no change in measurable levels because
existing levels satisfy the measurement of phosphorus in the soil of oil palm plantations. Moreover, potash levels in terms of K2O
were also redefined as 11, 44, 89, 133 and >200 ppm. Thus, NO3−,
P2O5 and K2O concentrations required in the soil of oil palm
plantation fall in the range of digital soil test kit.
Table 3 Redefined measurement levels of digital soil test kit for the soil of oil palm plantation
Nitrogen level N4 N3 N2 N1 N0
NO3- (ppm) 260 130 65 32 0
Phosphorus level P4 P3 P2 P1 P0
P2O5 (ppm) 100 50 20 10 5
Potash level K4 K3 K2 K1 K0
K2O (ppm) 200 133 89 44 11
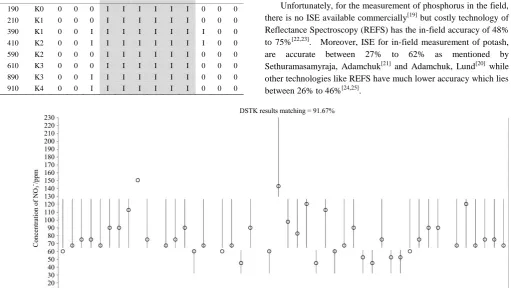
Further, for the modified procedure, determined appropriate light conditions are shown in Table 4 to Table 6 where ‘I’ represents matched result with known concentration while ‘0’ represents mismatch. For NO3− determination, the optimum
environmental light range was found as 18-22 W/m2. The ranges for P2O5 and K2O measurements were 18-21 W/m2 and 18-
Table 4 Light conditions for digital soil test kit during nitrate test
NO3− /ppm
DSTK level
Solar radiation (W·m−2) + 0.5
15 16 17 18 19 20 21 22 23 24 25 26
7 N0 0 0 0 I I I I I I 0 0 0
13 N1 0 0 0 I I I I I I 0 0 0 17 N1 0 0 0 I I I I I 0 0 0 0 23 N2 0 I I I I I I I 0 0 0 0 37 N2 0 0 0 I I I I I 0 0 0 0 43 N3 0 0 I I I I I I 0 I 0 0 77 N3 0 0 0 I I I I I 0 0 0 0 85 N4 0 0 I I I I I I 0 0 0 0 Table 5 Light conditions for digital soil test kit during P2O5
test
P2O5 /ppm
DSTK level
Solar radiation (W·m−2) + 0.5
15 16 17 18 19 20 21 22 23 24 25 26
7 P0 0 0 I I I I I 0 0 0 0 0
13 P1 0 0 0 I I I I 0 0 0 0 0 17 P1 0 0 0 I I I I I 0 0 0 0 23 P2 0 0 0 I I I I 0 0 0 0 0 47 P2 0 0 I I I I I I I 0 0 0 53 P3 0 0 0 I I I I I 0 0 0 0 97 P3 0 0 0 I I I I 0 0 0 0 0 105 P4 0 0 0 I I I I 0 0 0 0 0 Table 6 Light conditions for digital soil test kit during K2O
test
K2O ppm
DSTK level
Solar radiation (W·m−2) + 0.5
15 16 17 18 19 20 21 22 23 24 25 26 190 K0 0 0 0 I I I I I I 0 0 0 210 K1 0 0 0 I I I I I I 0 0 0 390 K1 0 0 I I I I I I I I 0 0 410 K2 0 0 I I I I I I I I 0 0 590 K2 0 0 0 I I I I I I 0 0 0 610 K3 0 0 0 I I I I I I 0 0 0 890 K3 0 0 I I I I I I I 0 0 0 910 K4 0 0 I I I I I I I 0 0 0
3.2 Validation results of soil tests using modified digital soil test kit
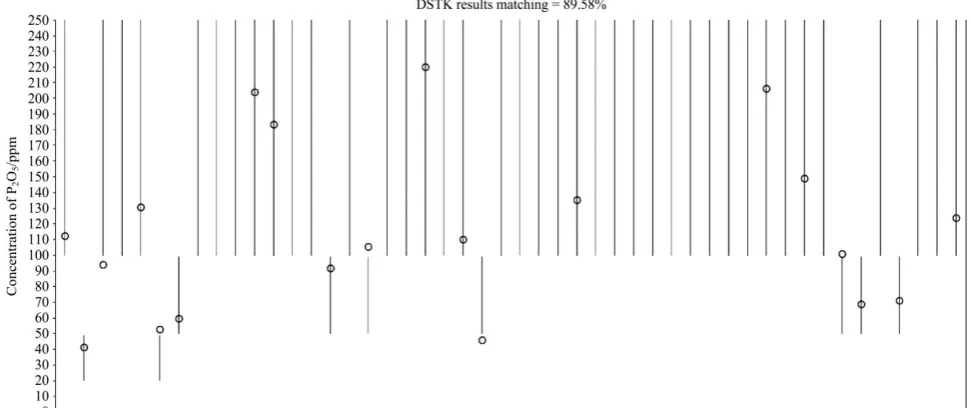
The results for nitrogen tests have been shown in Figure 9. Digital soil test kit showed good performance as its results were 91.67% matched with analytical laboratory tests. Although the digital soil test kit measures NPK in range spans, even then it helps for very good NPK estimation in a short time. For phosphorus tests, the digital soil test kit performed well by matching its results 89.58% with laboratory tests (Figure 10). Similarly, DSTK results for potassium tests were matched 93.75% with analytical laboratory results (Figure 11). These results are in line with the findings of Faber, Downer[1] who found the Rapitest kit most
suitable for determining NO3−, P2O5 and K2O in comparison with
Quick Soil Test kit and La Motte Soil Test kit. This also proved that defined environmental light conditions worked to enhance the reliability of Rapitest digital soil test kit results.
Faber, Downer[1] also endorsed that Rapitest kit is a fast and economic mean by which farmers and agricultural service personnel can improve nutrient management for crop production and environmental protection. On the other hand, Adsett, Thottan[17] reported that Ion Selective Electrode (ISE) is although a fast and 95% accurate for measuring NO3− but it requires
calibration with a known concentration of NO3 −
solution. Further, ISE has limited life and comparatively costly equipment. The study of Adamchuk, Lund[20] differs from the findings of Adsett, Thottan[17] describing that a variety of ISEs in Direct Soil Measurement (DSM) applications are 24% to 35% limiting its use in the field. Other researchers like Sethuramasamyraja, Adamchuk[21] supported the findings of Adamchuk, Lund[20] by mentioning the accuracy of ISEs between 14% to 32% for NO3−
measurement in DSM application.
Unfortunately, for the measurement of phosphorus in the field, there is no ISE available commercially[19] but costly technology of Reflectance Spectroscopy (REFS) has the in-field accuracy of 48% to 75%[22,23]. Moreover, ISE for in-field measurement of potash, are accurate between 27% to 62% as mentioned by Sethuramasamyraja, Adamchuk[21] and Adamchuk, Lund[20] while other technologies like REFS have much lower accuracy which lies between 26% to 46%[24,25].
Figure 10 Laboratory and digital soil test kit analysis of soil samples for P2O5
Figure 11 Laboratory and digital soil test kit analysis of soil samples for K2O
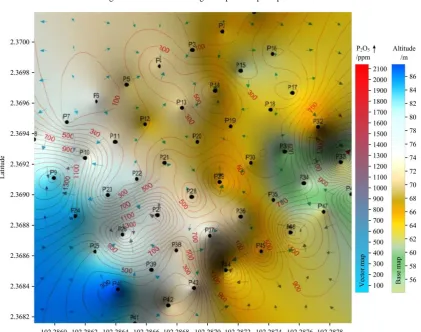
Figure 12 to Figure 14 are geographic representations of UMB soil analysis results (Figure 9 to Figure 11) in the form of NPK contour and vector overlay maps. It is depicted from Figure 12 that nitrogen was deficient on all points except P11, P17, P22 and P42 where it was 2-3 times higher than the required 59 ppm for oil palm plantation (Table 1). Hatched contours in Figure 12 show the normal concentration of available nitrogen. On the other hand, phosphorus was found to be extremely high in the field ranging between 41.2-2192.8 ppm (Figure 13). Figure 14 indicates the mixed situation of low and high concentrations of potassium in oil
palm plantation. But maximum of 770.5 ppm of K2O was found
Figure 12 Available nitrogen map for oil palm plantation
Figure 14 K2O map for oil palm plantation
4 Conclusions
This study revealed that the colorimetric method is an appropriate and inexpensive solution of quick on-the-spot soil analysis for NPK measurement using the digital soil test kit. It gives a good estimation of NPK in accordance with the analytical laboratory method. Modification in digital soil test kit made it valuable be employed for NPK measurement in the soil of oil palm, provided that redefined ‘soil to water’ ratios and demarcated environmental light conditions for the testing of NPK are adopted. Newly defined environmental light conditions enhanced the reliability of NPK measurement results which were matched more than 89% with analytical laboratory tests. NPK status maps revealed that phosphorus was over-applied in the field which was not really desirable for oil palm and may cause environmental pollution with an increase in the overall production cost. Future research may involve interfacing the presented system with a wireless connectivity board to develop an IoT network data fusion for dynamic assessment of the NPK variation in the soil and nutrient management in oil palm plantations.
Acknowledgements
This research was supported by Universiti Putra Malaysia in coordination of United Melaka Bhd. (UMB). We thank CEO and Farm Manager of United Melaka Bhd. who provided the field support.
[References]
[1] Faber B A, Downer A J, Holstege D, Mochizuki M J. Accuracy varies for commercially available soil test kits analyzing nitrate–nitrogen,
phosphorus, potassium, and pH. HortTechnology, 2007; 17(3): 358–362.
[2] Rankine I, Fairhust T H. Field handbook: Oil palm series volume 3-mature. Singapore PPI/PPIC. 1999; 134p.
[3] FAO. World fertilizer trends and outlook to 2020. FAO, United Nations, 2017; 27p.
[4] Tung P G A, Yusoff M K, Majid N M, Joo G K, Huang G H. Effect of N and K fertilizers on nutrient leaching and groundwater quality under mature oil palm in Sabah during the monsoon period. American Journal of Applied Sciences, 2009; 6(10): 1788–1799.
[5] Kim Y J, Kim H J, Ryu K H, Rhee J Y. Fertiliser application performance of a variable-rate pneumatic granular applicator for rice production. Biosystems Engineering, 2008; 100(4): 498–510. [6] Cugati S A, Miller W M, Schueller J K, Schumann A W. Dynamic
characteristics of two commercial hydraulic flow-control valves for a variable-rate granular fertilizer spreader. Portland: ASAE, 2006; 061071. doi: 10.13031/2013.20596.
[7] Wahid M B, Abdullahi S N A, Henson I E. Oil palm-Achievements and potential. Plant Production Science, 2005; 8(3): 288–297. [8] Wittry D J, Mallarino A P. Comparison of uniform and variable rate
phosphorus fertilizer for corn-soybean rotation. Agronomy Journal, 2004; 96(1): 26–33.
[9] ATSDR. Case Studies in Environmental medicine: nitrate/nitrite toxicity. Agency for Toxic Substances and Disease Registry Atlanta; 2013.
[10] WHO. Potassium in drinking-water: background document for development of WHO guidelines for drinking-water quality. Geneva: World Health Organization, 2009; pp.2–4.
[11] Magen H. Potassium chloride in fertigation. Proc 7th Int Conference on Water and Irrigation Tel Aviv, Israel: ICL Fertilizers, 1996; pp.13–16.
[12] MPCA. Responsible fertilizing tip sheet metro watershed partners minnesota water: Let’s keep it clean. Minnesota Pollution Control Agency, USA, 2018; pp.1–2.
United States Environmental Protection Agency; 2001.
[14] PPI. Mature oil palm-fertilizers: Potash & Phosphate Institute, USA. 2018.
http://www.ipni.net/ppiweb/gseasia.nsf/$webindex/282DCD6D75141AB 948256EF2002C8059?opendocument&print=1. Accessed on [2018-03-12].
[15] MPOC. Recent studies further confirm that oil palm cultivation is not the main cause of deforestation 2017. http://www.mpoc.org.in/2017/04/11/recent-studies-further-confirm-that-oil-palm-cultivation-is-not-the-main-cause-of-deforestation. Accessed on [2019-12-11]
[16] UCS. Palm Oil 2016. https://www.ucsusa.org/resources/ palm-oil#.WvWp7aSFPIU. Accessed on [2019-12-16]
[17] Adsett J, Thottan J, Sibley K. Development of an automated on-the-go soil nitrate monitoring system. Applied Engineering in Agriculture, 1999; 15: 351–356.
[18] Adamchuk V I, Dobermann A, Morgan M T, Brouder S M. Feasibility of on-the-go mapping of soil nitrate and potassium using ion-selective electrodes. 2002 ASAE Annual Meeting, Chicago: ASAE Paper No. 02-1183. 2002; pp.1–7. doi: 10.13031/2013.9159.
[19] Sinfield J V, Fagerman D, Colic O. Evaluation of sensing technologies
for on-the-go detection of macro-nutrients in cultivated soils. Computers and Electronics in Agriculture, 2010; 70(1): 1–18.
[20] Adamchuk V I, Lund E D, Sethuramasamyraja B, Morgan M T, Dobermann A, Marx D B. Direct measurement of soil chemical properties on-the-go using ion-selective electrodes. Computers and Electronics in Agriculture, 2005; 48(3): 272–294.
[21] Sethuramasamyraja B, Adamchuk V I, Dobermann A, Marx DB, Jones D, Meyer G. Agitated soil measurement method for integrated on-the-go mapping of soil pH, potassium and nitrate contents. Computers and Electronics in Agriculture, 2008; 60(2): 212–225.
[22] Bogrekci I, Lee W S, editors. Design of a portable Raman sensor for phosphorus sensing in soils. 2005 ASABE Annual Meeting, Tampa: ASABE Paper No. 051040. 2005; pp.1–5. doi:10.13031/2013.19769 [23] Bogrekci I, Lee W. Spectral measurement of common soil phosphates.
Transactions of the ASAE, 2005; 48(6): 2371–2378.
[24] Christy C D. Real-time measurement of soil attributes using on-the-go near infrared reflectance spectroscopy. Computers and Electronics in Agriculture, 2008; 61(1): 10–19.