Tribology in Industry
www.tribology.rsFriction Behavior Produced in The Course of a
Contact Enabled Between Composite Materials and
Eco-Friendly Soles Prototypes Made of Elastomeric
Material with Regard to Ice-Covered Surface
M. Kandeva
a,b, N. Dishovsky
c,da Faculty of Industrial Engineering, Tribology Center, Technical University – Sofia, 1000 Sofia, Bulgaria, b South Ural State University, 76 Prospekt Lenin, Chelyabinsk, Russia,
c University of Chemical Technology and Metallurgy, 1756 Sofia, Bulgaria,
d Е.P.S.-Ecopolymeric Systems Ltd. 1408 Sofia, Serdikiiski sabor str, Bl.27, Bulgaria.
Keywords: Tribology Friction Ice surface
Elastomeric composites
A B S T R A C T
The subject matter of the present research constitutes a study of the technique of friction between samples and prototypes of soles made of composite materials comprising natural rubber characterized with ingredients originating from renewable sources produced in the course of their contact with an ice surface. Methods and devices were developed in order to investigate the static and dynamic friction force and the change with regard to frictional force in the event of contact with regard to three varieties of forms of ice: melting ice (ice with a layer of water on it, temperature: 0 to 1 °C), wet ice (temperature: - 4° -5° C) and dry ice (temperature: - 10° - 12° C). Coefficients of static and dynamic friction, along with change of the friction coefficient were obtained for 14 types of elastomers and ingredients from renewable sources - natural rubber, silicon dioxide extracted from the process of burning rice husks and microcrystalline cellulose, and using rapeseed oil as a technological additive. It has been ascertained and concluded that all tested materials have demonstrated highest friction coefficient in the event of contact produced with dry ice being the maximum coefficient of friction equal to 0.61. The most unfavorable and dangerous hypothesis for exposure of pedestrians to the effect of on an ice- covered surface are the cases of contact with wet ice and melting ice. There is no correlation of the coefficient of friction for the different materials under conditions of dry ice, wet and melting ice. The composites with the highest coefficient of friction under circumstances of wet and melting ice have been used to produce prototypes of soles, having identical pattern, and experimental results were obtained for the coefficients of friction and the friction coefficient change /rise/ in the event of contact produced with regard to dry, wet and melting ice. By means of implementation of the 3D printing technology, patterns of footwear soles with identical dimensions were made of the same material but with different patterns and results were obtained for the impact of the pattern on the static and dynamic coefficient of friction produced in the course of a contact with Corresponding author:
M. Kandeva
Faculty of Industrial Engineering, Tribology Center, Technical University – Sofia, 1000 Sofia, Bulgaria.
Email: [email protected]
R
ES
EA
R
an ice surface in its three relevant states - dry, wet and melting ice.
The implementation of this study has been funded by the Operational Program 2014BG16RFOP002 - Innovation and Competitiveness, Procedure: BG16R¬FOP002-1.002 - Support for the development of innovations by start-ups, Grant Agreement BG16R¬FOP002-1.002-0028-C01 Eco-footwear soles on elastomeric basis with improved ice and snow grip.
© 2019 Published by Faculty of Engineering
1. INTRODUCTION
In the winter season there are numerous cases if injuries caused by slip and falls accidents experienced while walking on a snowy or icy surface. This problem is particularly relevant for northern countries. It is assumed that slip incidents make up 16 % of all incidents, and 43 % of all incidents have occurred in Scandinavian countries [1]. For example, in Finland almost 50,000 pedestrians suffer injuries each year resulting from a slip on ice or snow sidewalk which leads to a necessity for further medical advice. The most vulnerable persons in this regard are retirees and women aged 50+. A frequency of injuries of 1/100 inhabitants has been detected and ascertained. The period with highest risk for pedestrians is the winter period when temperature rises in which case the snow melts followed by a period with sharp drop in temperature accompanied by new snowfall [3].
A major and prominent factor for stability when walking on ice-covered surfaces constitutes the friction produced between the shoe sole surface and the ice-covered surface. The foregoing conclusion is confirmed by a number of studies in the field of friction produced between the winter shoes soles made of different materials and ice-covered surfaces [4-6]. There are a number of researches in the patent literature related to new materials for winter soles and boots soles that guarantee a high coefficient of friction when walking. The current problem of environmental protection and protection in the rubber industry is associated with the maximum use of elastomers and renewable components in the manufacture of rubber products [8-14].
The purpose of this research is to investigate the friction characteristics demonstrated between composite materials samples and soles prototypes with elastomeric structure and ingredients from renewable sources in the event of contact with three varieties of form of ice - melting ice (ice with
covered with layer of water, temperature: 0 to 1 °C), wet ice (temperature: -40 to -5 °C) and dry ice (temperature: -10 to -12 °C).
For the purposes of accomplishing relevant goal, the following main tasks are addressed:
1. Development of a methodology and device for the study of the static (μo) and kinetic (μ) coefficient of friction and the difference in this regard (μo-μ) related to materials samples and eco-friendly shoes soles prototypes for shoes with elastomeric structure in the event of a contact produced with three states and form of the ice surface - melting ice, wet ice and dry ice.
2. Experimental study of static and kinetic coefficient of friction and change (μo-μ) of coefficient of friction of samples made of different eco-materials on elastomeric base in the event of contact with three ice surface forms- melting ice, wet ice and dry ice. 3. Experimental study of static and kinetic
coefficient of friction and change (μo-μ) of the coefficient of friction of prototypes of new and worn eco shoe soles with elastomeric structure in the event of three modes of contact with the ice surface`types and forms - melting ice, wet ice and dry ice.
4. Experimental study of the impact of the prototype pattern on the static and kinetic coefficient of friction in the event of contact with three modes of ice forms- melting ice, wet ice and dry ice.
2. DEVICE AND METHODOLOGY
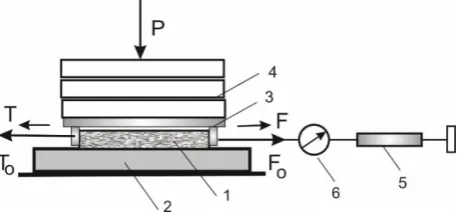
The contacting system (tribosystem) consists of a test pattern 1(body) and a fixed immovable counter body 2. Pattern 1 having its relevant specific dimensions is fixed rigidly to a holder 3 (slide) which is connected to a dynamometer 6 and a micrometric screw 5 by means of a non-elastic metal thread. The lower surface of the holder 3 is positioned at a distance of 2 mm above the contact interaction surface between the body and the counter body.
The normal load P of the tribosystem is set by the weights 4 by means of which a uniform distribution of the nominal contact pressure across the entire contact area between the body and the counter body is ensured. The normal load P is shown in the scheme by means of an arrow being concentrated at the center of gravity of the nominal point contact.
Fig. 1. Functional scheme of laboratory device for
studying static and kinetic friction at a slow sliding rate: 1 - sample; 2 - counterbody; 3 - sample holder; 4 - loads; 5 - micrometer screw; 6 - dynamometer.
The device is placed in a cryogenic camera (Fig. 2), allowing to obtain negative temperatures of up to -40 °C. The temperature within the chamber is thermoregulated and measured by means of INFRARED laser remote thermometer with a measuring range of -50 to +600 °C (Fig. 4). Figure 2 represents an image of the device.
Fig. 2. Photograph of the tribological tester placed
into a cryogenic camera.
Fig. 3. Laser infrared thermometer INFRARED.
Fig. 4. Images of some of the tested samples.
The measurement of the static friction force is carried out in the following sequence of steps: the sample 1 is rigidly fixed in the bed of the holder 3, it is placed on the ice-covered surface of the counter body 2 and a given load P is assigned by means of the weights 4. The scale of the dynamometer 6 is reset. By means of a micrometric screw 5 at a rate of 10 μm/s tangential force F on the sample holder 1 is gradually set. The force value F is measured on the dynamometer scale 6 calibrated in Newton. On the dynamometer scale, the maximum value of the force Fo is recorded on the dynamometer by means of slight movement of the arrow, after which the value of the force F decreases. The magnitude of the static friction force To is equal to the maximum value of the force Fo corresponding to the maximum deviation of the dynamometer arrow, i.e:
The magnitude of the kinetic friction force T is equal to the dynamometer reading when running the sample 1, i.e.:
Т = F (2) The samples subjected to relevant test have the shape of a parallelepiped with identical size of 49x35x8 mm (Fig. 4). The counter body constitutes an ice parallelepiped block with dimensions of 85x115x20 mm.
The survey and investigation methodology includes the following sequence of steps and actions adopted:
- Preparation of the surface of the counter body, which constitutes an ice block with a rectangular shape with dimensions respectively: for testing of samples of materials - 150x80x20 mm and for prototypes of shoes`soles - 380x300x80 mm. The icy surface is processed with waterproof sandpaper STRUERS P180 until obtaining certain roughness;
- The desired temperature is set in the cryogenic camera by means of a thermal relay;
- The test samples are placed in the chamber at the set temperature, where they are tempered for a period of 30 minutes;
- The test tempered sample 1 is rigidly fixed to the holder 3 and the desired load P is assigned with regard to the weights 4. - The dynamometer 6 is to be reset.
- The bolt 5 is to be slowly turned until the torque of the dynamometer 6 reaches a maximum value and a difference occurs. At this point the reading on the dynamometer scale, which corresponds to the static friction force То, is taken into account. - The screw shall continue to rotate and the
dynamometer reading shall be observed after the change of the arrow corresponding to the kinetic friction force T. The average reading of the dynamometer is to be recorded.
- In the course of each test, at least three measurements shall be made and their arithmetic mean shall be considered as relevant.
- The static coefficient of friction μ, the kinetic coefficient of friction μ and the change of
the coefficient of friction Δμ are to be calculated according to the formulas:
µo = To/P (3)
µ = T/P (4)
Δµ =µо - µ (5)
- Operations are repeated at different temperatures in the chamber.
- Over the course of the measurements temperature in the camera is continuously monitored by means of INFRARED laser thermometer and, if necessary, mentioned temperature is adjusted by means the temperature controller.
3. EXPERIMENTAL RESULTS OF TESTING SAMPLES
14 composite materials having identical size are tested under the same conditions - normal load P, respectively nominal contact pressure pa, period of tempering the samples in the camera before measurement, static contact time between the sample and the ice-covered surface, temperature maintained within the camera. The tests were carried out under the conditions of availability of following forms of ice-covered surface: melting ice / ice covered with a layer /, temperature: 0 to 1 °C /, wet ice, temperature: - 4 to -5 °C / and dry ice / temperature: - 10 to -12 °C.
The parameters of the experiment are represented in Table 1.
Table 1. Parameters of the experiment for static and
kinematic coefficient of friction measurement.
Parameters Value
Normal load Р = 5.6 kg = 56 N
Nominal contact area Аа = 17 cm2 Nominal contact pressure Pa = P/Aa = 3.29 N/cm2 Time of tempering of samples
before measurement 30 min
Time of static contact between the sample and the ice surface before
measurement 30 sek
rice and rapeseed oil. As already known, epoxidation increases the polarity of natural rubber [16]. The high polarity of the composites produces an impact with regard to the friction processes occurred in the contact with an ice-covered surface.
Tables 2, 3 and 4 represent the experimental results for the static and kinetic friction forces, the coefficient of static and kinetic friction and the friction coefficient difference occurred for all samples in the event of three cases of contact
interaction with the ice-covered surface - melting ice, wet ice and dry ice. For each sample three tests were performed and the arithmetic mean value has been taken into consideration and has been accepted.
Figures 5, 6 and 7 represent the dynamic coefficient of friction of the sample items in three cases of contact with the three forms of ice-covered surface - Dry Ice, Wet Ice and Melting Ice in accordance with the data revealed in Tables 2, 3 and 4.
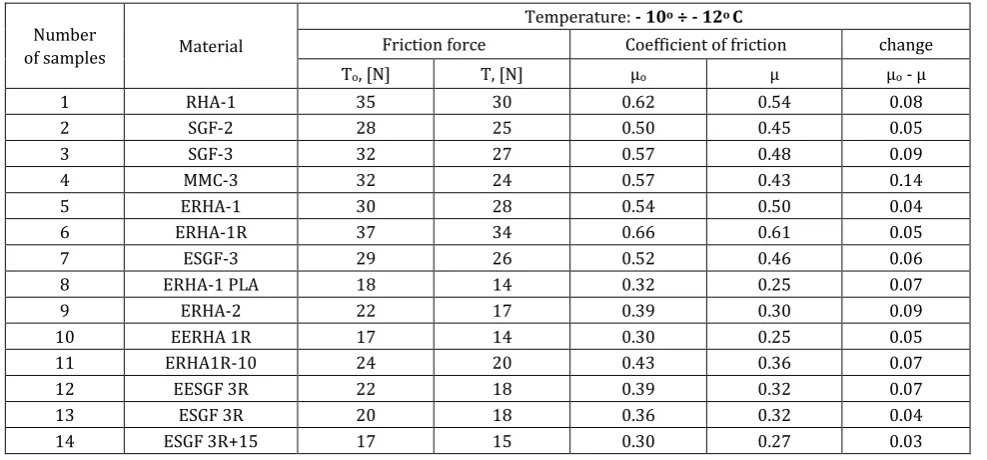
Table 2. Coefficient of Friction on the Surface "Dry Ice".
Number
of samples Material
Temperature: - 10о ÷ - 12о С
Friction force Coefficient of friction change
То, [N] T, [N] µо µ µо - µ
1 RHA-1 35 30 0.62 0.54 0.08
2 SGF-2 28 25 0.50 0.45 0.05
3 SGF-3 32 27 0.57 0.48 0.09
4 MMC-3 32 24 0.57 0.43 0.14
5 ЕRHA-1 30 28 0.54 0.50 0.04
6 ЕRHA-1R 37 34 0.66 0.61 0.05
7 ESGF-3 29 26 0.52 0.46 0.06
8 ЕRHA-1 PLA 18 14 0.32 0.25 0.07
9 ЕRHA-2 22 17 0.39 0.30 0.09
10 ЕERHA 1R 17 14 0.30 0.25 0.05
11 ЕRHA1R-10 24 20 0.43 0.36 0.07
12 EESGF 3R 22 18 0.39 0.32 0.07
13 ESGF 3R 20 18 0.36 0.32 0.04
14 ESGF 3R+15 17 15 0.30 0.27 0.03
Table 3. Coefficient of Friction on the Surface "Wet Ice".
Number
of samples Material
Temperature: - 4о ÷ - 5о С
Friction force Coefficient of friction change
То, [N] T, [N] µо µ µо - µ
1 RHA-1 12 10 0.21 0.18 0.03
2 SGF-2 15 13 0.27 0.23 0.04
3 SGF-3 13 11 0.23 0.20 0.03
4 MMC-3 15 13 0.27 0.23 0.04
5 ЕRHA-1 14 12 0.25 0.21 0.04
6 ЕRHA-1R 13 10 0.23 0.18 0.05
7 ESGF-3 17 14 0.30 0.25 0.05
8 ЕRHA-1 PLA 8 6 0.14 0.11 0.03
9 ЕRHA-2 10 8 0.18 0.14 0.04
10 ЕERHA 1R 12 9 0.21 0.16 0.05
11 ЕRHA1R-10 15 13 0.27 0.23 0.04
12 EESGF 3R 19 17 0.34 0.30 0.04
13 ESGF 3R 12 9 0.21 0.16 0.05
Table 4. Coefficient of Friction on the Surface "Melting Ice".
Number
of samples Material
Temperature: 0о ÷ 1о С
Friction force Coefficient of friction change
То, [N] T, [N] µо µ µо - µ
1 RHA-1 6 5 0.11 0.09 0.02
2 SGF-2 6 5 0.11 0.09 0.02
3 SGF-3 6 5 0.11 0.09 0.02
4 MMC-3 7.5 5.5 0.13 0.1 0.02
5 ЕRHA-1 7 5 0.13 0.09 0.04
6 ЕRHA-1R 11 9 0.20 0.16 0.04
7 ESGF-3 17 15 0.30 0.27 0.03
8 ЕRHA-1 PLA 5 4 0.09 0.07 0.02
9 ЕRHA-2 10 8 0.18 0.14 0.04
10 ЕERHA 1R 8 6 0.14 0.11 0.03
11 ЕRHA1R-10 10 8 0.18 0.14 0.04
12 EESGF 3R 5 3 0.09 0.05 0.04
13 ESGF 3R 5 4 0.09 0.07 0.02
14 ESGF 3R+15 7 5 0.125 0.09 0.035
Fig. 5. Diagram of the kinetic coefficient on the Surface "Dry Ice".
Fig. 6. Diagram of the kinetic coefficient on the Surface "Wet Ice".
0,54
0,45 0,48 0,43 0,5
0,61
0,46
0,25 0,3
0,25 0,36
0,32 0,32 0,27
0 0,2 0,4 0,6 0,8
1 2 3 4 5 6 7 8 9 10 11 12 13 14
kin
et
ic
f
rict
ion
c
oe
ff
ic
ien
t
Tested materials Friction on Dry Ice
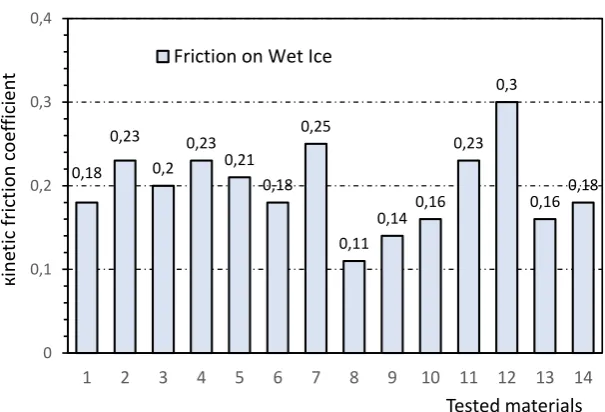
0,18 0,23
0,2 0,23
0,21 0,18
0,25
0,11
0,14 0,16 0,23
0,3
0,160,18
0 0,1 0,2 0,3 0,4
1 2 3 4 5 6 7 8 9 10 11 12 13 14
кin
et
ic
f
rict
ion
c
oe
ff
ic
ien
t
Fig. 7. Diagram of the kinetic coefficient on the Surface "Melting Ice".
When performing a summary of the analysis of the results obtained following conclusions can be carried out and determined:
- All tested materials have the highest kinetic coefficient of friction when contacting dry ice compared to the values revealed in the event of contact produced with wet ice and melting ice. Upon contact with dry ice, the highest coefficient of friction - 0.61 has sample # 6 - ERHA-1R, which constitutes a composite of microstructured cellulose in combination with standard silicon dioxide. The latter, however, when being subjected to a contact with Melting Ice and Wet Ice, has lower friction coefficients than those of other materials. These results correlate with the results for ice surface adhesion determined by means of a Dynamic Thermal Thermal Analysis (DMTA) [15,16].
- The most risk-bearing and dangerous in terms of walking on an icy surface are the events of contact produced with wet ice and melting ice, where the adhesion friction component decreases significantly, i.e. reduces the coefficient of friction and a loss of stiffness occurs. Under these conditions Sample No 7 (ESGF-3) has the highest kinetic coefficient of friction - value amounting to 0.27 with regard to the surface of Melting Ice and a value of 0.25 with regard to the wet ice surface. These values demonstrate highest results compared to those of other tested materials (Table 3 and Table 4). This material constitutes composite containing microstructural cellulose in combination with silicon dioxide obtained from the burning of rice flakes.
When analyzing the stated considerations for the purposes of the study of the coefficient of friction of an entire sole, an ESGF-3 sample has been selected.
4. EXPERIMENTAL RESULTS OF THE SOLE PROTOTYPES
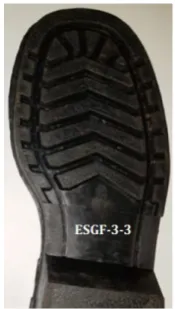
Three prototypes of ESGF-3 eco-friendly prototypes have been developed and studies with regard to the coefficient of static and dynamic friction have been performed with regard to the soles without wearing when being subjected to contact with Melting Ice, Wet Ice and Dry Ice. Figure 8 represents an image of a sample of the tested soles.
The study was carried out according to the described methodology, by making suitable fittings for fixing the eco-friendly soles. The results for coefficients of friction are visualized in Tables 5 and 6.
Fig. 8. Tested soles ESGF-3 (without wear).
0,09 0,09 0,09 0,1 0,09 0,16
0,27
0,07 0,14
0,11 0,14
0,05 0,07
0,09
0 0,1 0,2 0,3
1 2 3 4 5 6 7 8 9 10 11 12 13 14
kin
et
ic
fr
ict
ion
coe
ff
ic
ien
t
Table 5. Coefficients of friction of the sole of a material ESGF-3 under loadP=380 N.
Number of experience
MELTING ICE Temperature:
0оС ÷+ 1о С
WET ICE Temperature:
- 4оС ÷ - 5о С
DRY ICE Temperature:
- 10оС ÷ - 12о С
µо µ µо µ µо µ
1 0.18 0.15 0.26 0.22 0.55 0.44
2 0.15 0.11 0.29 0.22 0.59 0.48
3 0.18 0.11 0.26 0.18 0.63 0.55
Average value 0.17 0.12 0.27 0.21 0.59 0.49
Table 6. Сoefficients of friction of the sole of a material ESGF-3 under loadP=420 N.
Number of experience
MELTING ICE Temperature:
0оС ÷+ 1о С
WET ICE Temperature:
- 4оС ÷ - 5о С
DRY ICE Temperature:
- 10оС ÷ - 12о С
µо µ µо µ µо µ
1 0.13 0.10 0.23 0.17 0.40 0.30
2 0.13 0.10 0.20 0.17 0.37 0.30
3 0.10 0.07 0.20 0.13 0.40 0.33
Average value 0.12 0.09 0.21 0.16 0.39 0.31
The results reveal that when the temperature of the ice-coevred surface decreases, the static and kinetic coefficient of friction increases significantly. However, when increasing the load (from 380 to 420 N/ft) with regard to the sole, the values of both friction coefficients decrease, regardless of the temperature of the ice-covered surface.
5. EXPERIMENTAL RESULTS REVEALING THE IMPACT OF THE ECO-FRIENDLY SOLES` PATTERN TYPE PRODUCED WITH REGARD TO THE COEFFICIENT OF FRICTION
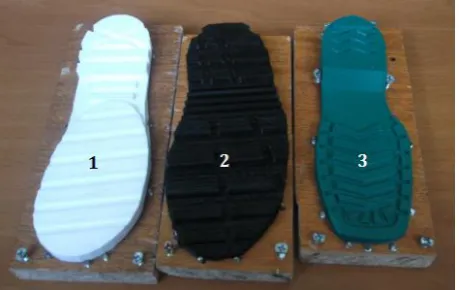
By means of the 3D printing method, patterns of soles of the same size were made of the same material, but with a different pattern (Fig. 9).
Fig. 9. Soles of different design, equal size, same
material, made by the 3D printing method.
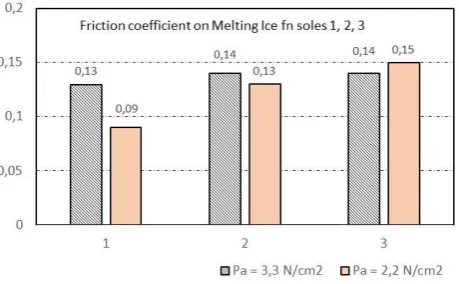
The static and kinetic coefficients of friction at the same nominal contact pressure were
investigated. The availability of identical contact pressure at different nominal contact areas of the samples with the ice surface is performed by means of proportional change of normal load. Measurements of coefficients of friction for two values of the nominal contact pressure r1 = 3.3 N / cm2 and r2 = 2.2 N / cm2 considering the three
conditions and forms of contact with the ice-covered surface were carried out - Dry Ice, Wet Ice and Melting Ice.
Figures 10, 11 and 12 represent charts of the dynamic coefficient of friction of the three types of tested soles (Fig. 9) respectively in the three cases of contact with the ice-covered surface.
The results obtained confirm the well-known fact that the pattern type and design of the sole has its impact with regard to the value of the coefficient of friction when observing the three states of the ice-covered surface.
Fig. 10. Kinetic coefficient of friction of soles of
Fig. 11. Kinetic coefficient of friction of soles of different designs in contact with Wet ice.
Fig. 12. Kinetic coefficient of friction of soles of
different designs in contact with Melting ice.
This influence is strongly related to two other factors - the condition of the ice surface and the contact pressure. The less significant impact is the influence of the pattern when producing contact between the soles and melting ice (Fig. 12). In this case, the difference detected with regard to the coefficient of friction values is very low for both contact pressure values. Highest coefficients of friction are observed when the soles produce contact with regard to dry ice. The data contained in Fig. 11 reveal that all soles have higher coefficients of friction at lower contact pressure of 2.2 N/cm2. This is explained and due to the fact that the increase of the contact pressure leads to the deformation and melting of the tops of the micro roughness, forming a thin water layer - i.e. availability of border friction with low tangent resistance at sliding- low coefficient of friction. When producing contact of the sole feet with regard to melting ice (Fig. 12) the tribosystem passes into mixed friction mode - there are areas with fluid friction and areas with border friction. In general, friction coefficients at higher loads have lower values than the ones subjected to contact with dry ice but have higher results than the ones subjected to contact with wet ice. However, unlike the other two cases, the
opposite is observed when lowering the load. Here, the superficial phenomena of the interactions of water with the walls of the patterns canals are key factor which is in particular important. However, in all investigated cases, the highest values of the coefficients of friction are those of sole No. 3 - 0.42, 0.25 and 0.15, which is characterized and identified by eco-sole pattern ESGF-3 - Fig. 8.
6. CONCLUSION
A methodology and device for coefficient of static and kinetic friction study and the change thereof with regard to composite material samples and eco-friendly soles` prototypes for shoes with elastomeric structure were developed in the event of contact enabled with three forms of ice-covered surface - melting ice, wet ice and dry ice.
Coefficients of static and kinetic friction and the change of coefficient of friction were obtained for 14 types of natural rubber based materials and two types of epoxidized natural rubber and ingredients from renewable sources: fillers - silicon dioxide obtained from the burning of rice flakes and microcrystalline cellulose and process-related additives based on castor and rapeseed oil.
All tested materials have been found to have the highest coefficient of friction when being subjected to contact with dry ice, and the maximum friction coefficient was 0.61 for a natural epoxidised rubber with fillers - microcrystalline cellulose in combination with standard silicon dioxide. This material has worsened friction parameters in the event of contact with wet ice and melting ice.
It has been found out that the best friction parameters in the event of contact enabled with regard to the three forms of ice-covered surface are those of the material of epoxidized natural rubber with fillers - microcrystalline cellulose in combination with silicon dioxide extracted from the process of burning rice husks.
From this material prototypes of soles intended for shoes of the same size and uniform pattern were made and experimental results were obtained for the coefficients of friction of the soles when being subjected to contact with dry, wet and melting ice.
By means of 3D printing methodology, patterns of soles of the same size were made of the same material but having different design and results were obtained for the impact of the pattern produced with regard to the coefficient of static and dynamic friction upon contact with an ice – covered surface available in its three states and modes - dry, wet and melting ice.
Acknowledgements
The implementation of this study has been funded by the Operational Program 2014BG16RFOP002 - Innovation and Competitiveness, Procedure: BG16RFOP002-1.002 - Support for the development of innovations by start-ups, Grant Agreement BG16RFOP002-1.002-0028-C01 Eco-footwear soles on elastomeric basis with improved ice and snow grip.
REFEFERANCES
[1] J. Lurid, Accidental Falls at Work, in the Home and during Leisure Activities, Journal of Occupational Accidents, vol. 6, iss. 1-3, p. 177, 1984, doi: 10.1016/0376-6349(84)90058-0
[2] R. Honkanen, The Role of Slippery Weather in Accidental Falls, Journal of Occupational Accidents, vol. 4, iss. 2-4, pp. 257-262, 1982, doi: 10.1016/0376-6349(82)90033-5
[3] R. Grоnqvist, M. Hirvonen, Slipperiness of footwear and mechanisms of walking friction on icy surfaces, International Journal of Industrial Ergonomics, vol. 16, iss. 3, pp. 191-200, 1995, doi: 10.1016/0169-8141(94)00095-K
[4] S. Derler, F. Kausch, R. Huber, Analysis of Factors Influencing the Friction Coefficients of sHoe Sole Materials, Safety Science, vol. 46, iss. 5, pp. 822-832, 2008, doi: 10.1016/j.ssci.2007.01.010
[5] R. Groonqvist, M. Hirvonen, Slipperiness of Footwear and Mechanisms of Walking Friction on Icy Surfaces, International Journal of Industrial Ergonomics, vol. 16, iss. 3, pp. 191-200, 1995, doi: 10.1016/0169-8141(94)00095-K
[6] C. Gao, J. Abeysekera, M. Hirvonen, C. Aschan, The Effect of Footwear Sole Abrasion on the Coefficient of Friction on Melting and Hard Ice, International Journal of Industrial Ergonomics, vol. 31, iss. 5, pp. 323-330, 2003, doi: 10.1016/S0169-8141(02)00234-2
[7] T. Sorahan, J. Harrington, A “Lugged” Analysis of Lung Cancer Risks in UK Carbon Black Production Workers, 1951-2004, American Journal of Industrial Medicine, vol. 50, iss. 8, pp. 555-564, 2007, doi: 10.1002/ajim.20481
[8] P.G. Barlow, A. Clouter-Baker, K. Donaldson, J. MacCallum, V. Stone, Carbon Black Nanoparticles Induce Type II Epithelial Cells to Release Chemotaxins for Alveolar Macrophages, Particle and Fibre Toxicology, vol. 2, no. 11, 1-14, 2005, doi: 10.1186/1743-8977-2-11
[9] S.H. Xu, J. Gu, Y.F. Luo, D.M. Jia, Effects of Partial Replacement of Silica with Surface Modified Nanocrystalline Cellulose on Properties of Natural Rubber Nanocomposites, eXPRESS Polymer Letters, vol. 6, no. 1, pp. 14-25, 2012, doi: 10.3144/expresspolymlett.2012.3
[10] M. Mansor, Properties Evaluation of Micro-Crystalline Cellulose and Starch as Biofiller in Rubber Compounding, Advanced Materials Research, vol. 1133, pp. 593-597, 2016, doi: 10.4028/www.scientific.net/AMR.1133.593 [11] World Patent WO 2012/146611A1 by Michelin. [12] World Patent WO 2011/073188 А1 by Michelin. [13] World Patent WO 2014/067828 by Michelin. [14] R. Baan, Carcinogenic Hazards from Inhaled Carbon
Black, Titanium Dioxide, and Talc Not Containing Asbestos or Asbestiform Fibers: Recent Evaluations by an IARC Monographs, Working Group, Inhalation Toxicology, vol. 19, iss. 1, pp. 213-228, 2007, doi: 10.1080/08958370701497903
[15] N. Dishovsky, F. Mitkova, Y. Angelov, M. Kandeva, L. Vladimirova, Studies on Natural Rubber Based Composites Filled with Products from Renewable Resources with Improved Adhesion to Icy Surfaces, Journal of Chemical Technology and Metallurgy, vol. 53, no. 3, pp. 399-407, 2018. [16] N. Dishovski, F. Mitkova, M. Kandeva, Y. Angelov, I.
Uzunov, M. Ivanov, D. Klissurski, Elastomer, Composites with Enhanced Ice Grip Based on Renewable Resources, Materials Sciences and Applications, vol. 9, no. 4, pp. 412-429, 2018, doi: 10.4236/msa.2018.94028
[17] M. Kandeva, D. Karastoyanov, G. Nikolcheva, B.