189
Insert Title Here
Author
1and Author
21University, 2University
Corresponding email:
Pricing Call Warrant by Using Binomial Model and Historical Volatility
KhairuAzlanAbd Aziz
1, Wan MohdYaseerMohd Abdoh
2,Wan Suhana Wan Daud
3and
NoorhalizaBaharudin
41,2,3,4Universiti Teknologi Mara (Perlis)
Corresponding email: [email protected]
Article Information
Abstract
Keywords
Call warrant, Binomial model, historical volatility, price
This paper is focusing on pricing call warrant listed in Bursa Malaysia that randomly selected from UiTM’sdatastream. We have chosen the Binomial model as the method of pricing because the price movement of the call warrant is nonlinear and follows the Brownian motion. The result will be compared to the real market price to determine either the price is undervalued or overvalued. Historical volatility also needs to be considered as its measuring the fluctuation of the underlying share price.
INTRODUCTION
Warrant is a kind of agreement which offer the holder an advantage of purchases or sells underlying share from the issuerat a specific price known as exercise price and date (Zhang et al. 2009). The exercise price or strike is determined by the issuer of warrant at the time when the buyer are about to buy a warrant. Warrant has a maturity date where the holder can only exercise the warrant on that day. The real function of warrant is as a tool of hedging. It avoids the holder and issuer from experiencing uncertain losses. Warrant and option is quite similar whereby an option is an agreement which states that, in dealing with the seller of the option, the holder has the right to either buy from or sell to the seller a certain amount of an underlying asset at a specified price during a specified period in the future (Zeng and Zhang 2010). However, the time to maturity of warrant is usually longer than option.Warrants are always related to preferred stock or bonds that are permitting the investor to pay dividends or interest rates at lower price. Issuing warrant might be able to improve the profit of the stocks and attract the investor to buy. Warrants are also usable in private equity deals and they are sold independently of the bond or stock. There are two major types of warrant, namely call warrant and put warrant. A call warrant gives a right to buy an amount of shares at a specific price and date. Investment bank or a shareholder of a company usually issues this call warrant. Put warrant is a contract giving the holder a right to sell a share with agreed price and date. Warrant can be trade through broker or remisier. A broker is an individual or a firm that charges a fee for handling the process of buying warrant from issuer. They are responsible to manage the investors stocks and at the same time educating and advising retail investors and the public. The brokers must have a representative license to trade stock or warrant by fulfilling the requirement of Capital Markets Services License conducted by SecutitiesCommision Malaysia.
METHODOLOGY
190
n i S S u i ii ln , 1,2,...,
1 [1]
Where n+1 is number of observation price and
S
iis stock price of Ith intervals.An estimator of the standard deviation
n i i u u n s 1 2 1 [2]where 1 .
1
n i i u n u [3]Then historical volatility can be calculated by using formula and equation 2
s
[4]where
is time length in year between each observation.During the process of binomial model, stock price can be either jump up or down with given probability p and
(1-p) where p
0,1 . Let u and d be the jump up and down factors respectively.) (
2
1 r t r t 2 t
e e
A
[5]
1
2
A A
u [6]
u
d
1
[7]
d
u
d
e
p
t r
[8]The binomial tree of stock price will be construct as shown in the figure below (Benninga and Weiner, 1997).
Su3
Su2
Su Su2d
S Sud
Sd Sud2
Sd2
Sd3
∆t 2∆t 3∆t
191
Continue the backward induction process to calculate the call warrant price by using formula:)) 0 , max( ), ) 1 ( (
max(e pVu pVd S X
C rt
[10]
Where Vu = warrant value at node going up and Vd= warrant value at node going down.
RESULTS AND DISCUSSIONS
In pricing the call warrants, historical volatility was calculated first since it cannot directly gained from the market information. There are many different measures of historical volatility which can use some or all open, low, high, or close of underlying share price (Bennet and Miguel 2012). The standard deviation of lognormal underlying stocks returns of close price was used to measure the historical volatility from equation 4.
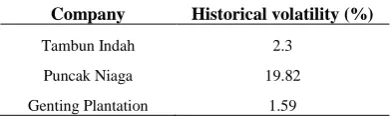
TABLE 1: Historical volatility for three companies
Company Historical volatility (%)
Tambun Indah 2.3
Puncak Niaga 19.82
Genting Plantation 1.59
The call warrant prices of three selected companies obtained from equation 10 are tabulated in table 2, 3 and 4.
TABLE 2: Call warrant model price for Tambun Indah Land
Date Actual Warrant Price (RM)
Model Warrant Price(RM)
Stock Price Different
2/1/2014 1.86 0.91 1.51 -0.05
2/5/2014 1.35 1.38 1.98 -0.03
2/9/2014 1.79 1.84 2.44 -0.05
2/1/2015 1 1.02 1.62 -0.02
5/5/2015 1.28 1.29 1.89 -0.01
2/9/2015 1.57 0.66 1.26 -0.09
TABLE 3: Call warrant model price for Puncak Niaga
Date Actual Warrant Price (RM)
Model Warrant Price(RM)
Stock Price Different
2/1/2014 2.4 2.26 3.26 0.14
2/5/2014 2.06 1.92 2.92 0.14
2/9/2014 2.35 2.37 3.37 0.02
2/1/2015 2 1.89 2.89 0.11
5/5/2015 1.65 1.6 2.6 0.05
2/9/2015 1.59 1.48 2.48 0.11
TABLE 4: Call warrant model price for Genting Plantation
Date Actual Warrant Price (RM)
Model Warrant Price(RM)
Stock Price Different
2/1/2014 3.31 2.84 10.56 0.47
2/5/2014 2.85 3.48 11.2 -0.63
192
2/1/2015 2.43 2.28 10 0.15
5/5/2015 2.12 2.28 10 -0.16
2/9/2015 2.16 2.08 9.8 0.08
The graphs in figure 4.2.1, 4.2.2 and 4.2.3 show the comparison between actual warrant price and model warrant price using binomial model for three selected companies trade warrant.
Figure 4.2.1: Actual Warrant and Warrant Price Binomial Model for Tambun Indah Land Berhad
193
Figure 4.2.3: Actual Warrant and Warrant Price Binomial Model for Genting Plantations BerhadFrom the graph above, we can see that the different between actual price of warrant and model price is small. Despite there are some different on Genting Plantations, but the gap is not too much and still follow the pattern of the actual price. The means square error of three warrants do not exceed 10% different which can be considered as low. Furthermore, we also can identify which warrant is undervalued or overvalued based on two prices from the graph. Investors tend to buying stocks when they are undervalued and subsequently selling them when they are overvalued. The valuation of three warrants can be referred in table 5 below.
TABLE 5: Price Value and Means Square Error
Company Means Square Error (%) Price Value
Tambun Indah 0.21 0.011 (Undervalued)
Puncak Niaga 1.59 -0.022 (Overvalued)
GentingPlantation 7.4 0.019 (Undervalued)
CONCLUSION
Trading warrant is a complex investment where the investors and issuers must have an adequate knowledge about this derivative. Besides that, warrant’s players should know how to price the warrant as it may lead either the price of warrant undervalued or overvalued.
REFERENCES
Bennett, C. and Miguel A. Gil, “Measuring historical volatility”, Santander Global Banking and Markets, 1-11(2012).
Benninga, S. and Weiner, Z., “The binomial option pricing model”, Mathematica Education and Research, Vol. 6 No. 3 (1997).
Xiao, W. L., Zhang W. G., Zhang, X. L., & Chen, X. Y. (2014). The valuation of equity warrants under the fractional Vasicek process of the short-term interest rate.Physica A, 394, 320–337 (2014).
Zeng,S. and Zhang,S., “Real option literature review”, Scientific Research iBusiness3, 43-48 (2011).