Published online July 10, 2013 (http://www.sciencepublishinggroup.com/j/bio) doi: 10.11648/j.bio.20130103.12
Advances on using a bioluminescent microbial biosensor
to detect bioavailable Hg
(
II
)
in real samples
G. S. Costa
1, A. M. Salgado
1, P. R. G. Barrocas
21Department of Biochemical Engineering, Federal University of Rio de Janeiro - UFRJ, School of Chemistry , Rio de Janeiro, Brazil 2Sergio Arouca National School of Public Health, Rio de Janeiro, Brazil
Email address:
[email protected](G. S. Costa), [email protected](A. M. Salgado), [email protected](P. R. G. Barrocas)
To cite this article:
G. S. Costa, A. M. Salgado, P. R. G. Barrocas. Advances on Using a Bioluminescent Microbial Biosensor to Detect Bioavailable Hg (II) In Real Samples. American Journal of Bioscience and Bioengineering. Vol. 1, No. 3, 2013, pp. 44-48. doi: 10.11648/j.bio.20130103.12
Abstract:
Technology has improved human quality of life but it caused several impacts also, due to the various contaminants released in the environment. Among these contaminants, mercury is a major concern because of its high toxicity and ubiquity in the biosphere, being classified as a global pollutant. It can occur in different forms (i.e. soluble, gaseous or solid) and chemical species (e.g. Methylmercury, elemental mercury, Hg (II), etc.), which have very different physico-chemical characteristics that, in turn, determine its cycling and bioavailability. Thus, to assess mercury potential impacts, it is necessary to go beyond the total quantitative determination, developing methods that can measure the toxicity of individual Hg species. In this context, we used a novel technique, a bioluminescent microbial biosensor, which detect only bioavailable mercury species, since bacterial Hg bioavailability is critical to define their risks. Biosensors have large applicabilities in different scientific domains such as environmental biomonitoring, medicine, and food analysis. The chosen biological receptor for the biosensor was the bacteria Escherichia coli MC1061, which is a genetic engineered organism capable of emitting light proportional to amount of Hg that enters its cell. Therefore it is a true mercury bioavailability measurement. In the present study the biosensor was used to detect bioavailable mercury from environmental samples collected at three different locations (open dump, semi-controlled landfill and controlled landfill).The biosensor showed high specificity for Hg (II) and good repeatability. Among the tested samples, collected between September and October 2009, the open dump samples had the highest bioavailable mercury levels compared to other samples from semi-controlled and controlled landfill. Thus, the bioluminescent microbial biosensor technique were sensitive enough to measure bioavailable Hg in landfill samples, and probably in other environmental samples, showing a high potential as an environmental monitoring method.Keywords:
Biosensor, Bioluminescence, Bioavailable Mercury, Escherichia ColiMC10611. Introduction
At the beginning of civilization, men played a minor influence on the environment. However, with the development of several new technologies after the industrial revolution, which improved quality of life, it has been causing several impacts on the environment. According to Lacerda & Malm [1], today the main issue is not if the environment is contaminated, but how severe the contamination is. The protection of environmental quality and its sustainability for the future generations are essential questions for the modern society.
In this context, trace metals pollution deserves great relevance due to the high persistence of these elements in the environment and their potential harmful health effects
in exposed populations. Although some of these effects are difficult to detect initially, their impacts are very difficult to be remediated. The response of natural ecosystems to chronic exposure to metals is not fully understood. Several of them accumulate progressively in natural ecosystems, affecting their functioning for decades or centuries, even after all local sources have been discontinued [1].
environment, its indiscriminate use by men increased its concentration in ecosystems worldwide, becoming a global pollutant. Mercury can be present in various forms or chemical species. Each of them has very different physical and chemical properties, which determine its bioavailability and toxicity. Therefore, the determination of individual Hg species is an area of great interest, especially methylmercury analysis, an extremely potent neurotoxin and the most toxic Hg species, as well as, the processes that lead to its formation since other Hg chemical species are naturally converted in the environment to methylmercury. A key step in its synthesis is the biological uptake of Hg(II) species by methylating bacteria in either pristine or contaminated aquatic systems. Methylmercury is readily accumulated by aquatic biota and biomagnified through the trophic chain, reaching human populations. Over 90% of the mercury found in fish and other marine organisms are present as methylmercury [2], [4].
The traditional analytical methods do not distinguish the
bioavailable species of the pollutants from the
non-bioavailable or inert ones, a critical issue to assess metals toxicity and risk. The biosensors come as an alternative approach for pollutant detection, presenting itself as new analytical tools to be applied in the diagnosis of environmental conditions [5]. The biosensors can be defined as an analysis device, which combine biological elements associate or integrate with a transducer, with the purposeof producinga signal proportional in magnitude or frequency to the concentration of the analyte, present in the samples [6].
These sensors show unique characteristics: sensitivity, selectivity, relatively low cost of construction and storage, miniaturization potential, automation ease and construction of simple and portable equipments [7]. Most of the new detection systems based on microbial sensors, use the luminescence response to a toxic compound present in the polluted environment [8]. The key of using these genetically modified organisms as biosensors is in the selective and specific response of the contaminated species present. This way, the produced luminescence is proportional to the concentration of the contaminant in the sample [9].
The main objective of this study was to investigate and applya bioluminescent microbial biosensor for the detection of bioavailable Hg (II) in environmental samples. The biosensor has a genetically modified microorganism,
Escherichia coli MC1061, and a luminometer as the biological element and the transducer respectively. The environmental samples tested were collected from three landfill areas (i.e. open dump, semi-controlled landfill and controlled landfill), between September and October of 2009.
2. Material and Methods
2.1. Equipment, Biosensor Growth Conditions and Mercury Standards
The luminometer is capable of measuring the light emission from samples. We used microplates with 96 wells where the samples were conditioned. This approach had the advantage of working with small sample volumes. This equipment was used for all bioassays and light measurements were expressed as relative light units (RLU). The LB medium (Sigma Aldrich, Brazil), either as broth or agar, was used in the reconstitution of stocks or freeze-dried bacteria and for pure cultures cultivation or isolation. The preparation of the maintenance cell stocks was performed using a new culture,obtained after cell growth at temperature of 30ºC and saking 150 rpm [10].
Two versions of the M9 medium (Vetec Química, Brazil) were used for luminometric tests. The difference between the two M9 versions were the inorganic salts present either as chloride or nitrate, from hereon referred as M9Cl and M9NO3 respectively. A kanamycin solution (30 mg/L - Sigma Aldrich, Brazil) was added to all growth media used for positive selection of biosensor [10].
All samples were analyzed after mercury standard additions. Hg standard solutions were prepared by the dilution of mercury primary standard (1g/L -Sigma Aldrich, Brazil).
2.2. Experimental Design
A planning central composite design (DCCR) was used to maximize variables responses, obtaining the optimum values for bioassays’ key variables (i.e. incubation time of the sample and the bioassays total time). The analysis of the results were based on calculating the estimated effect, standard error and the Student distribution of each control variable under the response variable using the Statistica
program (version 6.0). The independent variables studied were cell concentration and mercury concentration. All experiments were performed randomically with three central points. In the evaluation of the incubation time, the assays were performed separately (20, 45 and 60 minutes).
Overall, eleven experiments were conducted for each M9 test medium (M9Cl and M9NO3). Resulting in six experimental designs: M9Cl_20 minutes; M9Cl_45
minutes; M9Cl_60 minutes; M9NO3_20 minutes;
M9NO3_45 minutes and M9NO3_60 minutes.
2.3. Preparation of Cells - Bioassays
New cultures, obtained after cell growth at 30 º C and 150 rpm for 16 hours, were used to prepare cell suspensions for the bioassays. The concentration of cells was calculated using its dry weight curve.
For bioluminescence tests, Hg standard solutions were added to the microplate wells, followed by the appropriate cell culture. The microplates were incubated inside the luminometer for 45 minutes at room temperature, to produce the luciferase enzyme, which should be proportional to the mercury uptook by the bacterial cells. Since the reporter gene of E. coli MC1061 is under control of a promoter that is induced by intracellular presence of mercury only. The light measurement in each well initiated instantaneously after the automatic addition of 100µL of 1mM luciferine. The RLU signal for each well corresponds to integrated 12 seconds reading.
According to Barrocas [10] the potential interference was tested of five heavy metals (Cd(II),Cu(II), Fe(III), Pb(II), Zn(II)) on the Hg biosensor signal. The tests showed no induction of the biosensor for Cu(II), Fe(III),and Pb(II) at any of the concentrations tested. However, there was some light production by the biosensor at the zinc mid concentrations and at highest cadmium concentration tested. In the zinc case, “the light measured was only twice the blank level and doubling the Zn(II) concentration did not increase the biosensor response any further” [10]. Thus, these responses were too low to interfere with the Hg(II) bioassay results. Conversely, the response at the highest Cd(II) concentration tested (4.9 nM) was six times the blank value, while all other lower levels showed no response. Even though this signal was much higher than the blank, it is really dwarfed when one compares it with the response obtained for much lower Hg(II) levels. Furthermore, this Cd(II) concentration is considerably above its natural levels (0.03 – 0.69 nM) [14]. Therefore
Cd(II) should also not interfere with Hg(II)
bioluminometric experiments.
The original Virta et al. [9], where the Hg biosensor development was described for the first time, claimed a detection limit of 0.1 fM. However other papers from the same research group using the same Hg biosensor and a protocol similar to our traditional procedure indicated its “range of mercury detection as 200 – 20,000 ng/L” (1 –99 nM)[15]. The sensitivities of the biosensor methods are generally lower than chemical or physical methods of mercury analysis. However, it should be emphasized that the biosensor methods detect the bioavailable fraction of the total metal concentration, which is the most relevant information to assess the environmental and/or potential biological impact of a contaminant.
Leachate samples were sent to the laboratory INNOLAB accredited by CGcre / INMETRO, according to the ABNT / NBR / ISO / IEC 17025 for analysis by determining by
Cold vapor atomic absorption spectrometry.
3. Results and Discussion
The Escherichia coli MC1061 growth curve was established to obtain the necessary cellular density for the bioassays and to determine the physiological state of cells. After seven hours, a typical exponential phase was observed in both tested growth conditions (i.e. using M9CL and M9NO3, shaking at 150 rpm and at 30°C). A stationary phase was reached only after eleven hours of growth.
Figure 1. Response surfacegraphof theM9NO3mediumwith 45 minutesof
incubation.
3.1. Experimental Design
Experimental designcan determine which variables are more relevant for the cell culture and the luminometric
measurements. Only the M9NO3 medium showed
significant results from 20 to 45 minutes (see Figure1). The relevant variable for the model was the concentration of mercury (linear term) in both tested periods: 20 and45 minutes. The coefficient of determination (R2) adjusted for M9NO3 using 20 minutes was 51.30%, while for 45 minutes, R2 was 93.96%. It is important to note that the 20 minutes incubation time may not have been sufficient for the proper production of luciferase and thus, may not reflect the level of intracellular Hg (II) accurately. Therefore, a sample incubation of 45 minutes in M9NO3 medium were the conditions that best fitted the model, differently from what was reported by [10].
3.2. Real Samples
To avoid possible matrix effects during the analysis of
bioavailable mercury content in real complex
environmental samples, mainly due to the presence of natural ligands, standard addition curves were used. An adequate linear region of the calibration curve was determined, from 0.1ngL-1 a 4.00 ngL-1. The standard deviation values (see table 2) obtained suggested a good repeatability of the tests.
The best calibration curves of the Hg biosensor, analyzing different leachate samples,are shown in table 1.
The standard addition curves were essential for the quantification of bioavailable mercury in the samples.
Table 1. Equations of the calibration curveandstandard additioncurves
Samples Equation
standard curves water y= 70844x + 0.3455
standard addition curves - open dump y=19345x+0.247 standard addition curves - semi-
controlled landfill y= 26610x + 0.5855
standard addition curves - controlled
landfill y= 3641.4x + 0.3541
The deionized water showed a slope significantly higher than standard additions curves, because of the matrix effect of environmental samples. Among the samples analyzed, the sample B from the open dump had the highest response, suggesting a higher Hg bioavailability potential, probably due to its smaller level of ligands and consequently a lower
complexing capacity. While the sample C, the
semi-controlled landfill, showed an almost flat calibration curve, suggesting the lowest Hg bioavailability potential and consequently the highest levels of Hg ligands and complexing capacity. The sample A, controlled landfilling, displayed an intermediate response compared to the other two samples. The standard addition curve of sample A showed the best R2 value (0.9994) and lowest residue in the equation of the line (0.247), indicating that the experimental values were more accurate in the test sample A. However, it can be seen that all curves showed a high determination coefficient (i.e.R2> 0.9), considering all the potential bias involved in numerous steps of this analytical approach. Hence, we considered that the results obtained were satisfactory for the assessment of Hg(II) species bioavailability concentrations and the Hg(II) complexing capacity of the tested samples. Bioavailable Hg(II)
concentrations of the landfill, open dump and
semi-controlled landfill samples, calculated from the experimental data is shown in Table 2.
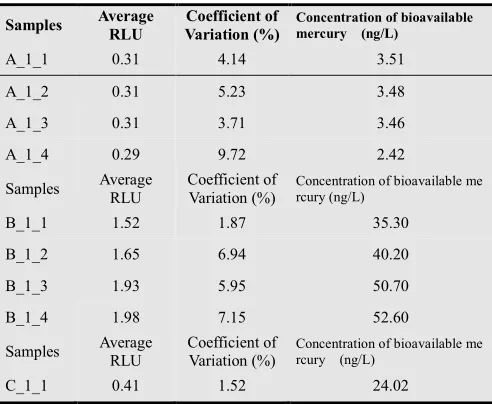
Table 2. Concentrations of bioavailable Hg(II) in the sampling sites.
Samples Average RLU
Coefficient of Variation (%)
Concentration of bioavailable mercury (ng/L)
A_1_1 0.31 4.14 3.51
A_1_2 0.31 5.23 3.48
A_1_3 0.31 3.71 3.46
A_1_4 0.29 9.72 2.42
Samples Average
RLU
Coefficient of Variation (%)
Concentration of bioavailable me rcury (ng/L)
B_1_1 1.52 1.87 35.30
B_1_2 1.65 6.94 40.20
B_1_3 1.93 5.95 50.70
B_1_4 1.98 7.15 52.60
Samples Average
RLU
Coefficient of Variation (%)
Concentration of bioavailable me rcury (ng/L)
C_1_1 0.41 1.52 24.02
C_1_2 0.37 11.84 4.46
C_1_3 0.37 5.21 5.55
C_1_4 0.38 36.47 8.49
Samples from three localities were also sent to the laboratory INNOLAB for quantitative analysis of total mercury ". Quantitative analysis confirmed that the samples examined contain mercury levels below 10 µg L-1. Such results have come to agree with those obtained by biosensor, since the latter only analyzes the bioavailable fraction of heavy metal. This analysis validate our results, since mercury was found to be bioavailable in much smaller amounts (lower value found in controlled landfill was 2.42 ngL-1, in open dump was 35.30 ngL-1 and semi - controlled landfill was 4.46 ngL-1) that values for total concentration.
The mercury levels were below the limits for natural waters established by the Brazilian legislation (CONAMA Resolution 430). This result may be due to a combination of several physical, chemical and biological. This redox state favors mercury to be kept in the soils as insoluble species. In table 3, the COD analysis suggested that the landfill, from where leachate samples were collected, had already gone through the acidification phase (i.e. low pH and high COD). While the BOD values ranged from 15.000 to 50.000 mg/L, with the highest levels in newer landfill areas [13]. The current methanogenic phase of the landfill, in which all samples were collected, result in reducing conditions of the soil and the leachate.
It is possible that the Hg biosensor results expressed only its readily bioavailable fraction, due to samples’ specific conditions (i.e. large presence of strong complexing agents), and not the whole potentially bioavailable species. Other possible interpretations of Hg biosensor data are that studied area did not receive toxic wastes (heavy metals, for example) or there are methods for separating toxic waste before it is dumped in the landfill as Brazilian law requiered.
Finally, it is important to keep the environmental monitoring of relevant matrices such as landfill leachates, which are major sources of environmental pollution in urban areas. This monitoring is an important tool for environmental management, which it is essential to preserve the environment and improve human quality of life.
Table 3. Results of the COD, BOD and pH
Sample COD pH BOD Controlled landfill Average average average
A_1_1 - 7.1 -
A_1_2 2275 7.36 979.33
A_1_3 2025 7.49 367.53
A_1_4 1641 7.24 441.53
Sample COD pH BOD
B_1_1 - 7.13 -
B_1_2 1225 7.27 861.00
B_1_3 300 7.38 344.20
B_1_4 737 7.17 410.87
Sample COD pH BOD
Semi-controlled landfill average average Average
C_1_1 - 7.10 -
C_1_2 1133 7.30 979.33
C_1_3 4058 7.49 367.53
C_1_4 2350 7.36 441.53
4. Conclusion
The bioluminescent microbial biosensor showed good repeatability. Among the sampled locations, the open dumpster showed the highest fraction of bioavailable mercury according to Hg biosensor, the other two locations showed an elevated Hg(II) complexing capacity. The physical-chemical variables analyzed, which indicated the redox conditions of the landfill, indicated that it had already passed the acid phase (i.e. the samples represent an old slurry).
Therefore, the results of this study demonstrated that the bioluminescent biosensor tested was a sensitive technique with high potential of application for the detection of bioavailable mercury in complex environmental samples.
Acknowledgements
The financial support of the National Council for Scientific and Technological Development (CNPq), Florida state University e o Florida Departament of Environmental Protection and the Foundation for Research of the State of Rio de Janeiro (FAPERJ) are gratefully acknowledged.
References
[1] L. D. Lacerda and O. Malm, “Contaminação por mercúrio em ecossistemas aquáticos : uma análise das áreas críticas,”
Estudos Avançados, vol. 22, no. 63, 2008, pp. 173–190. [2] T. Barkay, S. M. Miller, and A. O. Summers, “Bacterial
mercury resistance from atoms to ecosystems,” FEMS Microbiology Reviews, vol. 27, no. 2–3, 2003,pp. 355–384.
[3] F. M. M. Morel, A. M. L. Kraepiel, and M. Amyot, “The Chemical Cycle and Bioaccumulation Franc,” Annu. Rev. Ecol. Syst., vol. 29, 1998, pp. 543–566.
[4] R. P. Mason, J. R. Reinfelder, and F. M. M. Morel, “Uptake, Toxicity, and Trophic Transfer of Mercury in a Coastal Diatom,” Environmental Science & Technology, vol. 30, no. 6, 1996, pp. 1835–1845.
[5] R. Tecon and J. R. van der Meer, “Bacterial Biosensors for Measuring Availability of Environmental Pollutants,”
Sensors, vol. 8, no. 7, 2008, pp. 4062–4080.
[6] S. Rodriguez-Mozaz, M. P. Marco, M. J. . de Alda, and D. Barceló, “Biosensors for environmental applications: Future development trends,” Pure and Applied Chemistry, vol. 76, no. 4, 2004,pp. 723–752.
[7] M. J. Dennison and A. P. F. Turner, “Biosensors for Environmental Monitoring,” Biotech. Adv., vol. 13, no. 94, 1995, pp. 1–12.
[8] Karube and K. Nakanishi, “Immobilized cells used for detection and analysis.,” Current opinion in biotechnology, vol. 5, no. 1, 1994, pp. 54–59.
[9] M. Virta, J. Lampsnen, and M. Karp, “Luminescence-Based Mercury Biosensor,” Analytical Chemistry, vol. 67, no. 3,1995, pp. 667–669.
[10] P. R. G. Barrocas, “Assessment of Mercury ( II ) Species Bioavailability Using a Bioluminescent Bacterial Biosensor,” 2003.
[11] E. Greenberg, L. S. Clesceri, and A. O. Eaton, “Standard Methods for the Examination of Water and astewater,” no. 1, 1992.
[12] E. Greenberg, L. S. Clesceri, and A. O. Eaton, “Standard Methods for the Examination of Water and Wastewater,” 2005.
[13] L. M. Segato and C. L. da Silva, “Caracterização do Chorume do Aterro,” XXVII Congresso Interamericano de Engenharia Sanitária e Ambiental. XXVII Congresso Interamericano de Engenharia Sanitária e Ambiental ABES - Associação Brasileira de Engenharia Sanitária e Ambiental, vol. 1, 2000, pp. 1–9.
[14] W. Stumm and J.J. Morgan. “Aquatic Chemistry: chemical equilibria and rates in natural waters”. Wiley-Interscience, 1995.
[15] S.M.Tauriainen, M. P. J. Virta and M. T. Karp. “Detecting bioavailable toxic metals andmetalloids from natural water samples using luminescent sensor bacteria”. Water Research,