http://www.sciencepublishinggroup.com/j/ijefm doi: 10.11648/j.ijefm.20170504.11
ISSN: 2326-9553 (Print); ISSN: 2326-9561 (Online)
Comparative Analysis Between Export-Led Growth and
Import-Led Growth: A Study on Developing Eight (D-8)
Maimuna Akter, Md Nahid Bulbul
Department of Banking and Insurance, University of Dhaka, Dhaka, Bangladesh
Email address:
[email protected] (M. Akter), [email protected] (Md N. Bulbul)
To cite this article:
Maimuna Akter, Md Nahid Bulbul. Comparative Analysis Between Export-Led Growth and Import-Led Growth: A Study on Developing Eight (D-8). International Journal of Economics, Finance and Management Sciences. Vol. 5, No. 4, 2017, pp. 204-212.
doi: 10.11648/j.ijefm.20170504.11
Received: May 12, 2017; Accepted: May 25, 2017; Published: July 6, 2017
Abstract:
The main objective of the study is to investigate the comparative influence of import and export on economic growth of developing countries in the world, using Export-Led Growth (ELG) and Import-Led Growth (ILG) hypothesis. The study has used purposive sampling technique and selected the member countries of D-8 such as Bangladesh, Egypt, Indonesia, Iran, Malaysia, Nigeria, Pakistan and Turkey as sample. Total import, total export, and GDP growth rate, as indicator of economic growth, have been used as variables for the study. The study has selected time series and panel data of the variables from year 2001 to year 2015. To detect unit root of variables, Augmented Dickey Fuller (ADF) Test and Phillips-Perron (PP) Unit Root Test have been used. Moreover, the cointegration among variables has been examined using Johansen Cointegration Test. The study has also used Vector Autoregressive (VAR) model and Vector Error Correction (VEC) model to define the presence of short run and long run causality. Finally, Granger Causality Test has been used to examine the presence of unidirectional and bidirectional causality among the variables in short and long-run. The study shows that the variables have unit root at level and have become stationary at first and second difference. In most of the selected countries, the study has found cointegration and unidirectional causality among the variables. In Bangladesh, both import and export have been found to contribute to economic growth in short run, and the relationship is unidirectional. Moreover, these have been found to influence economic growth of Nigeria in long run. On the other hand, the study has discovered economic growth and export of Turkey to granger-cause its import in short and long run. However, along with economic growth, import has been found to granger-cause export of Egypt and Indonesia in short run, and export of Malaysia in long run. Finally, Pakistan and Iran have been found to have no granger-causality among import, export and economic growth.Keywords:
Economic Growth, Total Export, Total Import, GDP Growth Rate, Export-Led Growth, Import-Led Growth, D-81. Introduction
Economic growth of a country or a society is associated with the rising incomes and related increase in consumptions, savings, and investments, which ultimately result in market productivity and rise in Gross Domestic Product (GDP). With the emergence of globalization, now the essence of economic growth is not limited to a particular country or a society only, it gets spread from developed to developing countries. Among the prime contributors of this growth, international trade is predominating with the introduction of different trade liberalization policies and reduction of tariffs across the world. Along with developed countries, developing countries
Competing individually in the global market is difficult for developing countries and this is the reason of the emergence of many international groups, or regional organizations such as, UNICAD, SAFTA, IFAD, WTO, OECD, UNCTAD, ASEAN, APEC, SAARC and D-8. Along with other objectives to ensure collective sustainable economic growth, these organizations focus on enhancement of trade through reducing trade barriers, using subsidies and antidumping. The present study has selected the country members of D-8 Organization for Economic Cooperation, known as Developing-8 or D-8, which is one of such organizations by major Muslim developing countries such as Bangladesh, Egypt, Indonesia, Iran, Malaysia, Nigeria, Pakistan and Turkey. Envisioning cooperation among major Muslim countries from South East Asia to Africa, this group starts its journey with the objectives of improving member countries’ global economic position, increasing their standard of living, and contributing to their development through building good trade relationship among them.
Economic growth, usually refers to an increase in aggregate productivity, is generally measured as GDP or Gross National Product (GNP). Investigating determinants of economic growth is complicated by the fact that different countries have various experiences with growth. Hence, literatures have suggested that foreign trade, remittance, labor productivity, technology, foreign direct investment etc. are the determinants of economic growth of a country. While studying on the economic growth of developing economy, it is found that foreign trade is undoubtedly the best determinant because it promotes business, reduces poverty, enhances competitiveness and creates employment in countries such as Bangladesh, Indonesia, Malaysia etc. Therefore, the study has selected import and export as the determinants of economic growth and GDP growth rate as the indicator of economic growth. Majority of the literatures have put much importance on export because it has effects on other determinants. For instance, more export means more production, and more production needs more labor power and improved technology. However, some literatures have put emphasis on import to get the causal link between export and economic growth [1-3].
The effect of import and export on economic growth has been studied through many theoretical and empirical investigations. This effect or causality has usually been assessed in terms of Export-Led Growth (ELG), Import-Led Growth (ILG) and Growth-Led Export (GLE) hypotheses [4].
Although several studies have been conducted,
disagreements persist on the relationships among import, export and growth. Hence, there is scope to study on this dispute. Although numerous studies have focused on individual case study on a particular country, there are very few studies, which have conducted a comparative analysis of ELG and ILG among countries, especially among developing countries. The present study has tried to address the gap and to contribute to further literature through providing important findings. It has focused on comparative analysis between ELG and ILG upon eight developing economies. Many
developing countries with emerging economy have joined their hands to mutual agreement through different associations to facilitate their internal trade that is expected to bring positive and long-term economic changes among them. After joining many organizations such as AFTA, ASEAN and WTO, Cambodia has managed to import low tariff goods, improve market access and foster its integration into the world economy, activities that in turn have increased GDP [5]. Hence, studying on the causal relationship of import, export, and economic growth of the countries of such association is important because it can provide a new insight to their economy and make a judgment to the benefits of entering into such agreement. The present study has tried to consider the importance and the main objective of this study is to examine the comparative effect of import and export on economic growth of eight developing countries of D-8. In addition, it has tried to depict the change in economy of these countries after they make their trade relationship strong through entering in D-8 agreement.
2. Literature Review
Economists have long been interested in economic growth and the variables that influence the growth. While examining these issues, they have conducted a substantial number of theoretical and empirical studies, focusing on the relationship among import, export and economic growth. Majority of the investigations focused on ELG hypothesis that measures the causality flow from export to growth and its magnitude, whereas GLE measures the reverse causality between export and growth. However, focus has also now been given on the influence of import expansion to economic growth using ILG hypothesis that measures the causality flow from import to growth. Some of the studies have focused on the collective influence of both import and export on economic growth. Though simple or multiple regressions were popular to determine the association, Multivariate Cointegration Model, Vector Autoregressive (VAR) model, Vector Error Correction (VEC) model and Granger Causality Test have recently taken the place of traditional regression model to determine the influence.
Majority of the studies have focused on ELG hypothesis. Shirazi and Manap (2005) conducted a study on five South Asian countries using ELG hypothesis [6]. Tang and Ravin (2013) also conducted a study on Cambodia with the same hypothesis for the years from 1972 to 2008 and found bidirectional relationship between export and growth [5]. Moreover, Dritsakis (2006) conducted studies on the relationship between export and economic growth of three largest exporting countries and found significant long run causality in all the countries except in Japan [7]. Anwer and Sampath (1997), Ekanayake (1999), and Paul (2014) also conducted studies on the impact of export on economic growth of different countries and their studies gave different outcomes [8-10].
import is necessary to determine the true influence of export on economic growth. There have been very few studies conducted on the effect of import on economic growth or ILG hypothesis. Herrerias and Orts (2009) did a study to examine the role of import to the economic growth of China [11]. The study used investment with import to show their influence on labor productivity, a determinant of economic growth. Using VEC model, Kim et al. (2007) conducted a study on economic growth and found import, instead of export, to contribute significantly to the economic growth [12]. However, Turkey proves to have bidirectional causality between import and economic growth [13].
A number of studies have been conducted to investigate the role of both import and export to the growth of economy, and they have focused on both ELG and ILG hypothesis. Sharma and Smyth (2009) did their studies on Pacific Island Countries (PICs) such as Fiji, Papua New Guinea, the Solomon Islands, Tonga, and Vanuatu over the period from 1982 to 2004 and found long-run bidirectional causality among export, import and economic growth [14]. However, Amiri and Gerdtham (2011) used the same variables for France with VEC and Improved-VEC methods and found the relationship unidirectional [15]. Moreover, there are many studies that found reverse causality from economic growth to import and export. Alavinasab (2013) conducted similar study on Iran from 1961 to 2010 using Ordinary Least Square (OLS) method and concluded that non-oil export has positive but non-oil import has negative influence on economic growth [16]. However, Tunisia has been found to have growth-led import and export-led import [17]. These results provide evidence that growth in Tunisia was propelled by a growth -led import as well as export-led import strategy. In addition, Awokuse (2011) found no evidence to support ELG hypothesis but substantial evidence to support ILG hypothesis through his study on the countries of Latin America [4].
During the last several years, many authors to analyze ELG hypothesis have studied on developing countries. In fact, from 1990s, a new series of empirical studies have been conducted using a number of new methodologies, time periods and countries [19]. Gabriel (2014) showed the effect of import on the economic growth of Nigeria [20]. He found that though importation of factor inputs has positive, importation of manufactured goods has negative influence on economic growth of Nigeria. Moreover, a study was conducted on eight developing countries such as Thailand, Pakistan, India, Indonesia, Philippines, Sri Lanka, and Korea from 1960 to 1997 and concluded long run bidirectional causality for all the countries except for Malaysia [9]. Explaining the emerging economy of Bangladesh, Paul (2014) found export, instead of import, to lead the economic growth of Bangladesh [10]. However, the finding is not consistent with the conclusion that import is significant to influence economic growth [18]. Other authors such as Tang and Ravin (2013) have also conducted a number of studies on different developing economies [5].
A number of empirical studies have been conducted on the
association of import, export and GDP growth as an indicator of growth using different statistical models. Majority of the studies have used Granger Causality Test. Muluvi et al. (2014) and Ugur (2008) used Granger Causality Test to determine the influence of real GDP growth on import and found unidirectional causality from real GDP growth to real import [21, 13]. Moreover, Ekanayake (1999) selected Augmented Dickey Fuller (ADF) Unit Root Test, Johansen Cointegration Test, and Error Correction Model to do his study [9]. Dritsakis (2006) used Granger Causality test to determine the effect of export on economic growth [7]. However, Awokuse (2011) used a neoclassical growth modeling framework and multivariate cointegrated VAR method to determine the association among import, export and economic growth [4]. Moreover, Ugur (2008) to conduct study on import and economic growth has used Impulse Response Function (IRF) and Variance Decomposition Analysis (VDA) methods [13].
Unlike most previous studies of ELG and ILG hypothesis, the present study has used some advanced modeling, Granger Causality Test, for time series data based on VAR and VEC models that enable us to examine both direction and duration of causality. Moreover, it has gone beyond the traditional short-term effects and used various modern statistical techniques to empirically examine long-term relationship.
3. Data and Methodology
and Phillips Perron (PP) Unit Root Test, has been conducted to test the null hypothesis that there is unit root in the data set of each variable. ADF test has been the most popular model to examine stationarity in time series data; however, it always does not produce representative result if there is any structural break in time series data [18]. Hence, PP unit root test is also used to investigate the unit root. If the test statistics value in these tests is higher than the critical value at 5% or.05 level of significance, the null hypothesis can be rejected and variables can be concluded as stationary or integrated of order 0, i.e. I (0). If the data are not stationary at level, they are transformed into first difference and into second difference subsequently. Therefore, ADF test and PP unit root test are conducted again with the transformed data to examine stationarity at their first difference and second difference. The presence of stationarity of data at first difference and second difference is expressed as I (1) and I (2) respectively. The study has used the following ADF model (1), in which LY represents log of variables, β is the coefficient of time trend, α is an intercept constant called a drift, t is the time index, γ is the coefficient presenting process root, p is the lag order, and et is an independent residual term.
LY = α + βt + γLYt-1 + (δjLYt-j) + et 。。。 (1)
When the variables are found integrated of order one, i.e. I (1), Cointegration test is conducted to determine the presence of long-term association among the dependent and independent variables [23, 24]. The study has used Johansen Cointegration Test (2 and 3), in which the null hypothesis states the absence of cointegration among the variables. The
test includes two forms- the Trace Test and the maximum Eigenvalue Test.
J trace= -T ∑ ln(1 − ) (2)
J max= -T ln(1- λr+1) (3)
In the above equations, T is the sample size and λi is the largest canonical correlation among variables at ith. In trace test, the null hypothesis of r cointegrating vectors is analyzed against the alternative hypothesis of n cointegrating vectors. However, in eigenvalue test, the null hypothesis of r is
analyzed against the alternative hypothesis of r+1
cointegrating vectors [25]. The critical values can be found in Johansen and Juselius (1990) and in many statistical software packages. If trace statistics value and max statistics value is higher than 5% critical value, the null hypothesis of no cointegration can be rejected [24].
If the variables are not found cointegrated through Johansen Cointegration Test, VEC model cannot be run to investigate the long run causality among variables. Hence, unrestricted VAR model is used to determine the presence of short run causality. However, if the variables are found cointegrated in long run, VEC model is conducted to investigate the presence of long-run causality and short-run causality among variables. The study has used the following multivariate model (4) for both unrestricted VAR and VEC model to determine the causality for p lags, in which yt is the vector of dependent variable, v is the vector of constant, Ap contains information of relationship among variables, xt is the set of exogenous variables, and ut is the vector of error term.
yt = v + A1yt-1 + … + Ap yt-p + B0xt + B1Bt-1 + … + Bsxt-s + ut (4)
Therefore, Granger Causality Test is used to examine the direction of causality among the variables. The null hypothesis of this test states that there is no causality running from independent variable to dependent variable. A time series data of independent variable (x) can be concluded to granger-cause the data of dependent variable (y) through conducting Granger Causality Test with the lagged values of x and y. Hence, it can be determined whether the values of independent variables provide statistically significant
information about future values of dependent variables. In the study, the following multivariate analysis (4, 5, and 6) has been conducted for GDP growth (Y), Import (M), and Export (X), using Granger Causality Test. Here, ∆ denotes the variables at first difference, α0 denotes the intercept, and αm
contains information of relationship among variables. If the p-value of the model is less than 5% or.05 level of significance, the null hypothesis can be rejected.
∆Yt = α0 + α1∆Y t−1 + α2∆Y t−2 + … + αm∆Y t−m + b1∆Mt-1 +... + bm∆Mt-m + c1∆Xt-1 +...+ cm∆Xt-m +ut. (5)
∆Mt = α0 + α1∆M t−1 + α2∆Mt−2 + … + αm∆M t−m + b1∆Xt-1 +... + bm∆Xt-m + c1∆Yt-1 +...+ cm∆Yt-m +ut (6)
∆Xt = α0 + α1∆X t−1 + α2∆Xt−2 + … + αm∆X t−m + b1∆Yt-1 +... + bm∆Yt-m + c1∆Mt-1 +...+ cm∆Mt-m +ut. (7)
4. Analyses and Discussions
Although the majority of previous empirical studies have been conducted on the causality between export and economic growth, the present study has expanded the area to total import along with total export to determine their comparative relationship with economic growth of eight countries of D-8.
4.1. Test for Stationarity
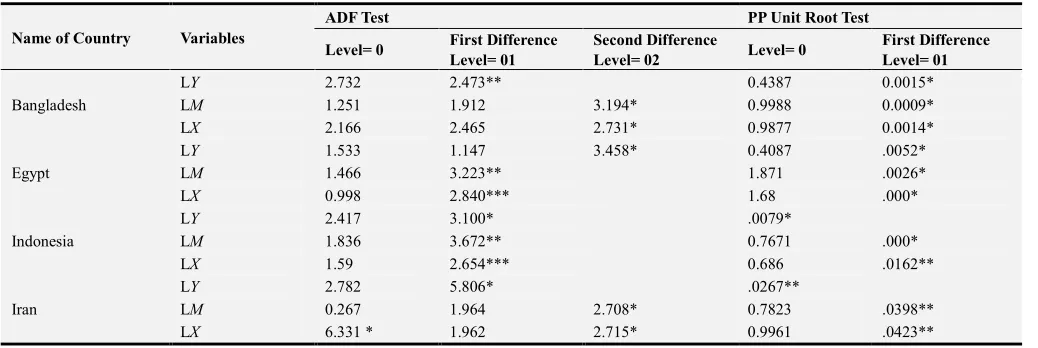
Firstly, the stationarity or unit root property of the variables has been investigated at level, first difference and second difference using ADF Test and PP Unit Root Test. The study has used univariate analysis for each variable of each country under observation.
Unit Root Test. In ADF Test, it shows that for each country, the variables- GDP growth, import and export, are not stationary at level. However, some of them are integrated after being transformed into first difference, which is referred as integrated of order 1or I (1). Afterwards, variables have completely been transformed into stationary at second difference at 5% level of significance. Variables, stationary at
second difference, are integrated of order 2 or I (2). Moreover, in PP Unit Root Test, the results indicate that variables- GDP growth, import and export, have unit root and are not stationary at level. However, they are stationary at first difference. Hence, variables of the study are stationary of integrated of order 1 or I (1) at 5% level of significance.
Table 1. ADF Test and PP Unit Root Test.
Name of Country Variables
ADF Test PP Unit Root Test
Level= 0 First Difference
Level= 01
Second Difference
Level= 02 Level= 0
First Difference Level= 01
Bangladesh
LY 2.732 2.473** 0.4387 0.0015*
LM 1.251 1.912 3.194* 0.9988 0.0009*
LX 2.166 2.465 2.731* 0.9877 0.0014*
Egypt
LY 1.533 1.147 3.458* 0.4087 .0052*
LM 1.466 3.223** 1.871 .0026*
LX 0.998 2.840*** 1.68 .000*
Indonesia
LY 2.417 3.100* .0079*
LM 1.836 3.672** 0.7671 .000*
LX 1.59 2.654*** 0.686 .0162**
Iran
LY 2.782 5.806* .0267**
LM 0.267 1.964 2.708* 0.7823 .0398**
LX 6.331 * 1.962 2.715* 0.9961 .0423**
(***, ** and * indicate rejection of null hypothesis at 1%, 5% & 10% level of significance)
Table 1. Continue.
Name of Country Variables
ADF Test PP Unit Root Test
Level= 0 First Difference
Level= 01
Second Difference
Level= 02 Level= 0
First Difference Level= 01
Malaysia
LY 3.443* 4.169* .000*
LM 2.561 3.520** 0.0418**
LX 0.798 2.006 4.281* 0.9825 .0004*
Nigeria
LY 1.063 4.39* .0023*
LM 1.368 2.406 6.791* 0.8513 .0037*
LX 1.257 0.324 7.033* 0.6094 .0054*
Pakistan
LY 1.601 1.71 2.901* 0.5411 .0358**
LM 2.871 2.518** 0.1283 .0017*
LX 1.238 2.221 4.608* 0.9268 .0022*
Turkey
LY 0.93 3.641* 0.9395 .0129**
LM 1.338 1.987 4.057* 0.9744 .0031*
LX 1.498 1.999 3.932* 0.9781 .0088*
(***, ** and * indicate rejection of null hypothesis at 1%, 5% & 10% level of significance)
4.2. Test for Cointegration
After confirming the presence of stationarity in variables, Johansen Cointegration Test has been conducted to investigate the presence of cointegration among each variable considered for the study. The study has used multivariate analysis using lag order determined by LR, Akaike’s Information Criterion (AIC), Hernan- Quinn criterion (HQ) and Schwartz criterion (SC). Table 2 includes the results of Johansen Cointegration Test.
Table 2. Johansen Test for Cointegration.
Trace Statistics Max Statistics
Maximum Rank LY, LM & LX 5% Level of Sig. LY, LM& LX 5% Level of Sig.
Bangladesh
0 14.1859 29.68 11.1843 20.97
1 3.0016 15.41 2.8683 15.41
2 0.1333 3.76 0.1333 3.76
Trace Statistics Max Statistics
Maximum Rank LY, LM & LX 5% Level of Sig. LY, LM& LX 5% Level of Sig.
0 21.324 29.68 12.6835 20.97
1 8.6406 15.41 8.2205 15.41
2 0.42 3.76 0.42 3.76
Indonesia
0 49.1380** 29.68 36.4392** 20.97
1 12.6988 15.41 10.5353 15.41
2 2.1635 3.76 2.1635 3.76
Iran
0 26.3943 29.68 17.8713 20.97
1 8.523 15.41 8.4014 15.41
2 0.1216 3.76 0.1216 3.76
Malaysia
0 79.2636 ** 29.68 55.3488** 20.97
1 23.9148** 15.41 21.1890** 15.41
2 2.7259 3.76 2.7259 3.76
Nigeria
0 40.7967** 29.68 24.0467** 20.97
1 16.7500** 15.41 12.0776** 15.41
2 4.6724** 3.76 4.6724** 3.76
Pakistan
0 55.5831** 29.68 22.0359** 20.97
1 33.5472** 15.41 19.6394** 15.41
2 13.9078** 3.76 13.9078** 3.76
Turkey
0 55.1292** 29.68 26.0163** 20.97
1 29.1128** 15.41 17.2903** 15.41
2 11.8225** 3.76 11.8225** 3.76
(***, ** and * indicate rejection of null hypothesis at 1%, 5% & 10% level of significance)
The results of the table suggest different conclusions from country to country. In Bangladesh, it is seen that the null hypothesis of no cointegration among GDP growth, import and export cannot be rejected. Hence, there is no long run association among the variables. Moreover, the variables of Egypt and Iran show the same result that there is no long-term association among GDP growth, import and export. The finding supports the conclusion of other authors [8]. However, the results of Indonesia show that the null hypothesis of 0 cointegration can be rejected as the trace statistics and max statistics values are higher than 5% critical value. On the other hand, Malaysia, Nigeria, Pakistan, and Turkey show significant association among the variables in the long run. Hence, the null hypothesis of no cointegration can be rejected and it can be concluded that in these countries, the economic growth, import and export have long-term association that is consistent with the conclusion of other findings in literature [7].
4.3. Granger Causality Test
Through the cointegration test, it cannot be determined whether there is unidirectional or bidirectional association among the variables. Hence, Granger Causality Test is conducted to determine the direction of association. As the variables of Bangladesh, Egypt and Iran are not associated in long run, the presence of short run association is investigated through Unrestricted VAR model and Granger Causality Test [4]. Table 3 represents the results of Unrestricted VAR model
and Granger Causality Test.
Table 3. Unrestricted VAR Test.
Bangladesh Iran
Dependent Independent Probability Dependent Independent Probability
LY Import 0.039** LY Import 0.451
Export 0.028** Export 0.586
All 0.048** All 0.169
LM GDP 0.423 LM GDP 0.135
Export 0.218 Export 0.543
All 0.405 All 0.319
LX GDP 0.292 LX GDP 0.486
Import 0.458 Import 0.384
All 0.556 All 0.232
Egypt
LY Import 0.346 LX All 0.166
Export 0.515 GDP 0.028**
All 0.453 Import 0.039**
LM GDP 0.066
Export 0.328
(***, ** and * indicate rejection of null hypothesis at 1%, 5% & 10% level of significance)
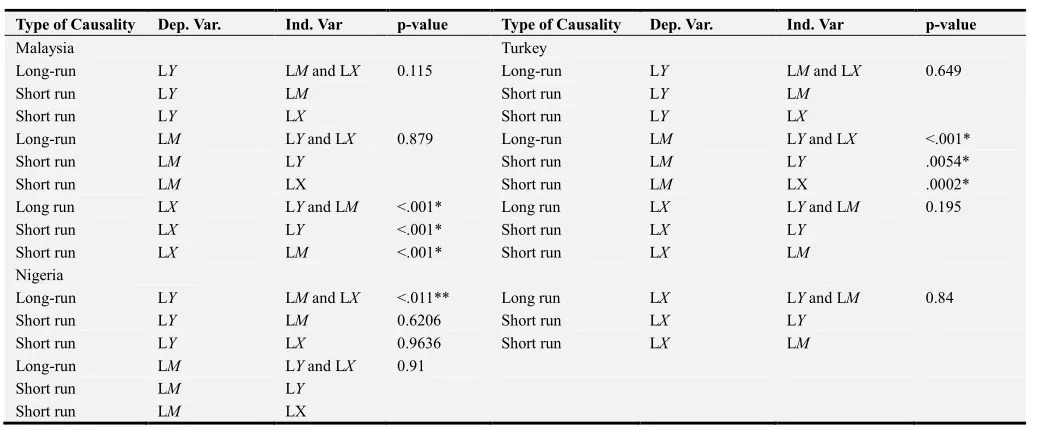
The study has used VEC model and Granger Causality Test for the countries where it found long run association or cointegration among variables. Here, the null hypothesis states no granger causality from independent variables to dependent variable. Table 4 shows the results of VEC model of Granger Causality Test.
Table 4. VEC Model and Granger Causality Test.
Type of Causality Dep. Var. Ind. Var p-value Type of Causality Dep. Var. Ind. Var p-value
Indonesia Pakistan
Long-run LY LM and LX 0.857 Long-run LY LM and LX 0.74
Short run LY LM Short run LY LM
Short run LY LX Short run LY LX
Long-run LM LY and LX 0.114 Long-run LM LY and LX 0.663
Short run LM LY Short run LM LY
Short run LM LX Short run LM LX
Long run LX LY and LM <.001* Long run LX LY and LM 0.588
Short run LX LY <.001* Short run LX LY
Short run LX LM 0.2428 Short run LX LM
(***, ** and * indicate rejection of null hypothesis at 1%, 5% & 10% level of significance)
Table 4. Continue.
Type of Causality Dep. Var. Ind. Var p-value Type of Causality Dep. Var. Ind. Var p-value
Malaysia Turkey
Long-run LY LM and LX 0.115 Long-run LY LM and LX 0.649
Short run LY LM Short run LY LM
Short run LY LX Short run LY LX
Long-run LM LY and LX 0.879 Long-run LM LY and LX <.001*
Short run LM LY Short run LM LY .0054*
Short run LM LX Short run LM LX .0002*
Long run LX LY and LM <.001* Long run LX LY and LM 0.195
Short run LX LY <.001* Short run LX LY
Short run LX LM <.001* Short run LX LM
Nigeria
Long-run LY LM and LX <.011** Long run LX LY and LM 0.84
Short run LY LM 0.6206 Short run LX LY
Short run LY LX 0.9636 Short run LX LM
Long-run LM LY and LX 0.91
Short run LM LY
Short run LM LX
Table 4 shows the results of VEC model and Granger Causality Test. In Indonesia, import and export are not found significant to granger-cause GDP growth. Moreover, GDP growth and export are also found to have no causality with import. However, short run and unidirectional causality is found from import and GDP growth to export in Indonesia, where only GDP growth is found to granger-cause export in short run. This finding is consistent with the conclusion of other studies [9]. On the other hand, in Malaysia, import and GDP growth granger-cause export in both long run and short run. Tang and Ravin (2013) also found the same conclusion in their study for Cambodia [5]. Hence it can be concluded that there is no evidence of export-led growth in Malaysia and the finding supports the finding that export in this country is not substantial to influence overall economic growth [9, 7]. However, in Nigeria, import and export are found to be significant to explain GDP growth in long run that is not consistent with the finding of Paul (2014). Supporting the finding of Anwer and Sampath (1997), the study found no causality among the variables of Pakistan [8, 10]. Import and export orientation in this country may be inadequate to have their impact on economic growth [29]. However, the finding does not support the finding of Shirazi and Manap (2005) who suggested that there is causality among GDP growth, import and export of Pakistan [6]. On the other hand, the study found long run granger causality from GDP growth and export to import in Turkey. Moreover, here GDP growth and export individually can also explain import in short run that is similar to the finding of other authors [21].
The present study has addressed some important underlying questions, yet this is not free from limitations. Firstly, the study has limited its scope to only years from 2001 to 2005, which may limit the validity of the findings and conclusions. Secondly, it has considered import and export the only determinants of economic growth. However, there may be other determinants that may significantly influence the growth of economy. Thirdly, GDP growth rate has been selected as indicator of economic growth. Overlooking other important indicators such as labor productivity, money supply, employment etc. may produce misleading conclusions. Fourthly, the study has selected sample of only eight developing countries; hence, the sample may not be the true representative of all developing countries in the world. Lastly, using Granger Causality Test to determine causality does not reveal nature of relationship (positive and negative) among the variables rather it reveals the direction and extent of relationship only.
5. Conclusion
Emergence of foreign trade in developing economies has necessitated answering the question: is growth of developing economy import driven or export driven? The present study has found no single answer to this question. Although most of the countries have association among import, export, and
economic growth, the direction of causality has been found multidirectional. The study has found import, export, and economic growth to influence each other both collectively and individually. Therefore, the conclusion indicates the importance of both import and export to drive growth of an economy in both short run and long run. The differences in conclusion are because the trade policies, political environment, geographical location and type of market differ from country to country. Although the study shows that entering in D-8 agreement has flourished international trade in member countries, it suggests several policy implications to developing economy. Firstly, export promotion should be hastened further because it is critical to economic growth by promoting aggregate demand, competitiveness, employment and productive efficiency. Secondly, import openness should be controlled, as it is crucial to economy by
complementing export through adopting modern
technologies in production and restoring external
imbalances for the export-oriented countries. Finally, ensuring higher economic growth is must since it results in increase in income that ultimately drives consumption and investment, and consumption further leads higher export and import.
References
[1] Esfahani, H 1991, ‘Exports, imports, and economic growth in semi-industrialized countries’, Journal of Development Economics, vol. 35, no. 1, pp. 93-116.
[2] Riezman, R, Whiteman, C. H & Summers, P. M 1996, ‘The engine of growth or its handmaiden? a time-series assessment of export-led growth’, Empirical Economics, vol. 21, pp. 77-110.
[3] Thangavelu, S & Rajaguru, G 2004, ‘Is there an export or import-led productivity growth in rapidly developing Asian countries? a multivariate VAR analysis’, Applied Economics, vol. 36, no. 10, pp. 1083-1093.
[4] Awokuse, T 2008, ‘Trade openness and economic growth: is growth export-led or import-led?’, Applied Economics, vol. 40, no. 2, pp. 161-173.
[5] Tang, T & Ravin, C 2013, ‘Export-led growth in Cambodia: an empirical study’.
[6] Shirazi, N & Manap, T. A 2005, ‘Export-led growth hypothesis: further econometric evidence from South Asia’, The Developing Economies, vol. XLIII, no. 4, pp. 472-488.
[7] Dritsakis, N, Varelas, E & Adamopoulos, A 2006, ‘The main determinants of economic growth: an empirical investigation with granger causality analysis for Greece’, European Research Studies, vol. IX.
[8] Anwer, M, & Sampath, R 1997, ‘Exports and economic growth’.
[10] Paul, B 2014, ‘Testing export-led growth in Bangladesh: an ARDL bounds test approach’, International Journal of Trade, Economics and Finance, pp. 1-5.
[11] Herrerias, M, & Orts, V 2011, ‘Imports and growth in China’, Economic Modeling, vol. 28, no. 6, pp. 2811-2819.
[12] Kim, S, Lim, H & Park, D 2007, ‘Could imports be beneficial for economic growth? some evidence from republic of Korea’. [13] Ugur, A 2008, ‘Import and economic growth in Turkey: evidence from multivariate VAR analysis’, East-West Journal of Economics and Business, vol. 11.
[14] Sharma, S & Smyth, R 2009, ‘Is economic growth export-led or import-led in the pacific island countries? evidence from panel data models’.
[15] Amiri, A, & Gerdtham, U 2011, ‘Relationship between exports, imports, and economic growth in France: evidence from cointegration analysis and Granger causality with using geostatistical models’.
[16] Alavinasab, S, 2013, ‘Foreign trade and economic growth in Iran: an empirical study’, International Journal of Academic Research in Business and Social Sciences, vol. 3, no. 11.
[17] Saaed, A & Hussain, M 2015, ‘Impact of exports and imports on economic growth: evidence from Tunisia’, Journal of Emerging Trends in Economics and Management Sciences (JETEMS), vol. 6, no. 1, pp. 13-21.
[18] Ahmed, H & Uddin, G 2009, ‘Export, imports, remittance and growth in Bangladesh: an empirical analysis’, Trade and Development Review, vol. 2, no. 2, pp. 79-92.
[19] Smith, E 2001, ‘Is the export-led growth hypothesis valid for developing countries? a case study of Costa Rica’, Presentation.
[20] Gabriel, O & Charity, O 2014, ‘Growth evidence of imports in Nigeria: a time series analysis’, International Researcher, vol. 3, no. 2.
[21] Muluvi, A, Kamau, P &Gitau, C 2014, ‘Trade and foreign policy division Kenya institute for public policy research and analysis’. [22] Gujarati, D 2012, Basic econometrics, New York:
McGraw-Hill.
[23] Johansen, S 1988, ‘Statistical analysis of cointegrated vectors’, Journal of Economic Dynamics and Control, vol. 12, pp. 131–154.
[24] Johansen, S, & Juselius, K 1990, ‘Maximum likelihood estimation and inference on cointegration: with an application to demand for money’, Oxford Bulletin of Economics and Statistics, vol. 52, pp. 169–210.
[25] Osterholm, P, & Hjalmarsson, E 2007, ‘Testing for cointegration using the Johansen methodology when variables are near-integrated’, IMF Working Papers, vol. 07. No. 141, pp. 1.
[26] Mamun, K. A. Al & Nath, H. K 2005, ‘Export-led growth in Bangladesh: a time series analysis’, Applied Economics Letters, vol. 12, no. 6, pp. 361 –364.
[27] Grossman, G & Helpman, E 1991, Innovation and growth in the world economy, MIT Press, Cambridge.
[28] Delangizan, S, Sanjari, F & Rahimi, M 2013, ‘Export-led growth in Iranian economy’. Elixir International Journal, vol. 63.