Towards School Management System
(SMS) Success in Teacher’s Perception
Haslina binti Hassan [1], Bahbibi binti Rahmatullah [2], Norhisham bin Mohamad Nordin [3]
[1] haslinahassan4@gmail.com Faculty of Art, Computing and Creative Industry
Univerisiti Pendidikan Sultan Idris 35900 Tanjung Malim, Perak Malaysia
[2]
Faculty of Art, Computing and Creative Industry
Univerisiti Pendidikan Sultan Idris 35900 Tanjung Malim, Perak Malaysia
[3]
Faculty of Art, Computing and Creative Industry
Univerisiti Pendidikan Sultan Idris 35900 Tanjung Malim, Perak Malaysia
ABSTRACT
School Management System-SMS (Sistem Pengurusan Sekolah) is a system developed by Ministry of Education Malaysia in order to reduce teachers’ burden and for Educational Data Integration. SMS is a type of Management Information System (MIS) and is pivotal for efficient and effective running of schools in Malaysia. As SMS is newly introduced, no research on its use could be found yet; therefore, this research is crucial in providing information to MOE on the SMS success. The core of this research is to validate the relations of variables in DeLone and MacLean IS Success Model with teachers’ perception towards the SMS success. Several Information System Success (ISS) evaluation theories will be discussed in this research as they are essential to describing the IS Success. Using a quantitative approach, the tool (survey questionnaire) was applied in a survey at Sekolah Kebangsaan Puncak Alam (2), Selangor with 56 respondents. Data were analyzed using SPSS. Two types of statistical analysis were used on the collected data. Descriptive analysis was used to analyze the demographic information and correlation analysis to find the relationship between variables. We found significant relationships between variables: system quality, information quality, use, user satisfaction and individual impact. The results supported the hypotheses made to answer all the research questions. The findings are essential for MOE to know the teachers’ perception in the implementation of SMS in school.
Keywords: School Management System (SMS), Management Information System (MIS), Information System Success (ISS), DeLone & MacLean IS Success Model (D&M IS Success Model)
INTRODUCTION
School Management System
As stated in the Malaysia Education Blueprint 2013-2025 (Ministry of Education, 2013), quality and the effectiveness of the education management must be improved. Toward this end, the School Management System (SMS) or Sistem Pengurusan Sekolah (SPS) was introduced by the Ministry of Education in Malaysia to help administrators and teachers manage information and centralize administrative tasks. SMS was developed from Management Modules in Smart Schools. MOE had chosen 6 modules from 22 management modules to be implemented in daily schools all over the country. Six modules involved in SMS are School Information Management, School Facilities Management, School Calendar Management, System Administration Management, Employee Management and Student Management.
Expansion of SMS involved 10,000 schools all over Malaysia in order to decrease teachers’ burden in managing schools and to implement Educational Data Integration for MOE. According to the Education Blueprint 2013-2025 (Ministry of Education, 2013), SMS is one of the initiative components in The Education Data Integration managed by the Performance Delivery Unit of the Ministry of Education.
The aim of SMS is to develop an information management application in school with a centralized database that can be reached by multiple users. The users are school administrators, teachers, parents, students and even the Ministry of Education. SMS is an automation of two major fields in schools, namely school management and education.
SMS will bring a big changes to the school management. Teachers and school administrators will use SMS to manage schools. At the same time parents, Ministry of Educations staff and even the students can access information from SMS.
The School Management System entered the schools at the end of 2013. Within a short time frame, the teachers need to key-in all relevant data to fulfil the system needs. Without enough courses, facilities, skills and other related requirements, users had to do what they were asked to do. Of course, the Ministry of Education was hoping the system users give their very best in applying the SMS. SMS is built by combining and integrating several constructs in order to obtain a successful MIS. This research will look deep into constructs of a conceptual model that show the design used towards the SMS success. We use the knowledge and trends in Information System Success (ISS) to validate the relationship between the identified constructs. The D&M IS Success Model is chosen to model the constructs. This raises the question of whether the various constructs in the chosen IS Success Model have any relations with teachers’ perception toward SMS success. This research focused on teachers’ perspectives as teachers are the main users of SMS.
The introduction of SMS was hoped to bring big changes to the school management, transforming management from reliance on multiple systems to one integrated system. Teachers and school administrators will use SPS to manage the school. At the same time parents and even the Ministry of Educations can access information from SMS. Quality and the effectiveness of Education management will be improved if SPS succeeds. As a new system, many questions arise, but the most important question is whether the SMS really fulfil the expected outcomes or not.
A new information system helps to overcome the problem of inefficient public service and information delivery in the public sector. The wide use of information systems in the public sector have resulted in concerns regarding system effectiveness and performance (Cheng & Chan, 2000). The same concerns arise in SMS. A successful SMS is the aim in order to build a solid platform for planning and operational purposes through educational data integration. In order to achieve a successful information system, this research will provide further insights in evaluating the success of SMS. The research will look for the teachers’ opinion as they are the main users of the system.
A comprehensive understanding of SMS success still remains elusive as the system had just been introduced in schools. It is crucial in ensuring SMS achieves its objectives. Research on the success of SMS is important to both government and other users. This leads to the need of evaluating SMS to measure the success from teachers’ perspectives. Evaluation research enables government to determine whether SMS is capable of doing the required tasks and delivering services as expected. This research focuses on evaluating the success of SMS from teachers’ perspectives in Malay-medium national schools.
The research is based on a conceptual model adapted from the D&M IS Success Model, designed to validate the relationships between constructs and the teachers’ perception toward SMS success. It also provides further insight into the success of SMS as adopted by the teachers within the school. The research is focusing on the main operator of the system, the teachers, and will look deep into the system as well. It is believed that if this research proved the relationship among constructs involved, it would be easy for SMS to achieve success.
Information System Success Models
Based on a comprehensive survey of the literature, we found several ISS evaluation models. These evaluation models applied social science procedures to assess the conceptualization, design, implementation and utility on MIS (Visser et al., 2012).
The most commonly used theories on which ISS evaluation models are based are the theory of reasoned action, the theory of planned behavior, the theory of beliefs and attitudes, the behavioural theory
of the firm and the mathematical theory of communications (Visser et al., 2012). The most frequent used model to evaluate ISS are the DeLone and MacLean ISS Model (D&M ISS Model)(DeLone & MacLean, 1992), the Technology Acceptance Model (TAM)(Davis, Bagozzi & Warshaw,1989), the Task-Technology Fit Model (TTF)(Goodnue & Thompson, 1995), the End User Computing Satisfaction Model (EUCS)(Doll & Torkzadeh, 1988) and Unified Theory of Acceptance and Use of Technology Model (UTAUT)(Venkatesh, Morris, Davis, & Davis, 2003; Visser et al., 2012; Sabherwal et al., 2006). Many researchers conducted their research in ISS evaluation based on portions, combinations or extensions of these models.
Table 1 presents a number of major ISS Models. These model are based on either one or more combinations of theories. Table 1 illustrates the ISS Model and the theories used to evaluate MIS success (Visser et al., 2012; Sabherwal et al., 2006).
Table 1. Information System Success Evaluation Models and the underlying theoretical Frameworks (Adapted from Visser et al., 2012 and Sabherwal et al., 2006).
Year: Theory
Theory Develope
r Theory
Model based on theory
Model Abbre- viation
Model
Developer Year: Model
1975 Fishbein and Ajzen
Theory of Reasoned Action, Theory of Planned Behavior (TRA,TPB) Technology Acceptance
Model TAM
Davis F.D., Bagozzi R.P., Warshaw.
P.R. 1989
Task Technology
Fit Model TTF Model
Goodhue, D.L., Thompson,
R.L. 1995
Technology Acceptance
Model (2) TAM2
Venkatesh, V., Davis,
F.D. 2000
TAM/TTF Model with Computer Self-Efficacy Combined TAM/TTF Model Dishaw, M.T., Strong, D.M., Bandy,
D.B. 2002
Unified Theory of Acceptance and Use of Technology UTAUT Venkatesh, V., Morris, M.G., Davis, F.D. Davis, G.B. 2003 Technology Acceptance
Model 3 TAM3
Venkatesh,
V., Bala, H 2008
1963 Cyert and March Behavioral Theory of the Firm
Development of a Tool for
Measuring and Analyzing Computer User Satisfaction
CUS Bailey, J.E., Pearson,
S.W. 1983
The
Measurement of End-User
Computing Satisfaction
EUCS Doll, W.J., Torkzadeh,
G. 1988
1963
Integration of the concept theories; ‘Beliefs and attitudes about the system’ with ‘Beliefs and attitudes using the system’
Integration of the User satisfaction literature and the Technology Acceptance Model Integration of User Satisfaction (US) and TAM Wixom, B.H.,
Todd, P.A. 2005
1949 Shannon and Weaver Mathematical Theory of Communications Expanded Shannon & Weaver’s theory by extending ‘effectiveness level’ into three categories Expanded Mathemati -cal Theory of Communic ations
Mason, R.O. 1978
1978 Mason
Expanded Mathematical Theory of Communications DeLone and McLean IS Success Model D&M IS Success Model DeLone, W.H.,
McLean, E.R 1992
Extension of DeLone and McLean IS Success Model combined with the Technology Acceptance Model Extended D&M IS Success Model combined with TAM Seddon, P.B.,
Kiew, M.Y. 1996
Re-specification and extension of the DeLone and McLean IS Success Model
Partial behaviour model of IS Use
Seddon, P.B. 1997
Updated DeLone and McLean IS Success Model Updated D&M IS Success Model DeLone, W.H.,
McLean, E.R. 2003
DeLone and MacLean IS Success Model
Many studies have been conducted to evaluate the validation of the D&M model (McGill, Hobbs & Klobas, 2003; Rai, Lang, & Walker, 2002; Seddon, 1997; Sedera, Gable, & Chan, 2004; Visser, Van Biljon, & Herselman, 2012).
D&M IS Success Model shows that success does not depend on one factor, but several interrelated factors (DeLone & MacLean, 1992). The D&M IS Success Model is based on six constructs to be measured: system quality, information quality, service quality, use, user satisfaction, individual impact and organizational impact (DeLone & MacLean, 1992). Figure 1 shows the illustrated D&M IS Success Model. The model assumes that system quality and information quality individually and jointly affect use and user satisfaction. Use and user satisfaction also have relationship with each other. These are presumed to be direct antecedents of individual impact and are followed by organizational impact (Iivari, 2005).
Figure 1. DeLone and MacLean Information System Success Model (D&M IS success Model, 1992)
The Conceptual Framework
Figure 2 shows the proposed conceptual model we built based on the D&M IS success model. The conceptual model is built by selecting important constructs needed to run this research. It is used to develop the survey questionnaire needed to identify the relationship between constructs in teachers’ perspective toward SMS success. The evaluation measured the relation between five constructs: system quality, information quality, use, user satisfaction and individual impact. We tested the relationship between the constructs involved according to the conceptual model (Figure 2) to prove the hypothesis. The conceptual model is made according to the research scope. The scope for this research is to identify the relationship between the constructs within the teachers’ perception towards SMS success shown in Figure 3. The researcher eliminated the organizational impact as the research scope is limited to teachers’ perception only.
The Hypothesis is developed according to the model in Figure 2. Hypothesis H1 assumes there is a relationship between system quality and use. Hypothesis H2 assumes that there is a relationship between system quality and user satisfaction. Hypothesis H3 assumes that there is a relationship between information quality and use. Hypothesis H4 assumes that there is a relationship between information quality and user satisfaction. Hypothesis H5 assumes that there is a relationship between use satisfaction and use. Hypothesis H6 assumes that there is a relationship between use and individual impact. Hypothesis H7 assumes that there is a relationship between user satisfaction and individual impact.
System Quality
Information Quality
Organizational Impact Individual
Impact User
Satisfaction Use
Figure 2. The Proposed Conceptual Model to evaluate the relationship between constructs of School Management System (SMS) in teachers’ perspective towards success
METHODOLOGY
In order to conduct the research, survey research was used. The quantitative data were gathered through the survey using purposive designed questions. The questionnaire comprises two sections: Section A on demography information consists of 4 questions, while Section B on evaluating teachers’ perception consists of 15 questions. Descriptive statistics and inferential statistics were used to analyze the data collected. Descriptive statistic is used to analyze the demography information, while inference statistic is used to analyze the relationship between constructs shown in figure 3.
The targeted population involved in this research are teachers in Sekolah Kebangsaan Puncak Alam (2). The total number of teachers in this school is 130. According to Fraenkel and Wallen (2006), sampling is allowed in a research because it can help the researcher to manage a big population involved in their research (Noraini, 2010). For sampling design, we used a simple random sample. The respondents have access to the system. Some 56 respondents out of 60 returned the questionnaire (N = 56).
The researcher decides to use survey as the tool for generating primary data information. For this particular method, the researcher needs to develop and establish a set of questionnaire to capture the perception of particular sample population. The sample of this research is teachers in daily school. This instrument is conducted to collect teachers’ feedback about their opinions on SMS success. For this research, the researcher uses a set of questionnaire from other research related with this research. The questionnaire is derive from Armstrong and Dingsdag (2005). The questionnaire comprises with 19 questions categorized in 2 sections. Table 2 shows the Questionnaire Item. Section A is demography information with 4 questions and the section B is evaluation on teachers’ perspective towards the SMS success. Likert rating scale is used to rate each item from 1 to 4, where 1 is strongly disagree, 2 is disagree, 3 is agree and 4 is strongly agree.
Table 2. Table of Questionnaire Item
Section Construct Item
A Demography Information 1 - 4
B
Evaluation of Teacher Perspective: Sytem Quality
Information Quality Use
User Satisfaction Individual Impact
A1-A3 B1-B5 C1-C3 D1-D2 E1-E2
The tool has been empirically tested by looking at the Cronbach alpha coefficient in SPSS. The value is Individual
Impact User
Satisfaction Information
Quality System
Quality Use
.844. According to Mohd Yusri Ibrahim (2010) the value of instrument reliability which is between .70 - .80 suggests high reliability. Table 3 shows the instrument reliability statistics.
Table 3. Instrument Reliability Statistics
N of Item N Cronbach alpha value
19 56 .844
We will analyze the data with quantitative analysis, using SPSS to analyze the data collected from the questionnaire by using descriptive analysis and inferential analysis. The analyzed data were used to make generalization from the sample to the population (Noraini, 2010). Data collected will be used to test the hypothesis and answer the research questions. From the findings, we will know the research limitation and other constraints in implementing a successful SMS.
Results and Findings
This section focuses on descriptive analysis in which is all the questionnaire items will be analyzed to get the mean; demographic information and descriptive statistics were used to analyze the collected data. The second section discusses statistical analysis to evaluate the relationship between constructs in the teachers’ perspective scope toward the SMS success according to the conceptual model (Figure 2). The researcher chose inferential statistics to analyze the data.
Table 4 shows the demographic analysis. Frequency and percentage are used to represent the data. According to Table 4 the gender distribution of the respondents was not equal as the school population is not balanced between the genders. A total of 73% (or 41) of participants are female while another 27% (or 15 participants) are male respondents.
Table 4. The Demography Analysis
Item Statement Frequency %
1 Gender Male Female 15 41 27% 73%
2 Highest Education Level
Diploma 23 41%
Degree 27 48%
Master 2 4%
SPM/Certificate 4 7%
3 Teaching Experience
Less than 5 years 9 16%
5 to 10 years 18 32%
11 to 15 years 12 21%
16 to 20 years 10 18%
More than 20 years 7 13%
4 Teacher’s Expertise Language Malay/English 22 39%
Mathematics 12 21%
Science 4 7%
Social Subject 9 16%
Physical and Health Education 1 2%
Other 8 14%
For education level, respondents with degrees comprised 48% (or 27 participants), 41% (or 23 participants) are diploma holders, 7% (4 participants) SPM/certificate holder and 4% (2 participants) master degree holders. Almost half of the users are degree holder, as their highest academic qualification. Teachers with experience 5 to 10 years were the majority, forming 32% (18 participants), followed by 11 to 15 years
or 21% (12 participants), 16 to 20 years with 18% (10 participants), less than 5 years with 16% (9 participants) and the last group, more than 20 years, at 13% (7 participants). This means that almost all teachers have more than 5 years of teaching experience; this suggests that most of them have ample experience with many types of system used in school. From these finding, the users of SMS have average to excellent computer proficiency skills.
The analysis for this research is made according to the conceptual model (Figure 2). To analyze the data, researcher uses correlation method to identify the relationship between the variables represented by constructs from the conceptual model. All variables: system quality, information quality, use, user satisfaction and individual impact have been analyzed using SPSS to identify the relationship.
Table 5 shows the results of the analysis. The table shows the r value which is the Pearson correlation, the significant value and N. The relation between variables shows strong correlation. The output shows:
i. A strong relation exists between system quality and use. (r = .71, sig = .00)
ii. An average relations exist between system quality and user satisfaction.(r = .48, sig = .00) iii. An average relations exist between information quality and use.(r =.50, sig = .00)
iv. A weak relations exist between information quality and user satisfaction.(r = .36, sig = .01) v. A average relations exist between use and user satisfaction.(r = .62, sig = .00)
vi. A strong relations exist between use and individual impact.(r = .80, sig = .00)
vii. A strong relations exist between user satisfaction and individual impact.(r = .74, sig = .00)
Table 5. Relationship Between the Variables
Variable System Quality Information Quality Use User Satisfaction Individual Impact
System Quality r Sig.(2 tailed) N 1 56 .71** .00 56 .47** .00 56 Information Quality r Sig.(2 tailed) N 1 56 .50** .00 56 .36** .00 56
DISCUSSION
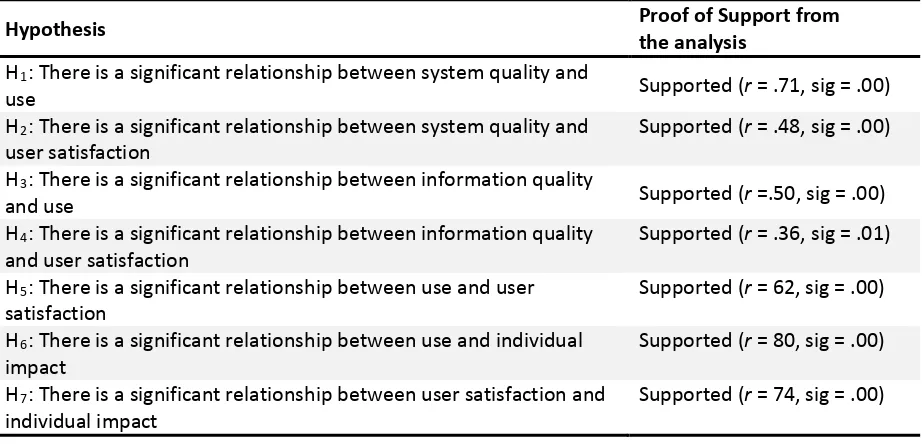
The research is a study to find the relations between variables in the DeLone and MacLean IS Success Model with teachers’ perspective toward the School Management System (SMS) success. The collected quantitative data were tested with the conceptual model (Figure 3) which consists of 5 variables represented by the constructs: system quality, information quality, use, user satisfaction and individual impact. Overall, the results support the model. Table 6 shows the summary of support obtained for the hypotheses. The hypotheses test results show the relation between identified constructs. H1, H6 and H7 show a strong relationship between the constructs, while H3 and H5 show an average relationship. H2 and H4 show a weak relationship.
Table 6.Summary of the support obtained for the hypotheses
Hypothesis Proof of Support from the analysis
H1: There is a significant relationship between system quality and
use Supported (r = .71, sig = .00)
H2: There is a significant relationship between system quality and
user satisfaction Supported (r = .48, sig = .00)
H3: There is a significant relationship between information quality
and use Supported (r =.50, sig = .00)
H4: There is a significant relationship between information quality
and user satisfaction Supported (r = .36, sig = .01)
H5: There is a significant relationship between use and user
satisfaction Supported (r = 62, sig = .00)
H6: There is a significant relationship between use and individual
impact Supported (r = 80, sig = .00)
H7: There is a significant relationship between user satisfaction and
individual impact Supported (r = 74, sig = .00)
CONCLUSION
This research proves that a significant relationship exists between system quality and use, system quality and user satisfaction, information quality and use, information quality and user satisfaction, use and user satisfaction, use and individual impact and finally user satisfaction and individual impact. The research findings show that teachers’ perception in using the School Management System (SMS) influenced the success of the system itself. Teachers are the biggest users of SMS, which means the success of SMS depends on the teachers. Although the findings show there were relationships between the identified constructs, two were weak relationships. Teachers’ needs are crucial to be fulfilled because the system’s success depends on their satisfaction. Future research might involve modifying the SMS to meet user satisfaction. Research on the impact of SMS in improving school management needs to be carried out in order to prove the usefulness of SMS in managing schools.
REFERENCES
Armstrong, B., Fogarty, G., & Dingsdag, D. (2005). Validation of a Computer User Satisfaction Questionnaire to measure IS success in small business. Journal of Research and Practice in Information Technology, 37(1), 27 – 42.
DeLone, W. H., & McLean, E. R. (1992). Information System success: The quest for the dependent variable. Information System Research, 3(1), 36.
DeLone, W. H., & McLean, E. R. (2003). The DeLone and McLean Model of Information System Success: A ten-year update. Journal of Management Information Science, 19(4), 9-30.
Doll, W. J., & Torkzadeh, G. (1988). The measurement of end-user computing satisfaction. MIS Quarterly, 12(2).
Duarte, A. I. M., & Costa, C. J. (2012). Information systems: Life cycle and success. In ISDOC '12: Proceedings of the Workshop on Information Systems and Design of Communication (pp. 25-30). New York, NY: ACM. doi:10.1145/2311917.2311923
Goodhue, D. L., & Thomson, R. L. (1995). Task-technology fit and individual performance. MIS Quarterly, 19(2).
Iivari, J. (2005). An empirical test of the DeLone-McLean model of information system success. DATA BASE, 36(2), 8-27.
Kementerian Pelajaran Malaysia. (2013). Perancangan Pelaksanaan Peluasan Sistem Pengurusan Sekolah SebagaiPenyelesaian Kepada Menangani Isu Beban Tugas Guru dan Pengintegrasian Satu Data
Pendidikan KPM. Retrieved from
http://btpnkl.weebly.com/uploads/1/4/5/8/14580296/sps_rollout_plan_2013.pdf
Ministry of Education. (2013). Malaysia Education Blueprint 2013-2025. Putrajaya: Ministry of Education
Malaysia. Retrieved from http://www.moe.gov.my/cms/upload_files/articlefile/2013/articlefile_file_003108.pdf
McGill, T., Hobbs, V. & Klobas, J. (2003). User -development applications and information system success: A test of DeLone and McLean’s Model. Information Resources Management Journal,16(1), 24-45.
Mohd Yusri Ibrahim. (2010). Analisis Data Penyelidikan Untuk Pendidikan dan Sains Sosial. Malaysia: Bandar Ilmu.
Noraini Idris. (2010). Penyelidikan dalam Pendidikan. Kuala Lumpur, Malaysia: McGraw-Hill.
Rai, A., Lang, S. S., & Walker, R. B. (2002). Assessing the Validity of IS Success Model: An empirical test and theoretical analysis. Information System Research,13(1), 50-69.
Sabherwal, R., Jeyaray, A., & Chowa, C. (2006). Information System success: Individual and organizational determinants. Journal of Management Science, 52, 1849- 1864.
Seddon, P. B. (1997). A respecification and extension of the relevance of the DeLone and McLean Model of IS success. Information System Research, 8(3), 240-253.
Sedera, D., Gable, G. G., & Chan, T. (2004). A Factor and Structural Equation analysis of the Enteprise Systems Success Measurement Model. In Proceedings AmericasConference of Information System. NewYork, NY:
Urbach, N., & Müller, B. (2012). The Updated DeLone and McLean Model of Information Systems Success. In Y. K. Dwivedi et al. (Eds.), Information Systems Theory: Explaining and predicting our digital society, Vol. 1,Integrated Series in Information Systems 28. DOI 10.1007/978-1-4419-6108-2_1
Venkatesh, V., Morris, M. G., Davis, F. D., & Davis, G. B. (2003). User acceptance of Information Technology: Toward a unified view. MIS Quarterly,27.
Visser, M., Van Biljon, J., & Herselman, M. (2012, October). Modeling management information systems’ success: A study in the domain of further education and training. In Annual Research Conference of the South African Institute of Computer Scientists and Information Technologists (SAICSIT 2012), Centurion, South Africa, 1-3 October 2012. South Africa: ACM Digital Library. Retrieved from http://hdl.handle.net/10204/7017