Vision Technology Based Traffic Safety Analysis Using Signal Data
Wonho Suh
*, Jung Ryul Kim, Joongmin Cho
Department of Transportation and Logistics Engineering, Hanyang University ERICA Campus, Ansan, Korea
Received 26 April 2019; received in revised form 26 May 2019; accepted 26 June 2019
Abstract
Recent vision technology allows traffic engineers to analyze traffic safety based on image processing
applications. Vehicle trajectory data including vehicle position and speed are extracted and converted into traffic
conflicts related variables. These variables are analyzed to find correlations with crash data and geometric design
variables and included in the statistical analysis process to evaluate the safety of intersections. In this paper, signal
timing information data is included in the analysis process to investigate if there are any correlations with traffic
conflict data. For example, traffic conflicts happen more frequently in a certain movement at certain signal time
phase. The goal of this paper is to develop a method for vision technology-based traffic safety analysis process using
traffic signal data to identify crash prone movement and signal to time at a given intersection. The proposed
technique is demonstrated in real-world video data collected in an intersection. This paper is expected to provide
more insight and technique in traffic safety evaluation.
Keywords: traffic safety, image processing, vision technology, vehicle detecting, safety evaluation
1.
Introduction
While the majority of traffic accidents are caused by drivers' error, traffic accidents occur for various reasons including
driver-related factors, vehicles related factors, and environmental related factors including traffic conditions. A significant
number of traffic accidents have been found to occur at intersections [1-3]. An intersection is a point where traffic flows
running in different directions. Vehicles merge, diverge, and intersect each other at an intersection. Usually, an intersection
with heavy traffic is controlled by a signal. The signalized intersection has the advantage of smoothly controlling the vehicles
approaching from different access roads through the signaling device.
Conventional road safety assessments evaluated safety based on historical accident data. However, in order to collect
accident data for statistical analysis, significant time, and cost are required [4]. Therefore, safety evaluation based on conflict
data has been developed and utilized in many countries. Recent image detection technology has been developed to obtain
vehicle trajectory information based on image data at an intersection [5-7].
Vehicle trajectory data including vehicle position and speed are extracted and converted into traffic conflicts related
variables. These variables are analyzed to find correlations with crash data and geometric design variables and included in the
statistical analysis process to evaluate the safety of intersections. In this paper, signal timing information data is included in the
analysis process to investigate if there are any correlations with traffic conflict data. For example, traffic conflicts happen more
frequently in a certain movement at certain signal time phase. The goal of this paper is to develop a method for vision
technology-based traffic safety analysis process using traffic signal data to identify crash prone movement and signal to time at
a given intersection.
*Corresponding author. E-mail address: [email protected]
Proceedings of Engineering and Technology Innovation, vol. 13, 2019, pp. 20-25 21
2.
Data Collection and Analysis
Video data were collected from an intersection in Korea and vehicle trajectory data were processed and extracted (Fig. 1).
Right turn on red is permitted in this intersection and cycle length of the intersection was 140 seconds.
Fig. 1 Data collection at an intersection
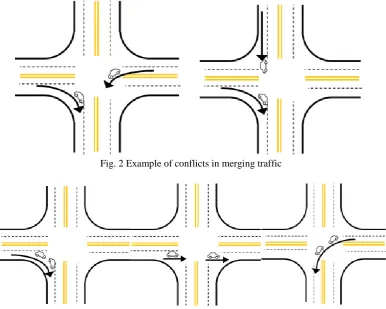
Different types of conflicts were identified. In this study, merging conflicts with right turn vehicles (Fig. 2) and conflicts
between vehicles moving in the same direction (Fig. 3) were collected and analyzed. The severity of conflicts was calculated
based on the vehicle position and speed data. Also, the conflict data were analyzed based on the timing data of the intersection
signal to find the correlations between the conflict and signal timing. Fig. 4 demonstrates the workflow in this research.
Fig. 2 Example of conflicts in merging traffic
Fig. 4 Research workflow
3.
Results
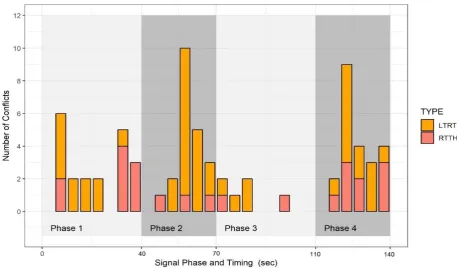
Conflicts between the vehicles moving in different direction were analyzed as shown in Fig. 4. It was found that a
significant number of conflicts occurred in signal phase two and four. Most of the conflicts were conflicts between left-turning
vehicles and through vehicles (Fig. 6). However, conflicts between right-turning vehicles and through vehicles were relatively
spread out in the entire signal timing period.
Fig. 5 Conflicts between the vehicles moving in a different direction
A total of 69 conflicts occurred between vehicles. Among those 69 conflicts, there were 46 conflicts between left turning
and right turning vehicles, and 23 conflicts between through moving vehicles and right turning vehicles. Of the 46 conflicts
that occurred between the left turning and the right turning vehicles, the largest number of conflicts, 18 cases occurred during
phase 2, representing about 39%. Subsequently, 13 and 11 conflicts occurred in phase 4 and phase 1, respectively, and the
Proceedings of Engineering and Technology Innovation, vol. 13, 2019, pp. 20-25 23
A total of 23 conflicts were found between through moving vehicles and right turning vehicles. This number is only 33
percent of the conflicts occurred between the left turning and the right turning vehicles. Considering the total number of
through moving vehicles, it is clearly seen that conflicts occurred more often between the left turning and the right turning
vehicles compared to conflicts between the through moving vehicles and the right turning vehicles.
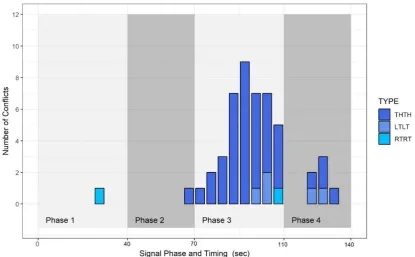
Fig. 5 demonstrates conflicts between the vehicles moving in the same direction. It is clearly seen that most of the
conflicts occurred in phase 3 while there were almost no conflicts during phase 1 and phase 2. Also, more conflicts occurred in
the middle and later part of phase 3 which implies that there might be correlations between the conflict and signal phase and
timing.
It has been known that vehicle speed and its standard deviation have correlations with accident and traffic conflict. It is
believed that the speed of the vehicle affects the accident severity as well in the event of a collision. The greater the variation in
the speed of the vehicle, the greater the probability of an accident.
It was assumed that the difference was coming from the speed difference of vehicles. For example, vehicles passing the
intersection during the latter half of phase tend to have higher speed than vehicles passing the intersection during the first half
of phase since vehicles in the queue at the intersection were gradually dissipated during the first half of phase, therefore
vehicles have lower speed during the first half of phase meaning less chance of having conflicts.
To verify the hypothesis average vehicle speed and its standard deviation were calculated for the vehicles passing the
intersection in the first half and the latter half of each phase. If the average speed of vehicles passing the intersection during the
latter half of phase is statistically higher than the speed of vehicles passing the intersection during the first half of phase, it is
likely that it may affect the frequency and the severity of the conflict.
Fig. 6 Conflicts between the vehicles moving in the same direction
4.
Conclusions and Future Work
Recent vision technology allows traffic engineers to analyze traffic safety based on image processing applications.
Vehicle trajectory data including vehicle position and speed are extracted and converted into traffic conflicts related variables.
These variables are analyzed to find correlations with crash data and geometric design variables and included in the statistical
process to investigate if there are any correlations with traffic conflict data. For example, traffic conflicts happen more
frequently in a certain movement at certain signal time phase.
In this paper, signal timing information data is included in the analysis process to investigate if there are any correlations
with traffic conflict data. Also, vehicle speed and its standard deviation are analyzed based on the assumption that traffic
characteristics might be different between vehicles passing the intersection during the latter half of phase and vehicles passing
the intersection during the first half of phase.
First, the number of conflicts were compared based on the directional signal phase. It was found that the number of traffic
conflicts by directional signal phase varies depending on the directional signal phase. Secondly, the characteristics of conflicts
were compared by conflict type. The results show that conflicts between vehicles running in different directions have different
characteristics by conflict type. Thirdly, the characteristics of conflicts were analyzed by the first and second half of directional
signal phase for the left turn and right turn vehicle conflicts. It was found that the conflict characteristics do not differ between
the first half and the second half of the phase. Finally, the characteristics of conflicts were analyzed by the first and second half
of directional signal phase for through and right turn vehicle conflicts. The results show that the conflict characteristics differ
according to the first half and the second half of the phase.
Underlying assumption on this analysis was that vehicles passing the intersection during the latter half of phase tend to
have higher speed than vehicles passing the intersection during the first half of phase since vehicles in the queue at the
intersection were gradually dissipated during the first half of phase, therefore vehicles have lower speed during the first half of
phase meaning less chance of having conflicts. Conflicts between the vehicles moving in a different direction at the selected
intersection were analyzed. Also, conflicts between the vehicles moving in the same direction at the selected intersection were
analyzed as well. It was found that there was a significant difference between the two conflicts. Additionally, the conflicts were
different between the directional movements of the vehicle.
It was found that a significant number of conflicts occurred in signal phase two and four. Most of the conflicts were
conflicts between left-turning vehicles and through vehicles. However, conflicts between right-turning vehicles and through
vehicles were relatively spread out in the entire signal timing period. Also, it was found that conflicts occurred more often
between the left turning and the right turning vehicles compared to conflicts between the through moving vehicles and the right
turning vehicles. Additionally, more conflicts occurred in the middle and later part of phase which implies that there might be
correlations between the conflict and signal phase and timing.
As shown in this paper, traffic conflicts happen more frequently in a certain movement at certain signal time phase. The
goal of this paper is to develop a method for vision technology-based traffic safety analysis process using traffic signal data to
identify crash prone movement and signal to time at a given intersection. More robust statistical analysis is required to
investigate the correlations between traffic conflicts and signal timing.
As limitations of this study, video data were collected at only one intersection. It is necessary to analyze more video data
collected from multiple intersections to compare the results from this study and compare with the results from other
intersections to verify the conclusion. Also, it is necessary to analyze additional factors affecting the characteristics of conflicts
in addition to the factors considered in this paper. In this study, the proposed image detection method extracts the vehicle
trajectory using the background subtraction method. However, this method generates false data when the target vehicle is
covered from other objects such as shadows, signal poles, and adjacent vehicles. Therefore, it is necessary to develop a video
detection method and a data analysis method that handles these problems more efficiently.
The preliminary experimental results from this study show that the proposed method has the potentials to be utilized as a
Proceedings of Engineering and Technology Innovation, vol. 13, 2019, pp. 20-25 25
traffic accidents which have been not analyzed in the conventional traffic safety analysis. Since the outcome of the paper is
based on the limited data set, the proposed method is not proven to be applied to other intersections. However, the proposed
method is believed to provide some insight into more efficient safety analysis. More extensive studies may be conducted in the
future to demonstrate the effectiveness of the proposed method in much greater testing scale.
Conflicts of Interest
The authors declare no conflict of interest.
Acknowledgments
This work was supported by NRF- 2017R1D1A1A09000606 of the National Research Foundation of Korea from the
Korean government.
References
[1] K. Ismail, T. Sayed, and N. Saunier, “N. Automated analysis of pedestrian-vehicle conflicts: context for before-and-after studies,” Journal of the Transportation Research Board, vol. 2198, no. 1, pp. 52-64, January 2010.
[2] A. Laureshyn, “Superpixel based road user tracker,” Workshop on the Comparison of Surrogate Measures of Safety Extracted from Video Data, Transportation Research Board 93rd Annual Meeting, November 2013, pp. 1-5.
[3] T. Madsen, C. Bahnsen, H. Lahrmann, and T. B. Moeslund, “Automatic detection of conflicts at signalized intersections,” Workshop on the Comparison of Surrogate Measures of Safety Extracted from Video Data, Transportation Research Board 93rd Annual Meeting. January 2014.
[4] W. Suh, J. Park, and J. Kim, “Traffic safety evaluation based on vision and signal timing data,” Proceedings of Engineering and Technology Innovation, vol. 7, pp. 37-40, 2017.
[5] N. Smaoui, K. Kim, O. Gnawali, Y. Lee, and W. Suh, “Respirable dust monitoring in construction sites and visualization in building information modeling using real-time sensor data,” Sensors and Materials, vol. 30, pp. 1775-1786, 2018. [6] W. Suh, J. Anderson, A. Guin, and M. Hunter, “Evaluation of video detection system as a traffic data collection method,”
Scientia Iranica, vol. 22, pp. 2092-2102, May 2015.
[7] M. Park, J. Kim, Y. Lee, J. Park, and W. Suh, “Vision-based surveillance system for monitoring traffic conditions,” Multimedia Tools and Applications, vol. 76, no. 23, pp. 25343-25367, December 2017.
Copyright© by the authors. Licensee TAETI, Taiwan. This article is an open access article distributed under the terms and conditions of the Creative Commons Attribution (CC BY-NC) license