Spring 2010, Volume 1, Number 3 Basic and Clinical
Using P300 to Evaluate the Effect of Object Color
Knowledge in Novelty Detection
Mohammad Amin Khoshlessan1-2, Sadra Sadeh2, Reza Nilipour2-3
1. School of Cognitive Science, Institute for Studies in Theoretical Physics and Mathematics (IPM), Tehran, Iran. 2. Medical School, Iran University of Medical Sciences, Tehran, Iran.
3. Department of Speech Therapy, University of Social Welfare and Rehabilitation Sciences, Tehran, Iran.
Background & Objective: In an oddball experiment, the context in which novel stimuli are presented affects characteristics of novelty P3, i.e. as long as there is a difficult task in which the difference between standard and target stimuli is small, recurrent presentation of a highly discrepant stimulus can lead to P300 highly similar to novelty P3. Effect of stimulus properties on P300 has also been previously examined and it has been shown that it plays a significant role in P300 topography, its amplitude and latency.Here we have examined the effect of surface color of objects of high color-diagnosticity in a visual oddball paradigm.
Materials & Methods: In two separate conditions, we used pictures of fruits as target and novel stimuli. In condition one, novel stimuli were pictures of fruits in their canonical colors. In the second condition, novel stimuli were the same photo filtered to have a different non-canonical color. P300 was compared among these conditions.
Results:Both target P3 and novelty P3 were detected in the two conditions but no significant difference was evident between conditions.
Conclusion: This result suggests that comparing to shape information; color cue does not play a significant role in detecting context novelty.
A B S T R A C T
Key words:
Event-related potentials,
P300, Novelty P3,
Object,
Color knowledge, Attention.
Introduction
300 as an event-related brain potential has long been investigated and for the past forty years a rich literature has been provided about its cognitive significance and possible neural generators (Friedman et al. 2001; Polich 2004; Linden 2005).
P
The signal was first elicited during an Oddball para-digm in which rare “target” stimuli were presented ran-domly in a train of frequently appearing “standards” (Sutton et al., 1965). In their paradigm, subjects were pre-viously instructed to respond to the targets or silently count them while the standard had to be ignored. A positive going wave peaking in a range of 300-600
post-*Corresponding Author:
Mohammad Amin Khoshlessan, School of Cognitive Sciences, Institute for Studies in Theoretical Physics and Mathematics (IPM), Niavaran Bldg., Niavaran Square, Tehran, Iran, P. O. Box 19395-5746, Tel: +98 21 2229 4035, Fax: +98 21 2228 0352, Email: [email protected]
Article info:
trials in which novel, task –irrelevant distracters were presented(Courchesne et al., 1975). This novelty P3 had a frontal-central distribution and a shorter peak latency comparing to P3b. It has been suggested that P3b re-flects working memory update i.e. reactivation of work-ing memory template of targets upon target stimulus presentation (Donchin, & Coles, 1988). Novelty P3 then could be attributed to involuntary capture of attention, as an indicator of novelty detection and neural electri-cal activity of orienting response (Friedman et al., 2001; Sokolov, 1963; Goldstein et al., 2002).
Although the original oddball paradigm were consist-ed of simple acoustic tones, similar results have shown that P3 is modality-independent and as an endogenous cognitive ERP can be retrieved by auditory, visual and tactile stimuli, (Knight, 1984, Ranganath & Rainer, 2003), and even by omission of a stimulus in a series of task-rele-vant stimuli (Ruchkin, 1988).
Another question was the effect of context in which task-relevant or task-irrelevant infrequent stimuli (i.e. targets and novels) were presented on the elicited P3 which was addressed by Polich and colleagues (Comer-chero & Polich, 1998; Katayama, & Polich, 1998) who showed that novelty P3 is context dependant in the sense that when the target/standard discrimination is difficult and task-demanding, repeated presentations of one rare non-target stimulus in a series of standards and non-targets could lead to a novelty P3-like deflection in the ERP, which could be manipulated by varying the salience of rare non-targets upon its context. Therefore they showed that it is novelty per se which leads to P300 anteririza-tion (Fabiani, & Friedman, 1995).
tion tion
The stimuli used by Polich et al., like most other visual oddball experiments conducted previously, consisted of simple drawings of geometric shapes, random noise patches or other synthetic arbitrary shapes. Comprehen-sible advantages of such simple stimuli have lead to a rather standard paradigms also adopted by clinical and neuropsychological investigations (Linden, 2005).
Apart from context, effect of stimulus characteristics upon variations of p300 is an equally valid question which has recently been posed by Gaeta and others (Ga-eta et al., 2003; Cycowicz, & Friedman 2003; Debener et al.). In their works, complex novel environmental sounds were
they showed that stimulus properties also play a role in P300 topography, amplitude and latency.
In visual modality, surface color of the stimulus is a feature which is of significance in various ways. Color is an effective cue for identification and selection of rel-evant objects (Anllo-Vento, 1998). Although most theories of object recognition value shape information in object recognition and categorization, some theories account for the role of an object’s surface properties, like color and texture, in representations (Krauskkopf et al., 1982; Buchsbaum, & Gottschalk, 1983). Hawken & Gegenfurtner (1999) showed that color has significant impact on the recognition of objects with high color-diagnosticity, i.e. objects that consistently appear in a typical color. As shown by Hansen and Colleagues (Hansen et al., 2006) memory color of objects is important in perception and recognition of objects which have typical canonical col-ors in everyday life. The stimuli they used were fruits and they showed that subjects tended to perceive them in their prototypical color. Some neuropsychological evidences, from two patients J.B. and I.O.C showed that although they have intact knowledge of shape informa-tion and normal color percepinforma-tion but they were unable to match objects with their prototypic colors (Gegenfurt-ner, 2003; Miceli et al., 2001).
Although the evolutionary advantage of color vision is unclear(Gegenfurtner, & Rieger, 2000),cognitive advan-tage of applying color cues for recognition of objects that have high color-diagnosticity has usually been ex-plained(Gegenfurtner, & Rieger, 2000; Wichmann et al., 2002) in an evolutionary framework, e.g. the importance of detecting red ripe fruit against green foliage in case of fruits.
Hence it seems quite sound to pose a question about the novelty or deviance of colored objects, especially when they have high color-diagnosticity, as they are presented in a discrepant color. This is the main ques-tion of our report.
Spring 2010, Volume 1, Number 3 Basic and Clinical
Methods
Subjects
Ten healthy male adult subjects were recruited from university students (Mean age: 23, Min: 19, Max: 31). All subjects signed informed consent and reported to be free from neurological or psychiatric disorders, normal or corrected-to-normal vision and right-handed. Data from two additional subjects were excluded from the analysis due to non-correctable blinking artifacts and technical problems during recording.
Stimuli & Task
A set of eleven photos of fruits were selected from Hem-era Photo-Objects (http://www.hemHem-era.com), all in natural era Photo-Objects (http://www.hemera.com
era Photo-Objects (http://www.hemera.com
shape and color. Pictures were resized to have the same number of pixels corresponding to a predefined standard size; Then for both conditions, vis. natural and synthetic, two other categories of stimuli were made in the following fashion (Figure 1).
Subjects were seated in a dark and sound-attenuated room facing a PC monitor at a distance of 100 cm. Par-ticipants were instructed to fixate on a cross centrally located on a white background. Each stimulus was presented for 100 ms with an inter-stimulus interval of 1000 ms Before the test starting subjects went through a training phase in which they would get acquainted with both natural and target stimuli. In training a group of 20 pictures (16 standards and 4 targets) would be shown to participants and they were instructed to respond as quickly and accurately as they could to target stimuli by pressing the button with their right forefingers on a response box. Test trials would start only in case the subjects could detect 85% of the target stimuli and re-spond to them within 1000 ms. Otherwise the training would continue for another twenty stimuli block. Once subjects passed the training, test trial would start com-prising of a series of 160 standard, 10 target and 10 nov-el pictures. Stimuli were presented in a pseudorandom sequence in which no target or novel stimuli would pre-cede each other. Novel pictures appeared randomly on either side of the screen. Reaction time and error rates were recorded.
Fig. 1: Stimuli in order of their categories
A: Canonical context in which 1. Standard stimulus is a 100% size of the picture of a fruit, canonical color, center, 2.Target stimulus is a 120% standard size, canonical color, center
3. Novel stimulus is a 250% standard size, non-canonical color, side
B: Non-canonical context in which 1. Standard stimulus is a 100% size of the picture of a fruit, non-canonical color, center, 2. Target stimulus is a 120% standard size, non-non-canonical color, center 3. Novel stimulus is a 250% standard size, canonical color, side
A-1 B -1
B -2 A-2
A-3
+
+
ance amplifier and Ag/AgCl electrodes mounted in an electrode cap. The electrode positioning on the scalp was according to the 10-20 international system. Elec-trodes on the Right side of the scalp were: FP2, F8, FT8, T8, TP8, P8, F4, FC4, C4, CP4, P4; on the Central side: FZ, FCZ, CZ, CPZ, PZ; on the Left side: FP1, F3, FC3, C3, CP3, P3, F7, FT7, T7, TP7, P7; and on Occipital: O1, OZ, O2.
To ensure that fixation was maintained, the horizontal and vertical EOGs were also recorded. Vertical EOG was recorded bipolarly from electrodes placed below and above the left eye, whereas horizontal EOG was recorded bipolarly from electrodes placed on the outer canthi of the two eyes.
Reference lead was linked to bilateral mastoids. All electrode impedances were reduced with a band pass of 0.05 to 30 Hz and digitized at 1000 Hz (0.024 Micro volt per precision) for later off-line analysis.
Data Analysis
EEG data analysis was performed using EEGLAB (version 4.515), a freely available open source toolbox running under MATLAB version 7 (The Mathwork Inc.),(Delorme, & Makeig, 2004).
First, data were down-sampled to 250 Hz to save later computation time. Data epochs were extracted (-200 to 800 ms) and baseline was corrected (-200 to 0 ms). Trials contaminated by eye or body movements were rejected. Artifact rejection by extreme value was used before averaging to discard epochs in which eye movement, blinking, excessive muscle potentials or amplifier blocking occurred. The criterion for artifact rejection was a peak-to-peak amplitude exceeding ±40 microvolts of EOG and HOG electrodes, and the rejec-tion rate was about 15%. ERP epochs were averaged off-line from 200 ms before to 800 ms after stimulus onset. The peak latencies of the P3s were measured on the difference waveforms in a range of 270-770 ms post-stimulus. Average amplitude in the same range was measured as P3 amplitude. Since no laterality effect was expected, only data from the midline electrodes were statistically analyzed. Also to facilitate evaluation of the frontal-to-parietal scalp topography, five regions of
In addition, averages were generated separating for the first three and last three presentations of target and novel stimuli in both contexts to assess habituation. In-dependent sample T-test for behavioral data and repeat-ed measures analysis of variance were performrepeat-ed on P3 component indices. Greenhouse-Geisser correction İFRUUHFWLRQIDFWRUIRUODFNRIVSKHULFLW\ZDVDSSOLHG when appropriate.
Results
Behavioral Data
The task was performed equally well in the two condi-tions by all subjects (Table 2). Reaction times exceeding ±3 standard deviations were excluded from RT indepen-dent sample t-test. The mean reaction time was slightly longer in non-canonical context, but the difference was not significant.
Electrode Sites
Frontal F3, FZ, F4
Central FCZ, CZ, CPZ
Parietal P3, PZ, P4
Left FC3, C3, CP3
Right FC4, C4, CP4
Table 1. Regions of interest
Canonical context
Non-canonical context
% Hit 86 83
% False alarm* < 0.1 < 0.1
Mean RT 464 ms 475 ms
Table 2. Reaction time & performance accuracy during the task
Spring 2010, Volume 1, Number 3 Basic and Clinical
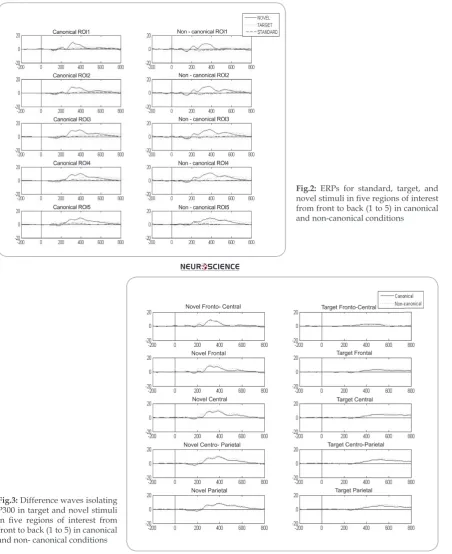
Electrophysiological Result Figure 2 shows grand mean ERP waveforms in ca-nonical and non-caca-nonical conditions. As expected, in both conditions, P300 was generated for target stimuli with a more central-parietal topography. Again in both conditions, novelty P3 with a larger peak amplitude and shorter peak latency than target P3s could be detected in
Fig.2: ERPs for standard, target, and
QRYHOVWLPXOLLQÀYHUHJLRQVRILQWHUHVW
from front to back (1 to 5) in canonical and non-canonical conditions
Fig.3: Difference waves isolating P300 in target and novel stimuli
LQ ÀYH UHJLRQV RI LQWHUHVW IURP
Since standard stimuli were different in the two differ-Since standard stimuli were different in the two differ Since standard stimuli were different in the two differ ent experimental conditions (fruit in its canonical color vs. fruit in its non-canonical color) difference waves (Pic-ton et al., 2000) were applied to better isolate P300 (Fig-ures 3-4). Also, given the fact that in our experiment, p3 amplitude and latency were computed by averaging, dif-amplitude and latency were computed by averaging, dif amplitude and latency were computed by averaging, dif ference waves were applied to better isolate components (Steve Luck, 2005). In the left panel of figure 3, novelty p3 is compared in canonical vs. non-canonical condition in all the five regions of interest. As can be seen, there is little difference in the waveforms and their topographic distribution. The same pattern is apparent for the target stimuli (Figure 3, right panel).
difference in P3 amplitudes in different regions of inter-HVW) İ S$OVRWKHUHZDV a main effect of stimulus type which was near-signifi-cant (p < 0.1). Although in the second condition mean P3 amplitude was larger than canonical condition for both types of stimuli, this pattern did not lead to a sig-nificant difference (p>0.1). Same statistics were applied to P300 latencies. As can be seen in figure 2, as it could be expected, novelty P3 had shorter peak latency in both conditions; however there was no significant difference DPRQJFRQGLWLRQV) İ S!:H also looked for habituation effect on trials where novel distracter stimuli were presented. Fig 6 shows that un-like the first condition habituation had occurred in the
Spring 2010, Volume 1, Number 3 Basic and Clinical
second condition i.e., P3 peak amplitude for the last sequence of novel stimuli in the second condition was PXFKOHVVWKDQWKHILUVWVHTXHQFH) İ p=0.12).
Discussion & Conclusion
Our question was about the difference in novelty p3 characteristics when high-color-diagnostic familiar ob-jects (fruits) were presented having non-canonical color in a series of the same photos of fruits with natural color vs. the condition in which canonical colored photos of fruits were non-target distracter stimuli in a series of photos with non-canonical colors. This was addressed by assessing three well known characteristics of p300: its amplitude, latency and habituation.
The fact that we obtained p300 leaning more towards parietal regions for target stimuli and rather more cen-tral in distracter trials is in accordance with the
previ-ous reported results on p3 (Friedman et al., 2001). This was accompanied by a near significant difference among stimulus types which could be considered as a replica-tion of paradigms in which one single highly discrep-ant stimulus had led to novelty p3. As various authors (Demirlap, 2001; Polich, & Comerchero 2003) have shown task difficulty plays a crucial role in such paradigms, lack of statistical significance in this case might be due to our relatively simple task.
It has been suggested that both physical properties of the novel stimuli and the context in which it is presented affect novelty p3 (Ranganath, & Rainer, 2003). Since the deviance of non-target distracter stimulus comparing to its context was the same in both canonical and non-canonical conditions (Figure 1) any difference between p3 characteristics among the conditions could be attrib-uted to the physical properties of the stimulus. However this notion was not supported by comparing the am-plitude and latency in different conditions. Yet, results Fig. 5: Voltage maps for p300 based on difference waves, in: canonical condition (Cond1),
obtained from statistical analysis of habituation effect, showed near-significant difference among conditions, which could be explained in the following fashion. It seems that natural novel stimulus presented in synthetic context matches with its representation in the central-parietal regions, and gradually as subject becomes fa-miliarized the p300 amplitude dramatically decreases. In contrast, synthetic non-target distracter did not have such representational advantage; hence, subject should
Spring 2010, Volume 1, Number 3 Basic and Clinical
Table 1: Regions of interest
As we are currently investigating, more controls on stimuli will lead us to properties with more salient ef-fect on novelty detection.
Acknowledgments
This research has been conducted in Center for Cogni-tive Brain Research of Shahid Beheshti University of Medical Sciences. The authors wish to thank Professor Hossein Esteky for his support. Special thanks go to Mr. Ashkan Golzar who helped with computer program-ming, David Linden, Steve Luck and J.D. Saddy for their helpful comments.
References
Anllo-Vento, L., Luck, SJ., & Hillyard, SA. (1998). Spatio-tem-poral dynamics of attention to color: Evidence from human electrophysiology Human Brain Mapping, 6: 216-238.
Buchsbaum, G., & Gottschalk, A. (1983). Trichometry, oppo-nent colours coding & optimum colour information trans-mission in the retina. Proc. R. Soc. Lond, 220: 89-113.
Comerchero, MD, & Polich, J. (1998). P3a, perceptual distinc-tiveness & stimulus modality. Cognitive Brain Research, 7: 41-48.
Courchesne, E., Hillyard, S. A. & Galambos, R. (1975). Stimu-lus novelty, task relevance & the visual evoked potential in man.Electroencephalography & Clinical Neurophysiology, 39: 131-143.
Delorme, A., & Makeig, S. (2004). EEGLAB: an open source toolbox for analysis of single-trial EEG dyamics including independent component analysis. J. Neurosci. Methods, 134: 9-21.
Donchin, E., & Coles, M G H. (1988). Is the P300 component a manifestation of context updating? Behavioral & Brain Sci-ences, 1: 357-374.
Fabiani, M., & Friedman, D. (1995). Changes in brain activity patterns in aging: the novelty oddball. Psychophysiology, 32: 579-594.
Friedman, D., Cycowicz, YM., & Gatea, H. (2001). The novelty P3: an event-related brain potential (ERP) sign of the brain´s evaluation of novelty. Neurosci Biobehav Rev, 25: 355-373.
Gaeta, H., Friedman, D., & Hunt, G. (2003). Stimulus charac-teristics & task category dissociate the anterior & posterior aspects of the novelty P3. Psychophysiology, 40: 198-208.
Gegenfurtner, K.R., & Rieger, J. (2000). Sensory & cognitive contributions of color to the recognition of natural scenes.
Goldstein, A6SHQFHU.0 'RQFKLQ(7KHLQÁX -ence of stimulus deviance and novelty on the P300 & nov-elty P3. Psychophysiology, 39: 781-790.
Hansen, T., Olkkonen, M., Walter, S., & Gegenfurtner, KR. (2006). Memory modulates color appearance. Nat. Neurosci,
9 (11): 1367-8.
Hawken, M.J., & Gegenfurtner, K.R. (1999). in Color Vision: From Genes to Perception (eds. Gegenfurtner, K.R., Shapiro, L.T.) 283-299, Cambridge Univ. Press, NewYork.
Kazmerski, V.A. & Friedman, D. (1995). Repetition of novel stimuli in an ERP oddball paradigm: aging effects. J. Psycho-physiol, 9: 298–311.
Knight, R.T. (1984). Decreased response to novel stimuli after prefrontal lesions in man. Electroencephalogr Clin Neurophys-iol, 59: 9–20.
Krauskkopf, J., Williams, D.R., & Heely, D.W. (1982). Cardi-nal directions of color space, Vision Res, 22: 1123-1131.
Linden, D. (2005). The P300: Where in the Brain Is It Produced and What Does It Tell Us? The Neuroscientist, 11(6): 563-576.
Luck, SJ. (2005). An Introduction to the Event-Related Potential Technique, Pp. 51-99. MIT press, Cambridge, Massachusetts.
Miceli, G., Fouch, E., Capasso, R., Shelton, J R., Tomaiuolo, F. & Caramazza, A. (2001). The dissociation of color from form & function knowledge. Nat Neurosci, 4: 662 - 667.
Picton, T.W., Bentin, S., Berg, P., Donchin, E., Hillyard, S.A., Johnson, RJR., Miller, G A., Ritter, W., Ruchkin, D S., Rugg, M D. & Taylor, M J. (2000). Guidelines for using human event-related potentials to study cognition: Recording standards & publication criteria. Psychophysiology. Cambridge University Press.
Polich, J. (2004). Neuropsychology of P3a & P3b: A theoretical overview. In N. C. Moore & K. Arikan (Eds.),Brainwaves & mind: Recent developments. (pp. 15–29). Wheaton, IL: Kjell-berg.
Ranganath, C., & Rainer, G. (2003). Neural mechanisms for detecting & remembering novel events. Nat Rev Neurosci, 4: 193-202.
Sokolov, E.N. (1963). 3HUFHSWLRQ WKHFRQGLWLRQDOUHÁH[3HUJD
-mon press, Oxford, Uk.
Sutton, S., Braren, M., Zubin, J. & John, ER,. (1965). Evoked potential correlates of stimulus uncertainty. Science, 150: 1187-88.