EXPLORING SIMPLE MODELS FOR DRUG DELIVERY IN OCULAR
DEVICES: DIFFUSION 1D, 2D AND EFFECT OF DRUG-POLYMER
BINDING
A.D.S.M.R. Pascoal
a, P.M. da Silva
b,c, M.N.C. Coelho Pinheiro
a,d,*a Instituto Superior de Engenharia do Instituto Politécnico de Coimbra, Departamento de Engenharia Química e Biológica, Rua Pedro Nunes,
Quinta da Nora, 3030-199 Coimbra, Portugal
b Instituto Superior de Engenharia do Instituto Politécnico de Coimbra, Departamento de Física e Matemática, Rua Pedro Nunes, Quinta da Nora,
3030-199 Coimbra, Portugal
c Centro de Matemática da Universidade de Coimbra, Apartado 3008, EC Santa Cruz,3001 - 501 Coimbra, Portugal
d Centro de Estudos de Fenómenos de Transporte, Faculdade de Engenharia da Universidade do Porto, Rua Dr. Roberto Frias, 4200-465 Porto,
Portugal
ABSTRACT
Efforts have been made to obtain new drug formulations in ophthalmologic applications to replace eye drops that are inefficient. Soft contact lenses have been using as an ophthalmic drug delivery device. Several hydrogels were used to prepare solid matrices with the drug impregnated. Assuming drug diffusion within polymeric devices as the dominant mechanism in the mass transfer process, simple models were developed to describe drug release from an ocular delivery device. The timolol maleate (medicine for glaucoma treatment) dissolution profile in the release medium for methacrylate hydrogels based contact lenses were obtained experimentally and compared with predictions considering one-dimensional and two-dimensional models. No significant differences were obtained from both predictions because the contribution of drug diffusion through radial direction in the lens is negligible, because thickness is much smaller than diameter. Although a simplistic zero-sink boundary was used to obtain the predictions, the comparison with data seems to indicate an incomplete release of the amount of timolol initially loaded into the lens. Possibly strong no reversible interactions between drug and hydrogel occur.
Keywords: Modeling drug delivery; Ocular drug device; Kinetics of drug release
1. INTRODUCTION
In ophthalmologic applications eye drops account for more than 90% of all drug formulations. However, due to tear drainage and absorption through conjunctiva they are inefficient with only about 5% of the drug administrated penetrating through cornea. To avoid this, topical eye formulations normally require high drug concentrations and frequent dosing treatments. This pulsed type of dosing not only results in extreme fluctuations in ocular drug concentrations but may also increase systemic side effect risks. In order to improve the drug bioavailability, soft contact lenses are used as an ophthalmic drug delivery system. Recently several studies have been developed in order to use polymers in the preparation of controlled drug delivery systems for glaucoma, a disease that affects the internal human eye (Ciolino et al. (2016), Jung et al. (2013), Singh et al. (2011), Ferreira et al. (2010)).
Associated with the technological advances and development of new drug delivery vehicles for specific treatments has been the scientific acknowledgment of the importance in understanding the medication transfer mechanisms and constraints in the process. Several studies have been publishing, demonstrating this concern and promoting new solutions in the controlled drug releasing (Wang et al. (2012) Lee (2011), Yuan et al. (2011)).
Identify the problem, develop and implement a mathematical model to describe the physical phenomena associated, analyze the predictions obtained and gather it with data for model performance evaluation were
the fundamental steps used in this study concerning the drug release from an ocular device.
The ocular delivery device, methacrylate hydrogels based contact lens, was prepared in the laboratory and incorporated with a medicine for glaucoma treatment. The medication release kinetics was obtained experimentally, following its concentration in the releasing medium, and was compared with predictions resulting from simple models considering drug diffusion in the hydrogel as one-dimensional and two-dimensional transient diffusional problem. MATLAB was the tool used to simulate the time evolution of the drug in the ocular lenses, using a finite difference method.
With the numerical results it was possible to compare the simulations with the experimental data, obtained in a laboratory environment, and understand some phenomena associated with drug delivery from polymeric matrices. In fact, after the validation of the model, it can easily be used to obtain release profiles for different delivery platforms or drugs with different properties.
2. THE PHYSICAL SITUATION
Drug transport through polymeric devices is usually described as a non-steady state diffusion problem when structural modifications in solid matrices are negligible. With drug diffusion as the controlling mechanism for mass transfer, the Fick’s second law of diffusion can be used
Frontiers in Heat and Mass Transfer
2
(
)
AA
C D C
t
∂
−∇ • − ∇ =
∂ , (1)
where CA is the drug concentration in the solid matrix, D is the drug diffusion coefficient and t represents the time. Assuming constant drug diffusion coefficient, the last equation is given by
(
)
2 AA A
C D C D C
t
∂
∇ •∇ = ∇ =
∂ . (2)
For therapeutic soft contact lens, it is usual to consider the cylindrical coordinates (r, θ, z,) to describes the diffusion medium and the following equation is applied,
2 2
2 2 2
1 CA 1 CA CA CA
D r
r r r r θ z t
∂ ∂ + ∂ ∂ ∂
+ =
∂ ∂ ∂ ∂ ∂
. (3)
Drug release from an ocular device encompasses several physical and chemical phenomena as, for example, solvent and drug diffusion in opposite directions through the polymeric matrix, adsorption/desorption processes, polymer swelling and erosion. Structural changes in the polymeric chains occur when the device is applied in the release medium in order to accommodate the penetrant molecules of solvent and is followed by polymer relaxation.
When solute diffusion and polymer relaxation have similar magnitudes the problem of drug release from the ocular device is complex. However, in situations where solute diffusion is the dominant step, Fickian diffusion exists and the equation presented could be used to completely explain the process as relaxation in the polymeric network of the device does not greatly influences mass transfer.
3. THE MATHEMATICAL APPROACH
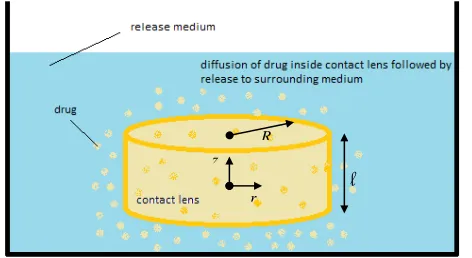
For ocular delivery devices, as contact lenses with drug incorporated, thin discs must be considered to represent the solid geometry. The drug delivery process is illustrated in a simple sketch in Fig. 1.
Fig. 1 Sketch of a contact lens with drug incorporated as an example of an ocular delivery device.
3.1 Ocular drug device - two-dimensional diffusion
Considering negligible drug gradients in the angular direction θ, Eq. (3) is written as
2 2
1 CA CA CA
D r
r r r z t
∂ ∂ +∂ ∂
=
∂ ∂ ∂
∂
. (4)
In order to completely describe the two-dimensional diffusion problem inside the ocular drug device, the following initial condition can be applied if the medication incorporated inside the lens is uniformly distributed,
(
, , 0)
A Ai
C r z t= =C , r∈
[
0,R]
∧ ∈ −z[
2,2]
(5) and Eqs. (6) and (7) could be used as boundary conditions,(
)
[
]
(
)
[ ]
0, , 0, , 2 , 0, 0,
0, 0
2
A A
C C
D r z t z D r z t
r z
r R t
∂ ∂
− = = ∈ − ∧ − = =
∂ ∂
∈ ∧ >
(6)
(
)
[
]
(
)
[
]
, , , 2, 2 , 2, ,
0, 0
A As A As
C r R z t C z C r z t C
r R t
= = ∈ − ∧ = =
∈ ∧ >
(7)
where R represents the lens radius and
its thickness. A symmetric drug concentration distribution around the planes at r = 0 and z = 0 of the lens is established with the boundary conditions presented in Eq. (6). This requirement is suitable considering a well-stirred release medium surrounding a polymeric lens with uniform structure (isotropic material). The Dirichlet boundary conditions type in Eq. (7) specify the drug concentration in the polymeric matrix on its (lateral and upper) surface exposed to the release medium, which is assumed to be constant and virtually zero (CAs≈ 0) as a first approximation. As Eq. (6) considers symmetry about the plane passing through z = 0, is already imposed that the drug concentration at the lower surface (z =−
2) of the polymeric lens is also constant and equal to CAs.For the sake of simplicity in developing the MATLAB code, a Cartesian coordinate system (x, z) was adopted for the two dimensional case using the concept of solid of revolution. Following this option, the mathematical model considered to solve the problem will be described next and the correspondent domain of discretization will be presented in section 4.
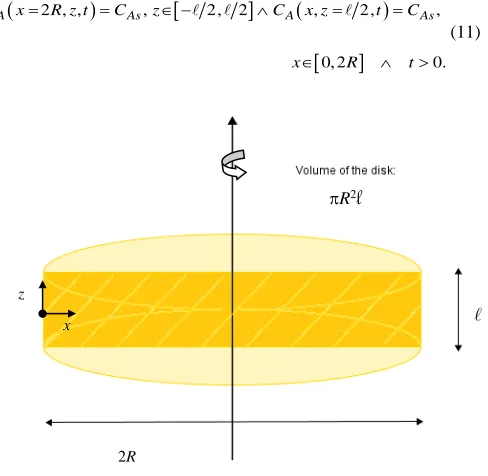
In order to work with Cartesian coordinates, the thin disc representing the contact lens can be imagine to be formed by revolving a representative rectangle (2R ×
) about the axis of revolution by 180º, as is illustrated in Fig. 2. As the drug concentration throughout the angular direction was considered nearly uniform, the discretization of the rectangular domain parallel to the axis of revolution is enough to describe the drug diffusion inside the lens and the following differential equation in Cartesian coordinates (x, z) can be applied to describe the diffusion problem,2 2
2 2
A A A
C C C
D
t
x z
∂ ∂ ∂
+ =
∂ ∂ ∂
, (8)
with the initial condition, Eq. (5), and the boundary conditions, Eqs. (6) and (7), writing in terms of the new coordinates,
(
, , 0)
A Ai
C x z t= =C , x∈
[
0, 2R]
∧ ∈ −z[
2, 2]
, (9)(
)
[
]
(
)
[
]
0, , , 2, 2 , 2, ,
0, 2 0
A As A As
C x z t C z C x z t C
x R t
= = ∈ − ∧ = − =
∈ ∧ >
(10)
l
z
(
)
[
]
(
)
[
]
2 , , , 2, 2 , 2, ,
0, 2 0.
A As A As
C x R z t C z C x z t C
x R t
= = ∈ − ∧ = =
∈ ∧ >
(11)
Fig. 2 Illustration of the disc and the work plane used to revolve about the axis of revolution and form the geometry.
In pharmacokinetics studies the drug delivered to the release medium is followed along time. With the aim to quantify the amount of drug released from the ocular device, a methodology to determine the mass of drug within the lens for each instant of time t, must be developed. After drug concentration distribution determination, the spatial integration for all domain must be performed for specific instants t, using
( )
2 2(
)
0 2 , ,
2
R A
M t =π R
∫ ∫
− C x z t dx dz , (12)
where M (t) represents the amount of drug inside the ocular device at the instant of time t. Hence, the mass of drug released until that instant t can be obtained by difference from the amount of drug loaded in the lens (Mi=πR2
CAi).3.2 Ocular drug device - one-dimensional diffusion
Assuming that lenses lateral surface is much smaller than upper and lower surface a simpler partial differential equation, for one-dimensional diffusion problem can be used to describe the drug release process,
2 2
A A
C C D
t z
∂ =∂
∂
∂ . (13)
Beyond the initial condition,
(
, 0)
A Ai
C z t= =C , z∈ −
[
2,2]
, (14)the boundary conditions should be rewritten for the simplified situation,
(
0,)
0A C
D z t
z
∂
− = =
∂ , t>0, (15)
(
2,)
A As
C z= t =C , t >0, (16)
in order to completely describe the mass transfer problem.
The mass of drug inside the lens, in each instant of time t, M (t), can be calculated from integration of the spatial drug concentration distribution, using:
( )
2 2( )
0
2 A ,
M t = πR
∫
C z t dz. (17)subtracting Eq. (17) from the initial amount of drug incorporated inside the lens, Mi=πR2
CAi, the drug released to the release medium is obtained, as referred before for the two-dimensional case.4. NUMERICAL RESOLUTION
In order to obtain the distribution of drug concentration in the polymeric device and the total mass released with time, numerical simulations were performed to solve the diffusion equation, considering Cartesian coordinates. This equation will be solved for one-dimensional (Eq. (13)) and two-dimensional (Eq. (8)) cases using an explicit difference equation methodology.
A simple finite difference method were used to discretize the partial differential equations representing the drug diffusional process in the polymeric matrices. A central difference formula of second order were applied to discretize the second order derivative and the explicit Euler method of first order in time was used for the first derivative.
The trapezoidal rule was used to solve the spatial integration to obtain the amount of drug in the polymeric devices for each time t, in both cases, two-dimensional and one-dimensional, as described by Eq. (12) and Eq. (17), respectively.
All simulations were computed with MATLAB software.
The dimensional characterization of the copolymer disc of poly(hydroxyethyl methacrylate), HEMA, and methacrylic acid, MAA, used in the experiments and to obtain the predictions is presented in Table 1. Also in that table is the timolol maleate concentration incorporated inside the lens and the value of its diffusion coefficient in the polymer disc, which was obtained from the data collected during the kinetics experiment as described by Silva and Coelho Pinheiro (2013). Time and space steps used in the numerical method implemented in MATLAB are also indicated in the Table 1.
Table 1 Parameters used to obtain the predictions in the ocular drug device, which correspond to the kinetics experiment conditions performed.
timolol maleate diffusion coefficient
in the polymeric matrix (m2/s) 2.54×10 -12
polymer disc dimensions
thickness (m) 0.50×10⁻³
diameter (m) 16.85×10⁻³
initial timolol maleate concentration
in the polymer disc (mg/mL) 5.65
time (h) 48
space steps, m 1D ∆z = 10 -5
2D ∆z =∆x = 10-5
time steps, s
1D ∆t = 1.728×10⁻²
(∆t*= 10-7)
2D ∆t = 1.728 (∆t* = 10-5)
As well known by the literature, although the explicit method is of straightforward application and resolution it has a limitation on the size of the time step ∆t. The stability conditions ∆t < 0.5∆z2/D, for the
one-dimensional problem, and ∆t < 0.25 h2/D, where h= ∆x = ∆z, for the
two-dimensional problem, are required. It should be emphasized that the numerical method was implemented with the variable t adimensionalized πR2
l
x z
4 (t*) by the total time of dissolution (48 h). The correspondent time step ∆t* is also indicated in Table 1.
5. PREDICTIONS
5.1 Ocular drug device - two-dimensional diffusion
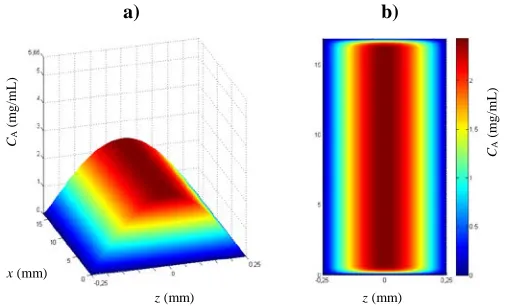
The timolol maleate concentration profiles inside the lens, corresponding to different drug releasing times, can be predicted with the two-dimensional mathematical approach presented previously. In Fig. 3 is shown the drug concentration distribution after 3 h of lens’ immersion in the release medium, using two equivalent representations. In Fig. 3 a) a three-dimensional representation was used with the drug concentration read directly in the vertical axis (y) of the graph and each vertical plane, parallel to the y x plane, corresponds to a lens slice along its thickness; the color gradient used in the graph (unnecessary) only helps to evaluate the magnitude of drug concentration inside the lens. In Fig. 3 b) a two-dimensional representation of the lens’ spatial domain was presented and the drug concentration distribution is represented by a color gradient scale identified in the right side of the graph. Drug concentration in the polymeric disc on its surface exposed to the release medium is constant and (virtually) zero, as a consequence of the zero-sink boundary condition used in the numerical approach.
Fig. 3 Drug distribution predicted inside the lens after 3 hours of the delivery process with the two-dimensional mathematical approach, shown in similar representations: a) three-dimensional and b) two-dimensional.
As expected, symmetric concentration profile relatively to the central point (x = R and z = 0) of the lens is developed within the polymeric matrix, which will become flatter as the releasing process continues in a three-dimensional representation or with progressively smaller warm colors surface (reds, oranges and yellows) in a two-dimensional representation, as it is shown in the snapshots of the drug concentration profile presented in Fig. 4.
After 5 minutes of immersion in the release medium only a small slice near the top and the bottom of the polymeric disc have a deficit of drug. Outside those regions the drug concentration is still equal to the initial concentration (5.65 mg/mL), indicating that although all the external surface of the lens is exposed to the release medium (virtually free of drug) the mass transfer rate through its lateral surface is very small compared to the rate of drug leaving the top and the bottom of the lens. This is a consequence of the lens’ cross section area being much larger than the lateral surface, which corresponds only to 0.12% the total area of the lens. At the end of the drug release process, the lens is practically depleted in drug and the coldest color (blues) is the predominant color in the two-dimensional graph corresponding to 24 h of immersion in Fig. 4. As a zero-sink boundary condition is used for simplification to describe
the physical situation, theoretically all the drug loaded into the lens can be released if the releasing process is long enough.
Fig. 4Evolution of drug distribution inside the lens during 24 hours of the delivery process obtained with the two-dimensional mathematical approach.
5.2 Ocular drug device - one-dimensional diffusion
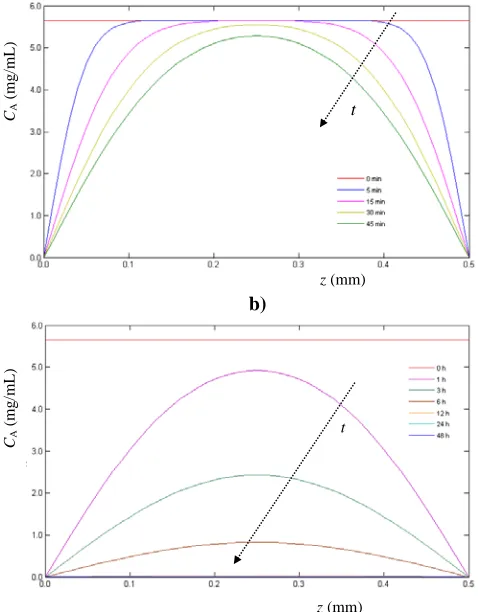
The numerical resolution of Eq. (13), with the initial condition and boundary conditions shown previously in Eqs. 14, 15 and 16, gives the evolution of drug concentration inside the ocular device during the time it is immersed in the release medium. Some of the drug concentration profiles are presented in Fig. 5. In Fig. 5 a) are shown the profiles developed for different instants within the first hour of the releasing process and the profiles in Fig. 5 b) correspond to greater periods until the end of the process.
The profile for t = 0 represents the initial condition used, CA = CAi = 5.65 mg/mL, the drug concentration uniformly distributed inside the ocular device at the beginning of the release process.
When the dissolution process is initiated a drug concentration gradient near the surface of the lens is developed promoting the diffusion process within the ocular device towards the release medium. Then, the concentration starts to decrease from the periphery to the interior of the lens and symmetrically to the medium plane along its thickness (z = 0.25 mm). After 15 min in a small region in the lens’ interior the drug concentration is already the initial concentration of 5.65 mg/mL, as can be seen in Fig. 5 a). For dissolution periods greater than 30 min the drug concentration in all locations are lower than the initial value and the parabolic profiles becomes more and more flat for greater periods of drug dissolution as represented in Fig. 5 b). The drug concentration is virtually zero throughout the ocular device after 24 h of immersion in the release medium free of medicine.
Direct comparison between predictions from one-dimensional and two-dimensional diffusion problem used to describe the mass transfer process inside the ocular device is not easy through the drug concentration profiles obtained. In the next section, the gain in accuracy by the complexity introduced considering a two-dimensional diffusional problem will be discussed comparing predictions with data from the drug kinetics experiment performed.
a)
CA
(mg
/m
L
)
C
A
(mg
/m
L
)
x
(mm)
z (mm)
b)
z (mm)
a)
x (mm)
z
(mm)
z
(mm)
z
(mm)
z
(mm)
z
(mm)
z
(mm)
x (mm)
CA
(mg
/m
L
)
Fig. 5 Drug concentration inside the ocular device for different instants obtained with the one-dimensional mathematical approach: a) during the first 45 min of delivery and b) for greater periods (1 h, 3 h, 6 h, 12 h, 24 h and 48 h).
6. EXPERIMENTAL CONFIRMATION
To evaluate the effectiveness of a therapeutic device is determinant to characterize the kinetic of drug release. The in vitro studies presented in the literature quantify the accumulated mass of drug released to a release medium over the time.
A reliable analytical technique was developed to quantify the drug delivered by a therapeutic ophthalmic device (soft lenses) in order to validate the mass transfer models proposed.
The matrix of the lenses was prepared based in methacrylate monomers by thermal copolymerization using ethylene glycol dimethacrylate as crosslinking. Hydroxyethyl methacrylate (HEMA) was used as main component in the mixture with 3% (w/w) of methacrylic acid (MAA) monomer. The drug (timolol maleate) was incorporated in the polymeric matrices by adding it to the polymerization mixture (0.4%, w/w), remaining entrapped in the matrix when crosslinking occurs.
The membrane (0.5 mm thickness) with the composition prepared presents biocompatibility, mechanical properties (stiffness and flexibility), swelling behavior and refractive index adequate (Chauhan (2015), Tashakori-Sabzevar and Mohajeri (2015), García et al. (2004)) to be used for ophthalmologic purposes. Timolol is a medicine approved by FDA (Food and Drug Administration) and is used to treat glaucoma disease that causes high intraocular pressures with potential damage of vision.
The membrane prepared with the timolol maleate incorporated was carefully cut in small (thin) discs with dimensions similar to contact lenses (17 mm diameter). In order to simulate the eye environment, a solution similar to physiological serum, an aqueous solution with 9 g/L of NaCl, was used as released medium.
To start an experiment, one small disc with the medicine incorporated was immersed in the release medium (50.00 mL) contained in a glass flask and immediately a continuous flowrate was initiated and maintained in closed circuit by means of a peristaltic pump. Care was taken to have a temperature in the release medium nearly constant (36 ºC) during the experiment in a value close to the normal human body, forcing the circulation of water from a thermostatic bath through a plastic tube surrounding the glass flask. The agitation of the release medium by a magnetic stirrer was promoted in order to obtain a homogeneous solution. During its circuit the release medium circulated through a flux cuvette inside a spectrophotometer where the absorbance was measured, each 300 s, at a wavelength of 292 nm (timolol maleate maximum absorbance wavelength). The absorbance data was acquired during 48 h using the HiperTerminal emulator for the connection to a computer. Previously, a calibration curve for timolol maleate was obtained for the wavelength of maximum absorbance of 292 nm with a linear relation between absorbance and drug concentration in the range of 0 to 0.042 mg/mL.
A detailed description of materials and conditions used in the polymeric membrane and sample preparation, as well as of the kinetic experiments of timolol maleate release, is presented in Silva and Coelho Pinheiro (2013).
The methodology described allows to monitors continuously the medium where medicine was being released while maintaining the total volume of solution constant and it was possible obtain temporal drug concentration data with high accuracy and quality.
It should be emphasized that a similar experiment with a blank lens (without timolol maleate incorporated) was also performed to quantify any possible substances extracted from the hydrogel (unreacted monomers, initiator or cross-linker) that could interfere in the absorbance at 292 nm. Then, the profile obtained was used to correct the data acquired in the experiment conducted with the lens with timolol maleate.
The release profile of the timolol maleate from the copolymer disc of HEMA/MAA obtained in the experiment is presented in Fig. 6, where the evolution of the total amount of drug released (Mi – M (t)) with time is shown. In order to compare the data with predictions presented in sections 5.1 and 5.2 obtained from the two-dimensional and one-dimensional mathematical approach, the integration of Eqs. (12) and (17) was performed numerically. The evolutions of Mi – M (t) with time predicted from the two approaches are represented in Fig. 6 alongside the data to facilitate the comparison.
In all cases shown in Fig. 6, after the initial burst of timolol maleate release observed in the first 5-6 h of the dissolution process, the increase of the amount of drug released starts slowing down and for a time greater than 12 h the amount of drug in the release medium remains almost constant. However, the predictions overpredicted the amount of drug effectively released. In fact, the percentage of the initial amount of timolol maleate loaded into the lens released during the experiment was about 85% and predictions indicated that the ocular device was completely depleted of drug. This is the consequence of considering a zero-sink boundary in the mathematical approaches with predictions obtained with the highest possible drug concentration gradient at lens’ surface promoting mass transfer towards the release medium during whole dissolution process.
A clear conclusion from Fig. 6 can be drawn: the complexity introduced in the mathematical approach considering a two-dimensional transient mass transfer problem did not result in better modeling predictions. This is expected, because as discussed before the diameter of the ocular device is much larger than its thickness. For that reason mass transfer in the axial direction prevails in the process and the contribution of drug diffusion trough radial direction is negligible.
b)
t
z (mm) CA
(mg
/mL
)
t
z (mm)
CA
(mg
/mL
6
Fig. 6 Timolol maleate release profiles obtained from the dissolution experiment (data) and predicted using the two-dimensional (2-D) and one-dimensional (1-D) mathematical approach.
In this case, the effort must be made introducing a more realistic boundary condition instead of the simplistic zero-sink boundary. When a Robin boundary condition was used with the drug concentration in the release medium as a time dependent parameter calculated from the cumulative amount of drug dissolved, the predictions fitted the data well as reported by Pascoal et al. (2015), when an adequate timolol maleate equilibrium partition coefficient between polymeric device and release medium was used.
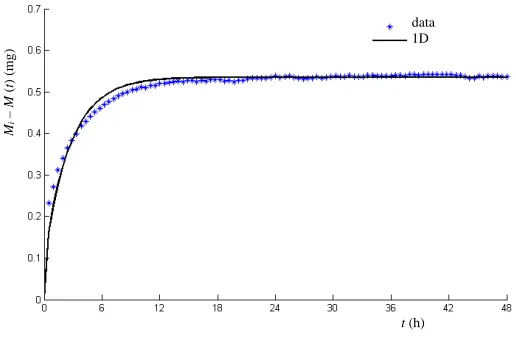
Timolol maleate was incorporated in the HEMA/MAA hydrogel by in-situ loading and the crosslinked network was formed with the drug present in solution. Reversible drug-hydrogel interactions are formed but also stronger non-covalent bindings could be built, causing incomplete release of the amount of drug initially loaded. Alvarez-Lorenzo et al. (2002) refer the possibility to establish hydrogen bonds between MAA non-ionized carboxyl groups and hydroxyl and/or amino groups of timolol. Easily this possibility can be introduced in the one-dimensional mathematical approach developed replacing the initial condition in Eq. (14). Assuming that 15% of the timolol maleate initially incorporated inside the lens still retained into the hydrogel network after dissolution, new prediction for drug release profile using CAi = 0.85 × 5.65 mg/mL was obtained and is represented alongside with the data in Fig. 7. It is observed a good agreement between data and numerical results and, in this case, the maximum value of the mass of drug released is quite similar in both curves in the figure.
Although the timolol percentage strongly binding in the polymeric matrix used in the new prediction was arbitrary, the exercise performed shows as exploring alternatives is very simple and easy after to have a numerical approach implemented. Moreover, is possible to conclude that the mathematical approach developed, qualitatively, is a good representation of the real-problem considered, as the timolol release profiles obtained in the experiment and predicted have similar behaviors. This indicates that the main phenomena involved in the drug release were taken in account in the models developed.
7. CONCLUSIONS
Simple models to describe the unsteady state diffusion of an active principle through a polymeric matrix constituting an ocular device were implemented and numerical solutions were obtained. Simultaneously an experimental study was developed to evaluate the delivery kinetics of a medicine used in the glaucoma treatment (the timolol maleate) from lens prepared in the laboratory with a methacrylate based hydrogel (poly(hydroxyethyl methacrylate) as main polymer with a small amount
Fig. 7Timolol maleate release profiles obtained from the dissolution experiment (data) and predicted using the one-dimensional (1D) mathematical approach assuming that 15% of the initial drug loaded to the lens remains bonded to the hydrogel network.
of methacrylic acid). The data from the experiment was compared with predictions obtained using a two-dimensional and one-dimensional approach to the diffusional process in the ocular device. No significant differences were observed between predictions from the two models and the complexity introduced with the two-dimensional approach does not have return in better modeling drug kinetics. With the simplistic zero-sink boundary used in both models the ocular device was exhausted of drug in 24 h. However, only about 85% of the initial amount of timolol maleate loaded into the lens was released during the experiment. This indicate that a more realistic boundary condition must be introduced in the model in order to try to have better predictions. Alternatively, this may suggest that some of the timolol maleate initially incorporated inside the lens binds strongly to the hydrogel network and stays retained after dissolution, as shown changing the initial condition used to obtain predictions.
NOMENCLATURE
CA drug concentration in the solid matrix
CAi homogeneous drug concentration initially distributed in the polymeric matrix
CAs drug concentration in the polymeric matrix on its surface exposed to the release medium
D drug diffusion coefficient
lens thicknessM (t) amount of drug inside the ocular device at the instant of time t
Mi amount of drug loaded into the ocular
r, θ, z cylindrical coordinates
R lens radius
t time
t* time adimensionalized by the total time of dissolution (48 h)
x, z Cartesian coordinates
Greek Symbols
∆t time step
∆t* time adimensionalized step
∆x, ∆z space steps
Mi
–
M
(
t
) (m
g
)
data 2D 1D
t (h)
M
i
–
M
(
t
) (m
g
)
data 1D
REFERENCES
Alvarez-Lorenzo, C., Hiratani, H., Gómez-Amoza, J.L., Martínez-Pacheco, R., Souto, C. and Concheiro, A., 2002, “Soft Contact Lenses Capable of Sustained Delivery of Timolol,” J. Pharmaceutical Sci.,
91(10), 2182−2192.
http://dx.doi.org/10.1002/jps.10209
Chauhan, A., 2015, “Ocular Drug Delivery Role of Contact Lenses,”
Delhi J. Ophthalmology, 26(2), 131–135. http://dx.doi.org/10.7869/djo.154
Ciolino, J.B., Ross, A.E., Tulsan, R., Watts, A.C, Wang, R.-F., Zurakowski, D., Serle, J.B. and Kohane, D.S., 2016, “Latanoprost-Eluting Contact Lenses in Glaucomatous Monkeys,” Ophthalmology,
123(10), 2085–2092.
http://dx.doi.org/10.1016/j.ophtha.2016.06.038
Ferreira, J.A., da Silva, P.M., Carreira, A., Gil, H. and Murta, J.N., 2010, “Sustained Drug Release from Contact Lenses,” Computer Modelling in Engineering and Science, 60,151-180.
http://dx.doi.org/10.3970/cmes.2010.060.151
García, D.M., Escobar, J.L., Noa, Y., Bada, N., Hernáez, E. and Katime, I., 2004, “Timolol Maleate Release from pH-Sensible poly(2-Hydroyethyl Methacrylate-co-Methacrylic Acid) Hydrogels,” Eur Polymer J., 40, 1683−1690.
http://dx.doi.org/10.1016/j.eurpolymj.2004.03.012
Jung, H.J., Abou-Jaoude, M., Carbia, B.E., Plummer, C. and Chauhan, A., 2013, “Glaucoma Therapy by Extended Release of Timolol from Nanoparticle Loaded Silicone-Hydrogel Contact Lenses,” J. Control Release, 165(1), 82−89.
http://dx.doi.org/10.1016/j.jconrel.2012.10.010
Lee, P.I., 2011, “Modeling of Drug Release from Matrix Systems Involving Moving Boundaries: Approximate Analytical Solutions,” Int. J. Pharmaceutics, 418, 18–27.
http://dx.doi.org/10.1016/j.ijpharm.2011.01.019
Pascoal, A.D.S.M.R., da Silva, P.M. and Coelho Pinheiro, M.N., 2015, “Drug Dissolution Profiles from Polymeric Matrices: Data versus Numerical Solution of the Diffusion Problem and Kinetic Models,” Int. Com. Heat Mass Transfer, 61, 118–127.
http://dx.doi.org/10.1016/j.icheatmasstransfer.2014.12.011
Silva, A.S.G. and Coelho Pinheiro, M.N., 2013, “Diffusion Coefficients of Timolol Maleate in Polymeric Membranes Based on Methacrylate Hydrogels,” J. Chem. Eng. Data, 58 (8), 2280–2289.
http://dx.doi.org/10.1021/je400377m
Singh, V., Bushetti, S.S., Raju, S.A., Ahmad, R., Singh, M. and Ajmal, M., 2011, “Polymeric Ocular Hydrogels and Ophthalmic Inserts for Controlled Release of Timolol Maleate,” J. Pharmacy Bioallied Sci.,
3(2), 280−295.
http://dx.doi.org/10.4103/0975-7406.80773
Tashakori-Sabzevar, F. and Mohajeri, S.A., 2015, “Development of Ocular Drug Delivery Systems Using Molecularly Imprinted Soft Contact Lenses,” Drug Develop. Ind. Pharmacy, 41(5),703−13.
http://dx.doi.org/10.3109/03639045.2014.948451
Wang, Y., Abrahamsson, B., Lindfors, L. and Brasseur, J.G., 2012, “Comparison and Analysis of Theoretical Models for Diffusion-Controlled Dissolution,” Molecular Pharmaceutics, 9, 1052−1066.
http://dx.doi.org/10.1021/mp2002818
Yuan, X., Marcano, D.C., Shin, C.S., Hua, X., Isenhart, L.C., Pflugfelder, S.C. and Acharya, G., 2015, “Ocular Drug Delivery Nanowafer with Enhanced Therapeutic Efficacy,” ACS Nano, 9(2), 1749–1758.