International Journal of Computer Techniques – Volume 4 Issue 6, November - December 2017
ISSN :2394-2231 http://www.ijctjournal.org Page 30
A Survey on Techniques and Applications of Data mining in
Banking Field
Md. Shakeel Ahamad
1, Sk. Wasim Akram
2 1,2(Associate Professor, Department of Computer Science and Engineering, VVIT, Guntur)
---
************************
---Abstract:
In these days’s generation, data mining is turning into strategically crucial place for lots enterprise organizations inclusive of banking area. It is a process of analysing the records from various views and summarizing it into precious records. Data mining assists the banks to look for hidden pattern in a set and find out unknown relationship within the records. These days, clients have such a lot of opinions in regards to where they could choose to do their enterprise. Early records evaluation strategies had been orientated in the direction of extracting quantitative and statistical information characteristics. These strategies facilitate useful records interpretations for the banking field to avoid customer attrition. Customer retention is the most important thing to be analysed in today’s competitive business surroundings. And additionally fraud is a great hassle in banking field. Detecting and stopping fraud is difficult, because fraudsters broaden new schemes all the time, and the schemes develop an increasing number of sophisticated to elude clean detection. This paper analyses the data mining techniques and its applications in banking field like fraud prevention and detection, patron retention, advertising and danger management.
Keywords —Data mining, Banking Field, Customer Retention, Credit Approval, Fraud Detection ---
************************
---I. INTRODUCTION
Technological innovations have enabled thebanking industry to open up efficient delivery channels. IT has helped the banking industry to deal with the challenges the new economy poses. Nowadays, Banks have realized that customer relationships are a very important factor for their success. Customer relationship management (CRM) is a strategy that can help them to build long-lasting relationships with their customers and increase their revenues and profits. CRM in the banking field is of greater importance. The CRM focus is shifting from customer acquisition to customer retention and ensuring the appropriate amounts of time, money and managerial resources are directed at
both of these key tasks. The challenge the bank face is how to retain the most profitable customers and how to do that at the lowest cost.At the same time, they need to find and implement this solution quickly and the solution to be flexible. Traditional methods of data analysis have long been used to detect fraud. They require complex and time-consuming investigations that deal with different domains of knowledge like financial, economics, business practices and law. Fraud instances can be similar in content and appearance but usually are not identical. In developing countries likeIndia, Bankers face more problems with the fraudsters. Using data mining technique, it is simple to build a successful predictive model and visualize the report into meaningful
ISSN :2394-2231 information to the user. The following figure 1 illustrates the flow of data mining technique in our systemmodel.
Fig.1: The
Data mining tools, using large databases, can facilitate
1. Automatic prediction of future trends and behaviorsand 2. Automated discovery of previously unknown patterns
II.DATA MINING TECHNIQUES AND
Data Mining Algorithms specify a variety of problems that can be modified and solved. Data Mining Functions fall generally into two categories:
1. Supervised Learning 2. Unsupervised Learning
Concepts of supervised and unsupervised learning are derived from the science of machine learning, which has been called a sub
2231 http://www.ijctjournal.org ser. The following figure 1
illustrates the flow of data mining technique in
: The flow of data mining technique in systemmodel.
Data mining tools, using large databases, can facilitate Automatic prediction of future trends and behaviorsand Automated discovery of previously unknown patterns
AND ALGORITHMS specify a variety of
problems that can be modified and solved. Data Mining Functions fall generally into two
Concepts of supervised and unsupervised learning are derived from the science of machine ning, which has been called a sub-area of
artificial intelligence. Artificial intelligence means the implementation and study of systems that exhibit autonomous intelligence or behavior of their own. Machine learning deals with techniques that enable devices to learn from their own performance and modify their own functioning. Data mining applies machine learning concepts todata[1].
A. Supervised Learning
International Journal of Computer Techniques – Volume 4 Issue 6, November - December 2017
ISSN :2394-2231 http://www.ijctjournal.org Page 32 Supervised learning is also known as directed
learning. The learning process is directed by a previously known dependent attribute or target. Directed data mining attempts to explain the behavior of the target as a function of a set of independent attributes or predictors. Supervised learning generally results in predictive models. This is in contrast to unsupervised learning where the goal is pattern detection.
The building of a supervised model involves
training, a process whereby the software analyzes many cases where the target value is already known. In the training process, the model "learns" the logic for making the prediction. For example, a model that seeks to identify the customers who are likely to respond to a promotion must be trained by analyzing the characteristics of many customers who are known to have responded or not responded to a promotion in the past.
Table I
DATA MINING ALGORITHMS FOR SUPERVISED FUNCTIONS
Algorithm Function Description
Decision Tree Classification Decision trees extract predictive information in the form of human- understandable rules. The rules are if-then-else expressions; they explain the decisions that lead to the prediction.
Generalized Linear Models (GLM)
Classification and Regression
GLM implements logistic regression for classification of binary targets and linear regression for continuous targets. GLM classification supports confidence bounds for prediction probabilities. GLM regression supports confidence bounds for predictions.
Minimum Description Length (MDL)
Attribute Importance MDL is an information theoretic model selection principle. MDL assumes that the simplest, most compact representation of data is the best and most probable explanation of the data.
Naive Bayes (NB) Classification Naive Bayes makes predictions using Bayes' Theorem, which derives the probability of a prediction from the underlying evidence, as observed in thedata.
Support Vector Machine (SVM)
Classification and Regression
Distinct versions of SVM use different kernel functions to handle different types of data sets. Linear and Gaussian (nonlinear) kernels are supported.
SVM classification attempts to separate the target classes with the widest possible margin.
ISSN :2394-2231 http://www.ijctjournal.org Page 33
A.Unsupervised Learning
Unsupervised learning is non-directed. There is no distinction between dependent and independent attributes. There is no previously-known result to guide the algorithm in building the model. Unsupervised learning can be used for descriptive purposes. It can also be used to make predictions.
Table II
DATA MINING ALGORITHMS FOR UNSUPERVISED FUNCTIONS
Algorithm Function Description
Apriori Association Apriori performs market basket analysis by discovering co-occurring items (frequent itemsets) within a set. Apriori finds rules with support greater than a specified minimum support and confidence greater than a specified minimum confidence. For example Find the items that tend to be purchased together and specify their relationship
k-Means Clustering k-Means is a distance-based clustering algorithm that partitions the data into a predetermined number of clusters. Each cluster has a centroid (center of gravity). Cases (individuals within the population) that are in a cluster are close to the centroid. For example, segment demographic data into clusters and rank the probability that an individual will belong to a given cluster
Non-Negative Matrix Factorization (NMF)
Feature Extraction
NMF generates new attributes using linear combinations of the original attributes. The coefficients of the linear combinations are non-negative. During model apply, an NMF model maps the original data into the new set of attributes discovered by the model. For example, given demographic data about a set of customers, group the attributes into general characteristics of thecustomers
One Class
SupportVector Machine
Anomaly Detection
One-class SVM builds a profile of one class and when applied, flags cases that are somehow different from that profile. This allows for the detection of rare cases that are not necessarily related to each other. For example, given demographic data about a set of customers, identify customer transaction behavior that is significantly different from thenormal.
III. TOP10FRAUDSININDIAN BANKING FIELD :
The Reserve Bank of India maintains data on frauds on the basis of area of operation under which the frauds have been perpetrated. According to such data pertaining, top 10 categories under
which frauds have been reported by banks are as follows:
A. CreditCards
B. Deposits – Savings A/C C. InternetBanking
International Journal of Computer Techniques – Volume 4 Issue 6, November - December 2017
ISSN :2394-2231 http://www.ijctjournal.org Page 34 F. Cheque / DemandDrafts
G. CashTransactions
H. Cash Credit A/c(Types of OverdraftA/C] I. Advances
J. ATM / DebitCards
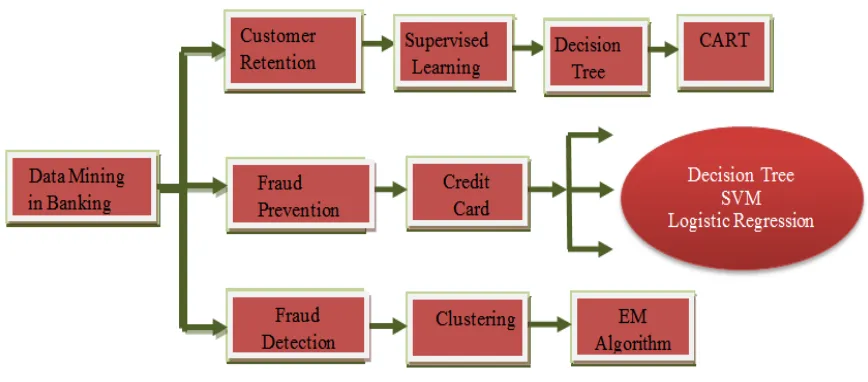
IV. DATAMININGAPPLICATIONSINBANKINGFIELD: Customer retention pays vital role in the banking field. The supervised learning method Decision Tree implemented using CART algorithm is used for customer retention.
Preventing fraud is better than detecting the fraudulent transaction after its occurrence. Hence for credit card approval process the data mining techniques Decision Tree, Support Vector Machine (SVM) and Logistic Regression are used. Clustering model implemented using EM algorithm can be used to detect fraud in banking field [2].
Fig. 2: Data Mining Techniquesand Algorithms those are applicable to the banking field.
A. Customer Retention in Banking Field
Today, customers have so many opinions with regard to where they can choose to do their business. Executives in the banking industry, therefore, must be aware that if they are not giving each customer their full attention, the customer can simply find another bank that will. Early data analysis techniques were oriented toward extracting quantitative and statistical data characteristics.
These techniques facilitate useful data interpretations and can help to get better insights into the processes behind the data.
Although the traditional data analysis techniques can indirectly lead us to knowledge, it is still created by human analysts. This is a natural source of ideas, since the machine learning task can be described as turning background knowledge and examples (input) into knowledge(output).
ISSN :2394-2231 http://www.ijctjournal.org Page 35 problem today. Losing the customers can be
very expensive as it costs to acquire a new customer. Predictive data mining techniques are useful to convert the meaningful data into knowledge. In this section, we discuss the predictive data mining techniques for the churn problem in bankingfield [3].
To improve customer retention, three steps are needed:
i) Measurement of customer retention; ii) Identification of root causes of defection
and related key service issues; and the iii) Development of corrective action to
improve retention. Measurement of existing customer retention rates is the first significant step in the task of improving loyalty. This involves measuring retention rates and profitability analysis by segment.
1) Classification Methods:In this approach, risk
levels are organized into two categories based on past default history. For example, customers with past default history can be classified into "risky" group, whereas the rest are placed as "safe" group. Using this categorization information as target of prediction, Decision Tree and Rule Induction techniques can be used to build models that can predict default risk levels of new loanapplications.
Decision Tree
Decision trees are the most popular predictive models, where a decision tree is a tree- like graph representing the relationships between a set of variables.Decision tree models are used to solve classification and prediction problems where instances are classified into one of two classes, typically positive and negative, or churner and non-churner in the churn classification case. These models are represented and evaluated in a top-down manner. Developing decision trees involves two
phases: Tree building and tree pruning.
Tree building starts from the root node that represents a feature of the cases that need to be classified. Feature selection is based on evaluation of the information gain ratio of every feature. Following the same process of information gain evaluation, the lower level nodes are constructed by mimicking the divide and conquer strategy. Building a decision tree incorporates three key elements:
1-Identifying roles at the node for splitting data according to its value on one variable orfeature. 2-Identifying a stopping rule for deciding when a sub-tree iscreated.
3-Identifying a class outcome for each terminal leaf node, for example, ‗Churn‘or‗Non-churn‘.
Decision trees usually become very large if not pruned to find the best tree. The pruning process is utilized not only to produce a smaller tree but also to guarantee a better generalization. This process involves identifying and removing the branches that contain the largest estimated error rate and can be regarded as an experimentation process. The purpose of this process is to improve predictive accuracy and to reduce the decision tree complexity (Au, Chan and Yao,2003).
Once the model is built, the decision about a given case regarding to which of the two classes it belongs is established by moving from the root node down to all the leaves and interior nodes. The movement path is determined by the similarity calculation until a leaf node is reached, at which point a classification decision ismade.
2)Value Prediction Methods: In this method, for
International Journal of Computer Techniques – Volume 4 Issue 6, November - December 2017
ISSN :2394-2231 http://www.ijctjournal.org Page 36 • Clustering(descriptive)
• Classification (predictive)
andregression(predictive)
• Association rule discovery (descriptive) andsequential pattern discovery(predictive)
B.Automatic Credit Approval using ClassificationMethod Fraud is a significant problem in banking field. Detecting and preventing fraud is difficult, because fraudsters develop new schemes all the time, and the schemes grow more and more sophisticated to elude easy detection. Bank Fraud is a federal crime in many countries, defined as planning to obtain property or money from any federally insured financial institution. It is sometimes considered a white collar crime.
All the major operational areas in banking represent a good opportunity for fraudsters with growing incidence being reported under deposit, loan and inter-branch accounting transactions, including remittances. In developing countries like India, Bankers face more problems with the fraudsters. There is lack of technique to detect the banking fraud.
Automatic credit approval is the most significant process in the banking field and financial institutions. Fraud can be prevented by making a good decision for the credit approval using the classification models based on decision trees (C5.0 & CART), Support Vector Machine (SVM) and Logistic Regression Techniques. It prevents the fraud which is going tohappen.
1) Classification Methods:Classification is perhaps
the most familiar and most popular data mining technique. Estimation and prediction may be viewed as types of classification. There are more classification methods such as statistical based, distance based, decision tree based, neural network based, rulebased[4].
C5.0
C5.0 builds decision trees from a set of training data in the same way as ID3, using the concept of Information entropy. The training data is a set S=S1,S2,.. of already classified samples.
Each sample Si consists of a p- dimensional
vector (x1,i,x2,i, …, xp,i), where the xj represent
attributes or features of the sample, as well as the class in which si falls. At each node of the tree,
C5.0 chooses the attribute of the data that most effectively splits its set of samples into subsets enriched in one class or the other. The splitting criterion is the normalized information gain(difference in entropy). The attribute with the highest normalized information gain is chosen to make the decision. The C5.0 algorithm then recurses on the smaller sublists. Gain is computed to estimate the gain produced by a split over an attribute. The gain of information is used to create small decision trees that can identify the answers with a fewquestions [5].
CART
A CART tree is a binary decision tree that is constructed by splitting a node into two child nodes repeatedly, beginning with the root node that contains the whole learning sample. Used by the CART (classification and regression tree) algorithm, Gini impurity is a measure of how often a randomly chosen element from the set would be incorrectly labeled if it were randomly labeled according to the distribution of labels in the subset. Gini impurity can be computed by summing the probability of each item being chosen times the probability of a mistake in categorizing that item. It reaches its minimum (zero) when all cases in the node fall into asingle targetcategory.
Support Vector Machine (SVM)
ISSN :2394-2231 models, that represents the similarity of vectors (training samples) in a feature space over polynomials of the original variables. For degree-d polynomials, the polynomial kernel is defined as
K(x,y)= (xTy+c)d
Where x and y are vectors in the input space, i.e. vectors of features computed from training or test samples, c >0 is a constant trading off the influence of higher-order versus lower terms in thepolynomial.
Logistic Regression
Logistic regression or logit regression is a type of regression analysis used for predicting the outcome of a categorical dependent variable based on one or more predictor variables. Instead of fitting the data to a straight line, logistic regression uses a logistic curve. The formula for a univariate logistic curve is
To perform the logarithmic function can be applied to obtain the logistic function
+
Logistic regression is simple, easy to implement, and provide good performance on a wide variety of problems [6].
C.Fraud Detection in BankingField
Sometimes the given demographics and transaction history of the customers are likely to defraud the bank. Data mining technique helps to analyze such patterns and transactions that lead to fraud. Banking field gives more effort for Fraud Detection. Fraud management is a knowledge-intensive activity. It is so important in fraud detection is that finding which ones of the transactions are not ones that the user would bedoing. So the mining system checks which
2231 http://www.ijctjournal.org dels, that represents the similarity of vectors
(training samples) in a feature space over polynomials of the original variables. For polynomials, the polynomial kernel is
Where x and y are vectors in the input space, .e. vectors of features computed from training or test samples, c >0 is a constant trading off the order versus lower-order
Logistic regression or logit regression is a ysis used for predicting the outcome of a categorical dependent variable based on one or more predictor variables. Instead of fitting the data to a straight line, logistic regression uses a logistic curve. The formula for a univariate logistic curve is
To perform the logarithmic function can be applied to obtain the logistic function
+
Logistic regression is simple, easy to implement, and provide good performance on a
Sometimes the given demographics and transaction history of the customers are likely to defraud the bank. Data mining technique helps to analyze such patterns and transactions that lead to fraud. Banking field gives more effort anagement is a intensive activity. It is so important in fraud detection is that finding which ones of the transactions are not ones that the user would bedoing. So the mining system checks which
ones of the transactions do not fit into a specifi category or are not standard repeat transactions.
It is required to decide which of the user's actionscorrespond to his natural behavior and which areexceptional, without any assistance. With the help ofunique algorithms, it is able to detect suspicious activitywithin the data in a non prescriptive way. While the systemobserves the user's transactions, it discovers commonbehavior patterns by grouping similar transactions together.In order to discover anomalous transactions, newtransactions are compared wi the user's common behaviorpatterns. A transaction that does not correspond with one ofthese patterns will be treated as a suspicious activity and trigger precautionary steps accordingly.
An important early step in fraud detection is to identify factors that can lead to fraud. What specific phenomena typically occur before, during, or after a fraudulent incident? What other characteristics are generally
When these phenomena and characteristics are pinpointed, predicting and detecting frau becomes a much more manageable task. Because of the nature of the data, traditional machine learning techniques are not suitable. Traditional techniques may detect fraudulent actions similar to ones already recognized as fraud, but they will rarely detect fraudulent activities that were not learned beforehand. The clustering model and the probability density estimation methods, described in the following sections, can be well utilized for detecting fraud in the banking field.
1) The Clustering model:Clusteri
grouping the data into similar clusters that helps in uncomplicated retrieval of data. Cluster analysis is a technique for breaking data down into related components in such a way that patterns and order becomes visible. This model is based on the use of the parameters’ data
Page 37 ones of the transactions do not fit into a specific category or are not standard repeat transactions.
It is required to decide which of the user's actionscorrespond to his natural behavior and which areexceptional, without any assistance. With the help ofunique algorithms, it is able to activitywithin the data in a non-prescriptive way. While the systemobserves the user's transactions, it discovers commonbehavior patterns by grouping similar transactions together.In order to discover anomalous transactions, newtransactions are compared with the user's common behaviorpatterns. A transaction that does not correspond with one ofthese patterns will be treated as a suspicious activity and trigger precautionary steps
An important early step in fraud detection is that can lead to fraud. What specific phenomena typically occur before, during, or after a fraudulent incident? What other characteristics are generally seen with fraud? When these phenomena and characteristics are pinpointed, predicting and detecting fraud becomes a much more manageable task. Because of the nature of the data, traditional machine-learning techniques are not suitable. Traditional techniques may detect fraudulent actions similar to ones already recognized as fraud, but they will t fraudulent activities that were not learned beforehand. The clustering model and the probability density estimation methods, described in the following sections, can be well utilized for detecting fraud in the banking field.
International Journal of Computer Techniques
ISSN :2394-2231 clusterization regions.
In order to determine these regions of clusterization first its need to find the maximum difference (DIFFmax) between values of an
attribute in the training data. This difference (DIFFmax) is split into Ninterval segments. N
the binary logarithm of the attribute values account Npoints. In general, Ninterval can be found
using another way of looking. Such calculation of
Ninterval is based on the assumption that a twofold
increase of Npoints will be equaltoNinterval
For each found segment the calculation of the average value and the corresponding deviation for hit attribute values is made.
Thus Ninterval centers and corresponding
deviations that describe all values of the certain attribute from the training data appears.
The final result of classification of the whole transaction is the linear combination of classification results for each parameter:
Result =w1 x Class1+ w2 x Class2
Class n
2)Probability density estimation method:
To model the probability density function, Gaussian mixture model is used, which is a sum of weighted component densities of Gaussianform.
The p(x│j) is the jth component density of Gaussian form and the P(j) is its mixing proportion. The parameters of the Gaussian mixture model can be estimated using the EM algorithm (Computes maximum
estimates of parameters). This method specialize the general model by re
the mixing proportions for each user dynamically after each sampling period as new
International Journal of Computer Techniques – Volume 4 Issue 6, November - December
2231 http://www.ijctjournal.org In order to determine these regions of
clusterization first its need to find the maximum ) between values of an attribute in the training data. This difference segments. Ninterval is
the binary logarithm of the attribute values can be found using another way of looking. Such calculation of is based on the assumption that a twofold
interval plus one.
For each found segment the calculation of the average value and the corresponding deviation
centers and corresponding deviations that describe all values of the certain attribute from the training data appears.
The final result of classification of the whole transaction is the linear combination of classification results for each parameter:
2 +... + wn x
estimation method:
To model the probability density function, Gaussian mixture model is used, which is a sum of weighted component densities of
component density of Gaussian form and the P(j) is its mixing
. The parameters of the Gaussian mixture model can be estimated using the EM algorithm (Computes maximum-likelihood estimates of parameters). This method specialize the general model by re-estimating the mixing proportions for each user ach sampling period as new
data becomes available. Whereas the means and the variances of the user specific models are common, only the mixing proportions are different between the users’ models. In order to estimate the density of past behavior, it is necessary to retrieve the data from the last k days and adapt the mixing proportions to maximize the likelihood of past behavior. But this approach requires too much interaction with the billing system to be used in practice. To avoid this burdensome processi
method formulates the partial estimation procedure using on-line estimation. The on version of the EM algorithm was first introduced by Nowlan.
P(j)new = α P(j)old
Remembering that the new maximum likelihood estimate for P(j) is computed as the expected value of P(j│x) over the whole data set with the current parameter fit, this model can easily formulate a recursive estimator for this expected value as can be seen i
3. The decay term α determines the efficient length of the exponentially decaying window in the past. The approach performs statistical modeling of past behavior and produces novelty measure of current usage as a negative log likelihood of current usage. The detection decision is then based on the output of this noveltyfilter.
D. Marketing
Bank analysts can also analyze the past trends, determine the present demand and forecast the customer behavior of various products and services in order to gra
opportunities and anticipate behavior patterns. Data mining technique also helps to identify profitable customers from non
ones. Another major area of development in banking is Cross selling i.e banks make an
December 2017
Page 38 data becomes available. Whereas the means and the variances of the user specific models are common, only the mixing proportions are different between the users’ models. In order to estimate the density of past behavior, it is essary to retrieve the data from the last k days and adapt the mixing proportions to maximize the likelihood of past behavior. But this approach requires too much interaction with the billing system to be used in practice. To avoid this burdensome processing of data, this method formulates the partial estimation line estimation. The on-line version of the EM algorithm was first
old
+ P(j│x)
Remembering that the new maximum likelihood estimate for P(j) is computed as the │x) over the whole data set with the current parameter fit, this model can easily formulate a recursive estimator for this expected value as can be seen in Equation α determines the efficient length of the exponentially decaying window in the past. The approach performs statistical modeling of past behavior and produces a measure of current usage as a negative rent usage. The detection decision is then based on the output of this
ISSN :2394-2231 http://www.ijctjournal.org Page 39 attractive offer to its customer by asking them to
buy additional product orservice.
E.RiskManagement
Data mining technique helps to distinguish borrowers who repay loans promptly from those who don't. It also helps to predict when the borrower is at default, whether providing loan to a particular customer will result in bad loans etc. Bank executives by using Data mining technique can also analyze the behavior and reliability of the customers while selling credit cards too. It also helps to analyze whether the customer will make prompt or delay payment if the credit cards are sold to them.
V.CONCLUSION
Data mining is a technique used to extract essential records from existing large quantity of records and permit higher choice-making for the banking and retail industries. They use data warehousing to mix diverse statistics from databases into an appropriate format in order that the information can be mined. The statistics is then analysed and the statistics that is captured is used all over the organization to support decision-making.. Data mining strategies are very useful to the banking discipline for better targeting and obtaining new customers, maximum valuable consumer retention, computerized credit score approval that is used for fraud prevention, fraud detection in real time, imparting section based merchandise, evaluation of the clients, transaction styles through the years for higher retention and relationship, chance control and advertising and marketing. Those banks that have realized the usefulness of data mining and are in the process of building a data mining environment for their decision-making process will obtain huge benefit and derive considerable competitive advantage in future.
REFERENCES
[1] HillolKargupta, Anupam Joshi, Krishnamoorthy Siva Kumar, Yelena Yesha, "Data Mining: Next Generation Challenges and Future Directions", Publishers: Prentice-Hall of India, Private Limited, 2005.
[2] Dr. A.Vasudevan, “Report of the Committee on Technology Up gradation in the Banking Sector”, Constituted by Reserve Bank of India, Chairman of Committee, 1999
[3] S.R. Mittal, Report of Committee on Internet Banking (2001), Constituted by Reserve bank of India, Chairman of the Committee
[4] Dr.MadanLalBhasin, “Data Mining:A Competitive Tool in the Banking and Retail Industries”, The Chartered Accountant October ,2006.
[5] RajanishDass, "Data Mining in Banking and Finance: A Note for Bankers", Indian Institute of Management Ahmadabad.
[6] K. Chitra, B.Subashini, Customer Retention in Banking Field using Predictive Data Mining Technique, International Conference on Information Technology, Alzaytoonah University, Amman, Jordan, www.zuj.edu.jo/conferences/icit11/paperlist/Papers/
[7] Petra Hunziker, Andreas Maier, Alex Nippe, Markus Tresch, Douglas Weers, and Peter Zemp, Data Mining at a major bank:
Lessons from a large marketing application
http://homepage.sunrise.ch/homepage/pzemp/info/pkdd98.pdf [8] Michal Meltzer, Using Data Mining on the road to be successful
part
IIIhttp://www.dmreview.com/editorial/newsletter_article.cfm?nl=bi report&articleId =1011392&issue=20082, October2004.