1
Independent Media and Elections
By Ruben Enikolopov, Michael Rochlitz, Koen Schoors and Nikita Zakharov1
December 2018
(Second preliminary draft: please do not cite or circulate without permission of the authors)
Abstract:
How does access to independent media affect voting behavior in an environment where media are largely captured by the state? To answer this question we conduct two parallel randomized controlled experiments during the September 2016 Russian parliamentary elections. In a first experiment, we randomly select 15 out of 42 otherwise comparable mid-size cities, treat these 15 cities with an advertising campaign for the independent Russian online TV channel TV Rain on social media, and complement this offer with temporary free access to TV Rain. In polling stations where United Russia (UR) collected a small share of the popular vote in 2011 our TV Rain treatment leads to lower turnout, as well as to a clear decrease in votes for UR and an increase in votes for the main liberal opposition party. These effects become smaller, however, in localities where UR collected relatively more votes in 2011 and are completely reversed where the support for UR was highest, clearly indicating that our treatment leads to polarization of the voters. In a second experiment we randomly treat subjects with free access to TV Rain during the first wave of an individual survey conducted 2 weeks before the elections. The second post-election wave of the individual survey reveals that our treatment leads to a polarization effect that is very comparable to what we found in the city level experiment, but only for subjects that use social networks as a source of information experience. For other subjects that do not rely on social networks for news, however, the individual TV Rain treatment reduces both turnout and votes for UR, suggesting that the polarization effect is much stronger for subjects that depend on social networks for their news
Key words: Media, Elections, Russia, Voter Turnout, Field Experiment
JEL codes: C93, D72, L82
1 Enikolopov: ICREA, IPEG, Universitat Pompeu Fabra, Barcelona GSE, Spain, and New Economic School, Moscow,
2
The strength of the Government lies in the people's ignorance.
Lev Tolstoi (Letter to Liberals, August 31, 1896)
1. Introduction
As a result of the potent impact of information and mass media on political opinions and behavior,
politicians and governments have strong incentives to try and influence, or even control the information
accessible to the public2. In fact, state control over information and the media is a daily reality in the
majority of countries and people in the world. According to the 2016 Freedom House report on the
freedom of the press, only 13% of the world’s population enjoy a free press, i.e. “a media environment
where coverage of political news is robust, the safety of journalists is guaranteed, state intrusion in media
affairs is minimal, and the press is not subject to onerous legal or economic pressures”3. 45% of the world’s
population, on the other hand, lives in countries where the media are characterized as “not free”.
An emerging theoretical literature argues that several contemporaneous authoritarian regimes base their
legitimacy mainly on the control and manipulation of information through captured media, instead of
relying on violence and repression (see e.g. Guriev and Treisman 2015; Rozenas and Stukal 2017; Treisman
et al. 2018; or Belmonte and Rochlitz 2017, 2018). While the empirical relation between information and
political behavior has been intensely studied for the small percentage of countries that enjoy a free press,
studies that examine the same question in environments where the media has been captured by the
government remain relatively few to date. Even fewer empirical studies look at the effect of independent
media on political outcomes in contexts where most media are captured by the government, even though
in such contexts independent information can arguably play a particularly important according to theory.
The literature distinguishes two broad categories of possible effects of access to independent media, the
persuasion effect and the polarization effect. While the relationship between information and politics is
complex and multidirectional, new experimental evidence suggests that a measurable and substantial
causal persuasion effect of specific information on political behavior does indeed exist. Accessible
2 Bennett P., Naim M. (2015), 21st century censorship: Governments around the world are using stealthy strategies to manipulate the media, Columbia Journalism Review
http://archives.cjr.org/cover_story/21st_century_censorship.php
3
information and media reports about politics can have a significant impact on public opinion, support for
particular politicians and election results (DellaVigna and Kaplan 2007; Gerber, Karlan and Bergan 2009;
Ladd and Lenz 2009; Enikolopov et al. 2011; Adena et al. 2015; Peisakhin and Rozenas 2018). They also play
an important role in holding politicians and state institutions accountable for their policies and actions
(Besley and Pratt 2006; Pande 2011; Pande et al. 2011; Figueiredo et al. 2012; Bruns and Himmler 2016).
In certain contexts, the availability of specific information can even have effects that go far beyond electoral
politics. In a study that uses the mountainous geography of Rwanda to identify the causal effect of radio
propaganda on interethnic violence, Yanagizawa-Drott (2014) shows how 10% of the violence perpetrated
during the Rwandan genocide can be attributed to propaganda by the radical radio station RTML. Using a
similar research design, DellaVigna et al. (2014) show how the availability of Serbian public radio causes
anti-Serbian ethnic animosity in those Croatian border towns that do receive the radio signal.
Another relatively new strand of the literature analyzes a causal polarization effect of specific information
on political behavior, suggesting that the effect of access to independent media is not as straightforward
as the persuasion effect may suggest. Campante and Hojman (2013) for example show how the
introduction of broadcast TV in the US led to lower political polarization. Levendusky (2013) on the other
hand show in a lab experiment how partisan media polarize the electorate by turning relatively extreme
citizens even more extreme. Bail et al. (2018) find that conservative Republicans receiving a twitter
news-feed with opposing political views become even more conservative, in this way demonstrating how
exposure to opposing views on social media may increase rather than decrease political polarization.
In this paper, we pose the question how access to independent media influences political opinions and
voting behavior in contexts where most of the media are captured by the state. Russia is a perfect testing
ground to find answers to this question because, although most media are captured by the state, Russia
still features a few independent voices that do not have to cater to the wishes of the Kremlin. Therefore,
we conduct two randomized controlled trials, a field experiment at the city level and an individual survey
experiment, where we randomly treat the treatment group with awareness of and free access to TV Rain,
one of the few remaining independent voices in the Russian media landscape.
For our field experiment we randomly select 15 out of 42 otherwise comparable mid-size cities and treat
these 15 cities with an advertising campaign for TV Rain on the Russian social network VKontakte. We
complement this banner campaign with temporary free access to TV Rain by introducing a free trial
4
these 15 cities, and from 5 additional random cities, receive this free trial subscription, while visitors from
the remaining 22 cities do not receive any such offer. This treatment is administered three weeks before
the elections. After the elections, we then compare the election results in the polling stations of treatment
cities with the results in polling stations of the control group.
We find that the combined treatment of free access and advertisement for TV Rain leads to a significant
increase in media consumption of TV-Rain in the treated cities and polling stations, indicating our
treatment was effective. Our TV Rain treatment leads to lower turnout in polling stations where United
Russia (UR) collected a small share of the popular vote in 2011, as well as to a decrease in votes for UR and
an increase in votes for the main liberal opposition party. These effects become smaller, however, in polling
stations where UR collected relatively more votes in 2011 and are completely reversed in the polling
stations with highest 2011 UR support, clearly indicating that our treatment leads to polarization of the
voters. The implied effect on UR votes at the district level ranges from 3.6 percentage points less UR votes
in polling stations with the lowest 2011 UR support to 13,2 percentage points more votes for UR in polling
stations with the highest 2011 UR support. These results are in line with a polarization effect of providing
access to independent media to partisan supporters of the regime, who are triggered into electoral action
upon receiving information that does not coincide with their prior beliefs.
Our complementary survey experiment consists of randomly distributing access to TV Rain at the individual
level with the help of a telephone survey. The telephone survey was carried out by the Levada Center, a well-respected independent Russian polling agency, and consisted of two waves before and after the
election. During the first wave we asked respondents about their voting intentions, and then distributed
codes for a 1-month subscription to TV-Rain to a randomly selected sub-group of respondents as a reward
for their participation. In the second wave, we asked all the respondents if they voted in the elections, and
if yes for which party they voted.
If we limit our sample to respondents who get their news from social networks, as is implicitly the case in
the field experiment, we find polarization results that are very comparable to the field experiment: after
treatment, respondents that most strongly approved the government prior to the treatment are 8
percentage points more likely to vote for United Russia, respondents who moderately approved the
government are only marginally less likely to vote for United Russia, and a priori strongly disapproving
respondents are substantially less likely to vote for United Russia, all else equal. Respondents that does
5
of the media. The treatment of these subjects has an unambiguously negative effect on voting for United
Russia in this subsample, irrespective of their prior support of the government.
Our paper contributes to the literature cited higher in a few important ways. We provide two randomized
controlled trials that determine the effect of access to new independent information on voting behavior,
while in most other papers the treatment with free media relies on idiosyncratic geographical features (see
e.g. Enikolopov et al. 2011; DellaVigna et al. 2014; Yanagizawa-Drott 2014 or Peisakhin and Rozenas 2018).
Moreover we are the first to provide this type of experimental assessment of the effect of access to
independent media on voting behavior in a captured media environment. In line with the polarization
literature we show that there exists a polarization effect of exposing partisan voters to information contrary
to their prior beliefs, even in environments with captured media. Finally we show that this polarization
only exists for consumers of news on social media, while our treatment with TV Rain had an unambiguously
negative effect on votes for UR on respondents with more traditional sources of news. In this way we shed
light on the potential channels of the polarization effect at large.
The paper is organized as follows. Section 2 briefly introduces the Russian context and role of the media
during the 2016 Duma elections. Section 3 describes the theory behind our study and derives the research
hypotheses. Section 4 introduces the research design of our two experiments. Sections 5 and 6 present the
data and results of the field and the survey experiments, and provide a discussion of the mechanisms
behind our results. Section 7 concludes.
2. The Role of the Media in Russian Politics
2.1 Media, Political Competition and the Russian State before 2012
Once Vladimir Putin was first elected as president of Russia in March 2000, he soon started to reign in on
media freedom. One after the other, formerly independent TV channels were brought under government
control (see e.g. Baker and Glasser, 2005). The move to control the media was driven by the regime’s
6
therefore Russia’s principal media outlets should be controlled by the state4. The regime’s experience with
the privately-owned TV channel NTV, that openly campaigned against the pro-Putin party “Unity” during
the campaign for the December 1999 Duma election, may well have contributed to the formation of this
particular point of view. As shown by Enikolopov et al. (2011), the vote share for “Unity” was on average
8.9% lower in those cities where NTV was available. When the channel continued to criticize Putin after his
March 2000 election victory, it was forcibly bought by the state-owned corporation Gazprom, and has
turned into a stable source of pro-government news ever since.
The crack-down on independent media was accompanied by increasingly stringent restrictions on political
competition. While the 1999 parliamentary elections were still genuinely competitive (until shortly before
the elections, it remained unclear who would win), the 2003 and 2007 parliamentary elections were
already much less so. Step-by-step, democratic institutions were abolished (e.g. the elections of regional
governors that were replaced by presidential appointments in 2005 by a change of the constitution) and
extra hurdles to genuine political competition were established. A sophisticated structure of regional
political machines was put in place, to ensure the political dominance of the ruling party United Russia in
regional and federal elections (Frye et al. 2014, 2018; Rochlitz 2016).
The regime’s preoccupation with political control rose to a new high when suspicions of massive electoral
fraud during the 2011 Duma elections led to a large wave of popular protests. For a few months during the
winter of 2011-2012 the street protests seemed to pose a serious threat to the regime5, with the
apprehension of Russia’s ruling elites amplified by the simultaneous unfolding of the Arab Spring
throughout the Middle East. This urged Vladimir Putin to increase government control over the media even
further after his election for a third term as president in May 2012.
2.2 Bent, but not broken: a short history of TV Rain
Shortly after Putin’s re-election, the level of pro-Kremlin propaganda was perceptibly scaled up on Russia’s
government-controlled TV channels (Pomerantsev 2015). Simultaneously, a number of new bills were
4 In an interview with the director of the radio station Echo Moscow, Vladimir Putin once famously remarked: “Contrary to a
common perception, mass media is an instrument, rather than an institution.” (as cited by Enikolopov et al., 2011, page 3253).
5 See for example The Economist, December 10th, 2011, “Russia’s Future: The Cracks Appear”,
7
introduced by United Russia and signed by Vladimir Putin, such as for example the law forcing NGOs that
receive funding from abroad to register as “foreign agents”.
Control over the media sphere also increased further. The editorial teams of a number of leading
investigative newspapers were forced to leave, such as the editors of Gazeta.ru in 2012, or Lenta.ru in
20146. In early 2014, a controversial survey about the siege of Leningrad was taken as a pretext to end the
distribution on cable TV of one of Russia’s last independent TV channels, TV Rain. Founded on April 27,
2010, TV Rain had played an important role during the liberal protests against election fraud that took
place after the 2011 parliamentary elections in Russia. By 2013, the channel had become relatively
influential, and reached a potential audience of about 10 million viewers7.
Within a couple of days in late January 2014, Russia’s major cable TV providers announced that they would
no longer carry the country’s last independent TV channel, TV Rain8. Later during the same year, the
Russian State Duma issued an advertising ban on Russian cable and satellite TV stations, widely believed
to be specifically designed to undercut the financial resources of TV Rain9. In October 2014, the channel
was forced to leave its studios in central Moscow on short notice, and had to continue its broadcasts from
a private apartment. As a result, the audience of TV Rain fell from several million in early 2014 to about
60.000 at the end of the year10, with the channel being only able to survive as a paid online channel from
2015 onwards.
Officially, the reason for the crackdown However, many observers argue that the real reason behind the
Kremlin’s decision to cut the channel off from much of its audience was the understanding that TV Rain
had become an obstacle in the Kremlin’s strategy to
Although the official reason for the crackdown on TV Rain was a controversial online survey on the siege
of Leningrad during World War II, conducted by the channel in early 201411, unofficially many observers
agree that the channel had become an obstacle in the Kremlin’s strategy to establish tighter control over
6 https://www.theguardian.com/world/2014/mar/12/editor-russian-news-site-replaced-lenta;
https://www.newyorker.com/news/news-desk/the-demise-of-rbc-and-investigative-reporting-in-russia
7 https://iz.ru/news/564921
8https://www.theguardian.com/cities/2015/jun/09/tv-rain-russia-only-independent-television-channel
9
https://www.washingtonpost.com/world/europe/russian-advertising-ban-on-paid-cable-and-satellite-channels-threatens-independents/2014/11/05/ebbf933e-6370-11e4-ab86-46000e1d0035_story.html?utm_term=.7a11989ab558
10https://www.theguardian.com/commentisfree/2014/jan/30/russia-independent-tv-channel-censorship-tv-rain-leningrad;
https://iz.ru/news/564921
11 The survey asked whether Leningrad should have been surrendered to the German invaders during the Second World War, to
8
the informational agenda in the country12. Russia is particular in the sense that even in late 2015, 85% of
the Russian population got their knowledge about Russia and the world mainly from TV13, with 60% of
Russians watching TV news every day14. Controlling the message and content of what is shown on TV is
therefore of particular importance for the Russian regime. In times of political protests, economic crisis
and foreign tensions, it seemed that the risk of having one last independent TV channel questioning the
policies of the government had become too big.
Even though the annexation of Crimea in 2014 had again led to an upsurge in popularity for Vladimir Putin
(Frye et al. 2017), the Kremlin continued to tighten the political bolts in view of the upcoming
parliamentary and presidential elections in 2016 and 2018. One reason was that Russia’s economy, that
was already slowing down substantially in 2012-2013 due to a general lack of reform and modernization,
went in full recession in 2014-2016 as a consequence of the preoccupation with the conflict with Ukraine
and the ensuing international sanctions. This economic deterioration fueled the animosity among Russia’s
ruling elites about popular protests and unrest around the time of the elections.
In the spring of 2016, the editorial team of the business TV channel RBC was forced to leave the channel15.
With this, Russia’s last independent TV channel available on the cable surrendered its independence.
During the same time, a new paramilitary force was established, the national guard, as the special OMON
troops of the Ministry of the Interior had proven to be insufficiently equipped to react to the electoral
protests in 201116. Finally, the day of the Russian parliamentary election was shifted from its traditional
date in December to September 18th, 2016. As most Russians usually spend the months of August and early
September on holidays at their dachas, this move was expected to make the election campaign short and
boring, and to reduce the risk of unrest and agitation before the parliamentary elections.
2.3 The 2016 Duma Elections
Media capture by the Russian state had thus reached an unprecedented level before the Duma election of
September 18th, 2016. The election was also characterized by an unprecedented level of political apathy.
Although 14 parties were officially registered to participate, it was almost certain that the government
12https://www.theguardian.com/commentisfree/2014/jan/30/russia-independent-tv-channel-censorship-tv-rain-leningrad 13 According to a Levada survey from November 2015, http://www.levada.ru/2015/12/16/televidenie-vyhodit-iz-polya-zreniya 14 http://www.levada.ru/2016/06/06/tv-bez-alternativy/
15 https://www.newyorker.com/news/news-desk/the-demise-of-rbc-and-investigative-reporting-in-russia
9
party United Russia would win with a large margin. The apathy was boosted by the failure of the opposition
to coordinate and communicate a coherent political message. The lack of excitement in the elections
resulted in the lowest participation rate in modern Russian history, with a turnout rate of only 48%.
In this setting, we provided access to an independent source of information to a randomly selected group
of Russian citizens. On its online platform, TV Rain provides a combination of political, economic and
cultural news and information, as well as some investigative journalism. These are offered through a
variation of formats, including traditional news broadcasts, interviews, talk shows, debates and
documentaries. Its content differs from the main state-controlled TV channels in that it critically covers
events inside Russia, including coverage of government-involvement in corruption cases. In contrast, news
on all other, state-controlled, TV channels is almost exclusively pro-government, and does not contain any
criticism of government institutions. On state-controlled TV news content is very homogeneous and news
items often seem to be determined by the federal government, albeit in a permutated order.
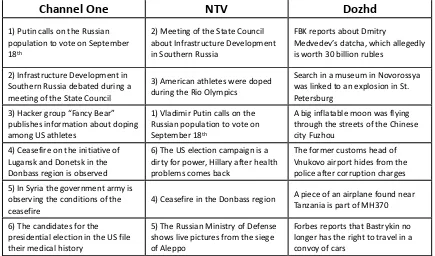
Table 1 provides an example of the principal news items during the main evening news-broadcast on
Russia’s two main TV channels Channel One and NTV on September 15th, 2016, three days before the Duma
election that took place on September 18th. We number the items to show how the almost perfect overlap
of the content in the two main state-controlled news-broadcasts is obfuscated by permutating the order
of the items. In covering a government conference on infrastructure development, alleged doping by US
athletes, a ceasefire by troops allied with Russia in Syria and Ukraine, and the dirty tactics of the US election
campaign, both channels closely follow the Kremlin’s propaganda line, while coverage of actual events
occurring in Russia is absent. We then compare the programming on state TV with news items during the
same evening on TV Rain. TV Rain covers two corruption scandals in Russia, a news item about the head
of Russia’s Investigative Committee Alexander Bastrykin being no longer allowed to travel in a convoy of
cars, as well as some international news. How much this difference in informational content influences
10
Table 1: First 6 items on Main Evening TV News (September 15th, 2016)
Channel One
NTV
Dozhd
1) Putin calls on the Russian population to vote on September 18th
2) Meeting of the State Council about Infrastructure Development in Southern Russia
FBK reports about Dmitry
Medvedev’s datcha, which allegedly is worth 30 billion rubles
2) Infrastructure Development in Southern Russia debated during a meeting of the State Council
3) American athletes were doped during the Rio Olympics
Search in a museum in Novorossya was linked to an explosion in St. Petersburg
3) Hacker group “Fancy Bear” publishes information about doping among US athletes
1) Vladimir Putin calls on the Russian population to vote on September 18th
A big inflatable moon was flying through the streets of the Chinese city Fuzhou
4) Ceasefire on the initiative of Lugansk and Donetsk in the Donbass region is observed
6) The US election campaign is a dirty for power, Hillary after health problems comes back
The former customs head of Vnukovo airport hides from the police after corruption charges 5) In Syria the government army is
observing the conditions of the ceasefire
4) Ceasefire in the Donbass region A piece of an airplane found near Tanzania is part of MH370
6) The candidates for the presidential election in the US file their medical history
5) The Russian Ministry of Defense shows live pictures from the siege of Aleppo
Forbes reports that Bastrykin no longer has the right to travel in a convoy of cars
3. Theory and Research Hypotheses
The theoretical literature on the question how independent media affects political behavior in
environments where most media are captured by the state remains divided. On the one hand, Besley and
Pratt (2006) argue that the impact of independent media in captured environments is likely to be larger
than in competitive media markets. Enikolopov et al. (2011) show how access to the independent TV
channel NTV during the 1999 Parliamentary elections in Russia increased the combined vote share for the
opposition parties by 6.3 percentage points, while decreasing the vote share for the pro-government party
by 8.9 percentage points. Barone et al. (2014) find an effect of similar size for pro-Berlusconi votes once
independent digital TV was introduced in Italy, where most TV channels were controlled by Berlusconi. As
the magnitude of the media effects measured in Russia and Italy were significantly higher than those found
by a similar study for the United States (DellaVigna and Gentzkow 2010), Enikolopov and Petrova (2015)
argue that media effects might indeed be stronger in captured environments. One theoretical mechanism
underlying this effect may be that full capture of the mass media creates an informational cascade (see
Welch, 1992), that effectively moves individual opinions into the direction desired by the government, but
is at the same time vulnerable to the arrival of new information, for example through access to an
11
On the other hand, a literature in political psychology argues that if media bias is easily noticeable, media
consumers might discount its message if it contradicts strong existing priors (see e.g. Lord, Ross and Leper
1979; Ditto and Lopez 1992 or Taber and Lodge 2006, as cited by Peisakhin and Rozenas 2018). A more
recent political economy literature comes to a similar conclusion (Gentzkow and Shapiro 2006; Ghelbach
and Sonin 2014). In some cases, messages that target consumers who have strong opposite priors might
even backfire, by reinforcing existing priors rather than inversing them (Lord, Ross and Lepper 1979; Ditto
and Lopez 1992). For example, Peisakhin and Rozenas (2018) find that exposure to Russian television during
the 2014 elections in Ukraine reinforced electoral support for pro-Russian parties among those voters with
strong pro-Russian priors, but was less effective and sometimes even counterproductive for voters with
strong pro-Western priors. Along these lines, we would expect that access to a randomly distributed
independent source of information like TV Rain would reinforce existing priors of voters with the strongest
positive beliefs about the Russian regime, in line with the polarization effect described by Bail et al. (2018).
4. Research Design
To test the effect of independent media on voting behavior, we conducted two parallel randomized
experiments during the 2016 Russian Parliamentary elections. Both experiments provide a randomly
selected sub-sample of the Russian population with access to independent media, in an environment
where most media are captured by the state. A control group permits us to test whether the randomly
provided access has an effect on political outcomes. The experiments complement each other by focusing
on two different levels of observation, with the first experiment providing access at the individual level,
and the second experiment providing access at the city level. Comparing the findings of both experiments
indicates that the results of our study are robust and suggests that they are scalable to the country as a
whole.
4.1 Choice of Independent Media
As independent medium for our experiment, we chose the political and entertainment channel TV Rain.
As described in Section 2, TV Rain was Russia’s last nationally available independent TV channel, until it
12
onwards only as a paid online TV channel, with an audience of 40 000 to 60 000 viewers, instead of several
million before 201417.
TV Rain is especially suitable to analyze the questions we have in mind, for two reasons. First, it permits
us to run a quasi-counterfactual experiment: what would have happened if the Russian government had
not ended the distribution of TV Rain on cable TV in 2014? Could the channel have played a politically
relevant role during the 2016 parliamentary elections? Second, the fact that the channel is now only
available on the internet and has a paywall for most of its content makes it easy to randomly distribute
free access to the channel to a specific sample of the Russian population. In 2016, about 72% of the Russian
population used the internet more than once a week, with 26% of the population using the internet as
their main source of information18. This provides us with a large pool of potential participants. The fact
that most of the content of TV Rain can only be accessed after paying a fee then makes it possible to
randomly distribute free access among a sub-group of Russia’s internet users.
4.2 Choice of location
In both our experiments, we focus on the population of 42 medium-size Russian cities, located in the
European part of Russia. Cities as a level of observation are convenient for our experimental design due
to their high population density, widespread internet penetration, and relatively homogeneous
population. We target cities of a size between 100 000 and 500 000 inhabitants, as they are big enough
for us to collect sufficient statistical data on their social and economic characteristics, but are not too
big to make treatment costs prohibitively high. About 20% of the Russian population live in cities of this
size, and we consider this population to be more representative of the „average” Russian citizen than
the population of Moscow or St. Petersburg.
We restrict our sample to the European part of Russia, since in this part of the country the quality of
infrastructure and the distance to the capital Moscow are relatively similar and comparable. We define
European Russia as those regions that are part of the Central, Southern, North-Western and Volga
Federal districts.
17 https://iz.ru/news/564921
13
We then further exclude from our sample all cities located in regions that have the status of a republic,
for several reasons. First, republics are special administrative regions and traditionally have a
substantial non-Russian ethnic minority or even majority, enjoy a special political relationship with
Moscow, and often have their own constitution. They usually also feature a more autocratic political
system than other Russian regions, which potentially could introduce a bias in surveys on politically
sensitive topics (Dininio and Orttung 2005). By omitting cities that are located in republics, we obtain a
sample that is culturally and politically more homogeneous.
Second, and more importantly, electoral fraud is a much bigger concern in republics than in other
Russian regions (Ordeshook and Myagkov 2008). As described more in detail in section 5 below, too
high levels of electoral fraud could become a concern for our study, as manipulated election results do
no longer represent the actual voting behavior of the population.
However, as electoral fraud is also present, if less intense, in other Russian regions (see e.g. Shpilkin
2011; Enikolopov et al. 2013 or Buzin et al. 2016), we further exclude from our sample 4 cities where
the vote share for the incumbent party was above 60% during the 2011 Duma elections (i.e. 10% above
the average national result and 20% above the average result for non-republic regions). This leaves us
with a final sample of 42 cities for the city-level experiment. For the individual experiment, we randomly
selected 12 cities from this sample of 42 cities to carry out our survey of 1211 respondents, with about
100 respondents being interviewed per city.
5. Experiment at the city level
We start with our randomized controlled field experiment at the city level, From the 42 cities described in
section 4.2, we randomly selected 15 cities for treatment with an advertising campaign for TV Rain on the
Russian social network VKontakte. We complemented this treatment with free access to TV Rain in the 15
treatment cities, 3 weeks before the Russian Parliamentary elections that took place in September 2016.
To test if free access had an effect on its own, we additionally randomly selected 5 cities that received free
access, but no advertisement campaign. To test if free access and the advertisement campaign had a
measurable effect on voting behavior, we then compare the election results between the 15 cities that
received our treatment, and the 22 cities in our control group. Section 6.1 introduces the technical details
14
placebo test as robustness check, and section 6.5 discusses possible mechanisms behind the results we
find.
5.1 Experimental Design
The option to freely access TV Rain was implemented with the help of a free trial subscription offer. We
used automatic identification of the geo-location to determine if a visitor came from one of the 20 cities
that were randomly selected to receive free access. If a visitor was identified to come from one of the
selected cities, he or she received a pop-up message on the starting page of the TV Rain website, with an
offer to receive a 30 days free subscription after a short registration. This free trial subscription offer was
available in the 20 treatment cities from August 27th, 2016 (22 days before the election) until October 10th,
2016 (22 days after the election).
We complemented the free trial subscription with a city-level advertising campaign on the Russian social
network VKontakte in 15 of the 20 free trial subscription cities. VKontakte is Russia’s most popular social
network, as well as the country’s most popular website. Our main treatment is therefore the combination
of our TV Rain advertisement campaign on VKontakte and the free trial subscription offer for TV Rain in 15
randomly selected treatment cities. The other 5 randomly selected cities that received the free trial
subscription offer without complementary advertising campaign permit us to verify whether free access
per se was enough to affect voting behavior.
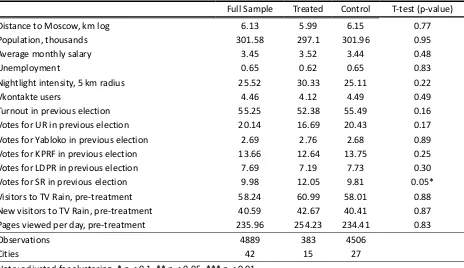
Table 2: The test of means for cities with advertising campaign and free-trial
Full Sample Treated Control T-test (p-value)
Distance to Moscow, km log 6.13 6.12 6.14 0.95
Population, thousands 301.58 298.81 303.16 0.91
Average monthly salary 3.45 3.38 3.48 0.15
Unemployment 0.65 0.62 0.67 0.45
Nightlight intensity, 5 km radius 25.52 23.22 26.83 0.49
Vkontakte users 4.46 4.65 4.35 0.32
Turnout in previous election 55.25 54.56 55.64 0.70
Votes for UR in previous election 20.14 18.86 20.86 0.45
Votes for Yabloko in previous election 2.69 2.55 2.77 0.47
Votes for KPRF in previous election 13.66 14.62 13.12 0.25
Votes for LDPR in previous election 7.69 8.01 7.5 0.13
15
Visitors to TV Rain, pre-treatment 58.24 52.76 61.35 0.34
New visitors to TV Rain, pre-treatment 40.59 36.78 42.76 0.35
Pages viewed per day, pre-treatment 235.96 224.92 242.24 0.67
Observations 4889 1772 3117
Cities 42 15 27
Note: adjusted for clustering, * p < 0.1, ** p < 0.05, *** p < 0.01.
Table 3: The test of means for cities with free-trial only
Full Sample Treated Control T-test (p-value)
Distance to Moscow, km log 6.13 5.99 6.15 0.77
Population, thousands 301.58 297.1 301.96 0.95
Average monthly salary 3.45 3.52 3.44 0.48
Unemployment 0.65 0.62 0.65 0.83
Nightlight intensity, 5 km radius 25.52 30.33 25.11 0.22
Vkontakte users 4.46 4.12 4.49 0.49
Turnout in previous election 55.25 52.38 55.49 0.16
Votes for UR in previous election 20.14 16.69 20.43 0.17
Votes for Yabloko in previous election 2.69 2.76 2.68 0.89
Votes for KPRF in previous election 13.66 12.64 13.75 0.25
Votes for LDPR in previous election 7.69 7.19 7.73 0.30
Votes for SR in previous election 9.98 12.05 9.81 0.05*
Visitors to TV Rain, pre-treatment 58.24 60.99 58.01 0.88
New visitors to TV Rain, pre-treatment 40.59 42.67 40.41 0.87
Pages viewed per day, pre-treatment 235.96 254.23 234.41 0.83
Observations 4889 383 4506
Cities 42 15 27
Note: adjusted for clustering, * p < 0.1, ** p < 0.05, *** p < 0.01.
The city experiment uses polling stations as unit of observations. There 4889 polling stations in our sample
of 42 cities. The basic estimation is done at the level of polling stations (cross-section), and further we use
controls for the past results of elections in 2011 at the district level (42 cities have 79 districts) to
first-difference the electoral outcomes. Table 2 shows the means for variables in 15 treated and 27 control cities
at the level of polling stations. Table 3 presents the t-test of means for cities with free-trial only at the level
of polling stations (no advertisement campaign on VKontakte). The results clearly indicate the
randomization has worked well
The advertising campaign consisted of advertisement banners for TV Rain, visible to VKontakte users from
the selected geo-locationson the left side of their news feed. The banners were complemented with one
post in the VKontakte city-community public group of every treated city19, posted between September 7th
16
and September 12th, 2016. This post was directly visible in the news feed of everyone who had subscribed
to the city-community group of a respective city.
The banners and posts were advertising the free trial option, did not carry any political message, and
presented the channel as entertainment media. An example for a banner, showing the portrait of TV Rain
news anchors Pavel Lobkov and Ksenia Sobchak, is displayed in Appendix A.2. Overall, the banners were
displayed 20.6 million times to VKontakte users before the election. This translates into an average of 6
banner views per VKontakte user per city. As we allocated equal advertisement budgets for each city, the
amount of displays per voter is slightly decreasing with city size, with the biggest cities in our sample only
having 5 displays per voter on average20. In addition, the amount of banner displays per voter was also
affected by the number of VKontakte users per city, their daily activity, and the number of other competing
advertisements per city for the target audience.
Our study is an example of encouragement design (Hirano et al. 2000; Duflo, Glennerster and Kremer
2008), in that it is not the treatment itself, but the free availability of the treatment that is randomly
assigned. In a first step, we therefore need to show our treatment was taken up by the treatment group,
i.e. free access and our advertising campaign have increased the audience of TV Rain during the two weeks
before the 2016 Duma elections, relative to the pre-treatment period. If our treatment is indeed found to
have increased the viewership of TV Rain, we can then proceed by analyzing whether this increase in the
audience of the TV channel has had an effect on political behavior.
To control for a possible increase in the viewership and popularity of TV Rain during the pre-election period,
for example as a result of a generally higher interest in political news during the election campaign, we
implement a difference-in-difference design, and compare the popularity of TV Rain before the 2016 Duma
elections with the popularity of TV Rain before the 2011 Duma elections. To measure the popularity of TV
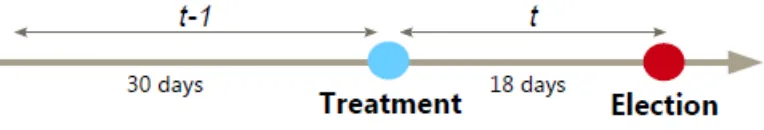
Rain, we use three parameters published by Yandex Metrics (the Russian equivalent of Google Analytics):
the percentage change in the total number of pages viewed, the average daily amount of visitors, as well
as the number of pages viewed per visit during the treatment period (t) as compared to the 31-day period
before the treatment (t-1) (Figure 3). We gather these measures for the period before the parliamentary
20 For technical reasons related to a low number of Vkontakte users with identified geo-location and some technical difficulties
17
elections in 2016 and 2011, respectively, and construct a panel data-set with 42 cities and 2 years. We use
OLS with time-demeaned data and a fixed effect for the year of 2016.
Figure 1: Construction of the popularity measurement for the website of TV Rain
Table 4 shows how the advertising campaign and free-trial option have increased the popularity of TV Rain
in randomly selected cities during the 18 days (1-18 September) before the election compared to the 31
days (1-31 August) before the potential treatment. The main variables estimating the change in TV Rain
popularity are the amount of visitors to the website, the amount of new visitors identified as unique visitors
over each period of time, and the total amount of pages viewed per day and per 100 000 registered voters
in the city. Results at the district level show that our treatment led to a 10,7% increase in the overall number
of pages viewed per day, driven by a 10,7% increase in the daily amount of new visitors to the website.
Table 4 also provides evidence that free-trial option increased the popularity of the TV Rain channel only
in the cities with an advertising campaign in Vkontakte. Our results also hold when taking the number of
ads per voter as our explanatory variable, rather than a dummy variable for the cities with free trial and
advertisement.
Table 4: The increase in TV Rain popularity
(1) (2) (3)
First difference, treated period (18 days, September)
pre-treated period (31 days, August)
Change in percent of Visitors per day, per capita
Change in percent of New Visitors
per day, per capita
Change in percent of Pages viewed in total
per day, per capita
Ads and free-trial 9.061** 10.723** 10.731***
(2.49) (2.44) (2.73)
Free Trial only -2.436 -3.51 -0.032
(-1.21) (-1.63) (-0.01)
Observations 4889 4889 4889
R2 0.19 0.20 0.16
18
5.2 DataOur main outcome variables are Duma election results for the parliamentary elections in 2016. We gather
electoral data from the Central Election Commission of the Russian Federation21. Electoral data are
available at the level of polling stations and covers 4889 stations in total or 116 stations per city. Polling
stations are assigned to electoral districts with an average size of 109 000 inhabitants per district, and an
average city in our sample has about 2 electoral districts.
The electoral data contain the number of voters registered, the number of ballots cast, and the number of
votes for all registered political parties. We use this data to construct our main dependent variables: the
turnout rate, the votes cast for the incumbent party (United Russia) per 100 registered voter, as well as the
votes cast for the oldest liberal opposition party Yabloko and all other parties per 100 registered voters. To
reduce the risk of distortion through electoral fraud, we follow existing research on Russian elections (see
e.g. Klimek et al. 2012; Enikolopov et al. 2013) and exclude from our sample all polling stations with a
number of voters below 100. These polling stations are usually special cases such as hospitals or prisons,
with a high risk of patients or inmates being coerced to vote for the ruling party.
Our main explanatory variable is the randomized treatment with TV Rain. We will control for a variety of
factors that could potentially affect voting both at the city and at the district level. We include the voter
turnout and the elections results for all parties at the 2011 elections as controls. To account for the
popularity of TV Rain in a city prior to our treatment, we use the average number of pages viewed per
voter in a given city, for the month before the start of our treatment period. In addition, we control for the
number of VKontakte users per 100 voters in a city, as the penetration of social networks per se could also
potentially affect voting behavior (Enikolopov et al. 2017). To control for the local socioeconomic context
we include the average monthly salary and the unemployment rate available at the city level, the amount
of nightlight emitted in radius of 5 kilometers around the center of electoral district in 2015 as a proxy for
development, and dummies for the three administrative regions where cities are located. Finally we use
data from the Russian election monitoring organization GOLOS22 to include the total number of reported
electoral violations (reported by observers or voters, per 100.000 voters at the district level). If electoral
observers or normal voters have witnessed a violation, they can report it to the GOLOS project website,
where it is posted after some moderation by GOLOS volunteers. We use the number of violations per 100
000 voters reported by observers at the level of the electoral district as our primary control for electoral
21 http://www.cikrf.ru
19
violations. While it is tempting to interpret reported violations as a signal for electoral fraud, in a managed
democracy like Russia reported violations also indicate the presence of active electoral observers, who by
their sheer presence may discipline local officials and keep the level of fraud in check (Enikolopov et al.,
2013).
5.3 Results
Table 5: The linear effect of the treatment on voting behaviour
(1) (2) (3) (4) (5) (6) (7) (8) (9) (10) (11) (12) (13) (14) (15)
Turnout UR Yabloko Parnas KPRF LDPR SR Rodina Com Green GS GP Rost Pens Patriot
Ads and free-trial -0.846 0.131 0.007 -0.032 0.727 -0.734 -0.363 -0.52 0.134 -0.096 -0.019 -0.09 0.044 -0.206 0.215
(-0.25) (0.06) (0.04) (-0.42) (1.39) (-0.83) (-0.88) (-1.64) (0.78) (-0.85) (-1.19) (-1.12) (0.47) (-0.91) (0.93)
Free Trial only -3.184 -1.254 -0.066 -0.074 0.394 -1.16 0.576 -0.319 -0.194 -0.192* -0.022 -0.136* -0.122 -0.369* -0.064*
(-1.02) (-0.68) (-0.26) (-0.84) (0.46) (-1.36) (0.93) (-0.90) (-1.26) (-1.78) (-1.38) (-1.69) (-1.57) (-1.83) (-1.89)
Obs 4889 4889 4889 4889 4889 4889 4889 4889 4889 4889 4889 4889 4889 4889 4889
R2 0.00 0.00 0.00 0.00 0.01 0.01 0.01 0.03 0.01 0.00 0.00 0.01 0.00 0.01 0.03
Note: t statistics in parentheses, * p < 0.1, ** p < 0.05, *** p < 0.01.
Table 5 presents the basic estimation with a linear model and no controls. We regress dummy variables of
our main and secondary treatment on the shares of votes casted for each of 13 parties from the total
number of voters registered. We find no direct effect of providing free trial and advertisement.Table 6
presents the same regressions including all our controls. The results remain broadly the same.
Table 6: The linear effect of the treatment with controls
(1) (2) (3) (4) (5) (6) (7) (8) (9) (10) (11) (12) (13) (14) (15)
Turnout UR Yabloko Parnas KPRF LDPR SR Rodina Com Green GS GP Rost Pens Patriot
Ads -0.029 0.738 0.041 0.016 -0.133 -0.220 -0.001 -0.708* 0.131 0.022 -0.021 -0.036 0.080 -0.095 0.211 (-0.09) (0.79) (0.42) (0.38) (-0.48) (-0.57) (-0.00) (-1.78) (1.02) (0.57) (-1.66) (-1.02) (1.13) (-0.94) (1.08) Free Trial -0.138 0.797 -0.010 -0.102** 0.957 -1.116** 0.277 0.002 -0.024 -0.218*** -0.004 -0.165*** -0.086 -0.305*** -0.055 (-0.35) (0.60) (-0.06) (-2.27) (1.38) (-2.29) (0.43) (0.01) (-0.21) (-4.61) (-0.38) (-3.37) (-1.15) (-3.67) (-0.50) Turnout 2011 0.987*** 0.521*** 0.027*** 0.014*** 0.077*** 0.174*** 0.036*** 0.012** 0.025*** 0.018*** 0.003*** 0.004*** 0.006*** 0.033*** 0.010***
(116.22) (12.17) (3.45) (4.57) (11.28) (9.68) (6.53) (2.62) (5.84) (5.15) (2.90) (5.92) (3.20) (4.07) (3.98) United Russia 2011 0.091*** 0.159*** -0.022*** -0.005** -0.013 -0.032 0.010 0.021 0.003 -0.002 -0.001* -0.003 0.000 -0.001 -0.017*
20
LDPR 2011 0.084 -1.139*** -0.021 -0.008 0.334* 0.601*** -0.041 0.038 0.044 0.002 0.016* -0.011 0.016 0.119** 0.035 (0.70) (-2.93) (-0.56) (-0.64) (1.96) (5.21) (-0.49) (0.36) (1.15) (0.25) (1.71) (-1.16) (0.83) (2.43) (1.08) SR 2011 0.041 -0.352** 0.009 0.006 0.050 0.165** 0.271*** -0.080 -0.018 0.008 -0.004* -0.017* 0.016 0.027 -0.032 (0.64) (-2.31) (0.50) (0.67) (0.66) (2.24) (4.25) (-1.07) (-0.85) (1.34) (-1.87) (-2.00) (1.57) (1.41) (-1.49) Salary -1.991** -2.088 -1.219** 0.000 -2.056** 2.583** 0.449 -1.439 0.086 0.452*** 0.035 0.446*** -0.234 0.697** 0.063 (-2.09) (-0.78) (-2.57) (0.00) (-2.45) (2.30) (0.45) (-1.01) (0.32) (4.32) (1.15) (3.09) (-1.37) (2.29) (0.23) Nightlight 0.024** 0.022 -0.003 0.005** -0.008 -0.007 0.014 0.001 0.004 0.005*** -0.002 0.006*** 0.004** -0.004 -0.011 (2.21) (0.45) (-0.56) (2.20) (-0.76) (-0.39) (1.13) (0.10) (0.96) (2.82) (-1.37) (3.81) (2.30) (-0.60) (-1.49) Unemployment -1.397 -0.718 -0.062 -0.022 -0.850 0.014 0.324 -1.161 0.623* 0.182** 0.014 0.225*** 0.084 0.077 0.010 (-1.54) (-0.29) (-0.17) (-0.24) (-1.23) (0.02) (0.31) (-1.16) (1.75) (2.65) (0.61) (2.85) (0.59) (0.34) (0.06) Vkontakte 0.634*** -0.409 -0.103* 0.039* 0.142 0.218 0.053 0.164 0.131** 0.055** -0.005 0.060*** -0.014 0.134*** 0.008 (3.89) (-0.97) (-1.88) (1.82) (0.49) (1.12) (0.31) (1.40) (2.55) (2.34) (-1.02) (2.88) (-0.38) (2.81) (0.16) Visitors August -0.040*** -0.071*** -0.003 -0.001 -0.001 0.015 0.012 -0.002 -0.001 0.001 0.000 0.001 0.002 0.001 0.004 (-4.41) (-3.36) (-1.23) (-0.53) (-0.09) (1.64) (1.43) (-0.28) (-0.36) (0.70) (1.08) (1.35) (1.67) (0.42) (1.31) Violations district 0.184*** -0.045 0.004 0.002 -0.171* 0.192** 0.045 0.054 0.013 0.012 0.000 0.005 -0.001 0.026* 0.014 (3.58) (-0.39) (0.28) (0.25) (-1.82) (2.69) (1.03) (1.23) (0.78) (1.67) (-0.25) (1.10) (-0.09) (1.91) (0.94) North West Okrug 0.132 0.178 0.260 -0.145** -0.468 -0.278 0.109 0.616 -0.108 -0.168*** 0.030** -0.049 0.053 0.238 -0.124 (0.31) (0.19) (1.15) (-2.03) (-1.22) (-0.54) (0.24) (0.77) (-0.75) (-2.92) (2.13) (-0.96) (0.56) (1.43) (-0.73) Volga Okrug -0.795 -2.367 -0.305 -0.069 0.742 1.242* 0.126 -0.839 0.317* -0.039 0.003 0.027 0.265 0.047 -0.200 (-1.14) (-1.37) (-1.34) (-0.69) (0.81) (1.83) (0.21) (-1.11) (1.87) (-0.65) (0.18) (0.59) (1.50) (0.26) (-0.92) South Okrug -1.224* -1.253 -0.627*** -0.041 0.050 0.892 -0.341 -0.591 0.241 0.062 0.004 0.179*** -0.010 0.076 -0.060 (-1.82) (-0.75) (-2.70) (-0.61) (0.08) (1.57) (-0.49) (-0.96) (1.22) (1.33) (0.22) (2.84) (-0.14) (0.47) (-0.51) Observations 4889 4889 4889 4889 4889 4889 4889 4889 4889 4889 4889 4889 4889 4889 4889 R2 0.87 0.61 0.16 0.12 0.28 0.47 0.25 0.15 0.19 0.17 0.04 0.14 0.09 0.23 0.18
We proceed by testing the presence of polarization effects in our sample. For that purpose we introduce
the interaction term between our main treatment and electoral support for United Russia (UR) in the 2011
Duma elections at the polling station level . The results are presented in Table 7. Column 1 suggests that
the treatment had a negative effect on the turnout but only in cities with 2011 UR support below 19.8
percentage points. The effect is consistent with the previous empirical findings by Enikolopov et al. (2011).
The estimated effect on turnout ranges from 4.2 percentage points lower turnout for treated districts with
lowest 2011 UR support to a peak of 9.3 percentage points higher turnout for treated districts with highest
2011 UR support and crosses the zero line when 2011 UR support reaches 19.8 percentage points. We
attribute the positive effect to the polarization effect of independent media on partisan supporters of the
regime, who are triggered into electoral action upon receiving information that does not coincide with
21
Table 7: The dual effect of the treatment(1) (2) (3) (4) (5) (6) (7) (8) (9) (10) (11) (12) (13) (14) (15)
Turnout UR Yabloko Parnas KPRF LDPR SR Rodina Com Green GS GP Rost Pens Patriot
Ads -15.836*-14.286** 1.733** 0.268 -1.621 -2.920 -0.655 0.532 0.384 0.200 -0.054 -0.260 -0.020 0.027 0.849
(-1.85) (-2.62) (2.29) (1.22) (-0.97) (-1.22) (-0.50) (0.82) (0.74) (0.77) (-1.35)(-1.52) (-0.05) (0.04) (0.99)
Ads * UR_2011 0.801*** 0.789*** -0.093**-0.016* 0.125 0.104 0.011 -0.051 -0.013-0.016* 0.0020.008* 0.003 -0.014 -0.034
(2.71) (3.23) (-2.57) (-1.94) (1.39) (1.01) (0.17) (-1.17)(-0.58) (-1.89) (1.30) (1.76) (0.10) (-0.55) (-1.00)
Free Trial -2.977 -0.399 -0.123 -0.093 0.395 -1.578 0.417 -0.136 -0.191 -0.208 -0.028 -0.162-0.151*-0.422* -0.081**
(-0.79) (-0.19) (-0.52) (-1.00) (0.47) (-1.68) (0.60) (-0.55)(-1.08) (-1.60) (-1.47)(-1.66) (-2.00) (-1.74) (-2.15)
UR_2011 0.043 0.180* -0.012 -0.004 0.000 -0.088*-0.033* 0.038 0.001 -0.003 -0.001 -0.006 -0.006 -0.011 -0.004*
(0.27) (1.87) (-1.14) (-0.99) (0.01) (-1.96) (-1.85) (0.90) (0.06) (-0.52) (-1.31)(-1.30) (-1.51) (-0.88) (-1.74)
Obs 4889 4889 4889 4889 4889 4889 4889 4889 4889 4889 4889 4889 4889 4889 4889
R2 0.01 0.05 0.03 0.01 0.02 0.03 0.03 0.07 0.01 0.01 0.00 0.02 0.01 0.01 0.05
Note: t statistics in parentheses, * p < 0.1, ** p < 0.05, *** p < 0.01.
In column 2 of Table 7 we find an almost identical pattern for votes casted for United Russia: the treatment
decreases United Russia votes in districts with previous UR support below 18.1 percentage points, while it
increases UR votes in districts above this threshold. The implied effect on UR votes at the polling station
level ranges from 3.6 percentage points less UR votes in districts with the lowest 2011 UR support to 13,2
percentage points more votes for UR in districts with the highest 2011 UR support. This is in line with both
a persuasion effect in districts with low prior UR support and a polarization effect in districts with high prior
UR support (Enikolopov et al., 2011). The polarizing effect of our treatment is expected to be more
substantial among supporters of the current regime for two reasons: first, they are more likely to get their
information mainly from state-controlled media that have been persistently priming the population into
partisanship by providing one-sided news and, second, the conservative ideology of the regime makes its
supporters more prone to polarization in the same way as the republican supporters in USA are more likely
to become polarized (Bail et al. 2018). The equivalent results for turnout and votes for UR in columns 1 and
2 suggest that voters that were driven to the polling stations by polarization were also more likely to vote
for the ruling party.
When we turn to the results for an opposition party Yabloko we find an opposite interaction effect with
almost the same turning point of 18.6 percentage point of electoral support for United Russia. Yabloko was
the only significant opposition party present at 2016 election, and thus it was expected to be particularly
affected by our treatment. Although the treatment yielded Yabloko a larger share of the popular vote in
cities with low prior UR support, it also made Yabloko lose votes to this ruling party in cities with high prior
22
Table 8 repeats the results of Table 7, but includes all the controls. The polarization results are very robust
to the inclusion of controls.
Table 8: The dual effect of the treatment with controls
(1) (2) (3) (4) (5) (6) (7) (8) (9) (10) (11) (12) (13) (14) (15)
Turnout UR Yabloko Parnas KPRF LDPR SR Rodina Com Green GS GP Rost Pens Patriot
Ads -16.677** -11.990** 0.679* 0.007 -1.710 -3.835** -0.855 0.634 0.842** 0.007 -0.094*** -0.212 -0.283 -0.549 0.627 (-2.21) (-2.31) (1.94) (0.06) (-1.22) (-2.21) (-0.64) (0.67) (2.04) (0.04) (-3.38) (-1.53) (-0.66) (-1.54) (1.03) Ads *UR_2011 0.776** 0.611** -0.032** -0.001 0.082 0.164* 0.040 -0.064 -0.040** -0.001 0.003*** 0.009* 0.019 0.021 -0.029 (2.30) (2.44) (-2.04) (-0.14) (1.17) (1.74) (0.59) (-1.12) (-2.18) (-0.18) (2.79) (1.69) (0.78) (1.03) (-1.07) free -0.355 0.660 -0.049 -0.102** 0.824 -1.047 0.277 -0.071 0.000 -0.209*** -0.005 -0.179*** -0.105 -0.309** 0.046 (-0.10) (0.27) (-0.37) (-2.58) (1.05) (-1.50) (0.44) (-0.31) (0.00) (-3.16) (-0.34) (-3.17) (-1.62) (-2.16) (0.45) Turnout 2011 12.677* 7.661 -0.347 0.146 -0.179 3.611*** 0.633 -1.082 0.292 0.275 0.042 -0.050 -0.025 0.430 1.060* (1.73) (1.65) (-1.23) (1.24) (-0.15) (3.42) (0.74) (-1.01) (0.77) (1.28) (1.52) (-0.41) (-0.21) (1.45) (1.75) United Russia 2011 -12.453* -7.445 0.332 -0.148 0.172 -3.619*** -0.619 1.108 -0.281 -0.273 -0.043 0.047 0.024 -0.427 -1.072*
23
The differential effect of our treatment on votes for United Russia is in line with several potential
explanations about the underlying mechanism at play. One possibility is that our treatment led to political
polarization, similar to the polarizing effect of Russian state TV on voters in eastern Ukraine identified by
Peisakhin and Rozenas (2018). In cities where United Russia traditionally showed a stronger performance,
the promotion of a TV channel providing critical information about the government might have increased,
rather than decreased, existing positive priors about the performance of the government23. In cities where
United Russia was less successful in the past, on the other hand, our treatment might have reinforced
existing negative priors about the ruling party, thus leading to a reduction in votes for United Russia. An
analysis of the comments that were posted under the advertisement banners placed in the city-community
groups of VKontakte shows that the percentage of negative comments about TV Rain as a share of all
comments in a given city is indeed positively correlated with the vote share obtained by United Russia in
201124, suggesting that political polarization might have played a role.
Another potential mechanism might be differences in the salience of the message and news content
provided by TV Rain. In cities where United Russia performed less well in 2011, the lower election result
might be due to some underlying problems that the governing party was unable to address. In other words,
reporting on TV Rain about problems related to government mismanagement, deficient infrastructure or
government corruption might resonate more with voters in regions where these problems are more
prevalent. At the same time, these regions might also feature lower election results for United Russia.
5.4 Ripple effects
Given the brevity of our treatment period, we find a relatively strong result. One possibility is that our
treatment created spillover effects, as treated individuals started to share the free trial subscription offer
of TV Rain or what they saw on TV Rain with family and friends. Although we cannot observe what people
23 This would be in line with a psychological literature arguing that messages featuring opposite priors might increase, rather than
decrease, existing priors when targeted at consumers with particularly strong existing priors (Ditto and Lopez 1992; Lord, Ross and Lepper 1979).
24We were able to collect the comments posted below the advertisement banners that were placed in the city-community groups
24
share in general, we are able to observe what they share on VKontakte on their personal walls and on the
VKontakte city websites, where they were exposed to the TV Rain banner in the first place.
We use Yandex analytics to count mentions of TV Rain on the walls of individual users from given cities and
in groups that can be linked to a specific city. In table 10, we regress the number of posts both for the
whole of September and for the period before and after the elections on the number of posts in August
and on a dummy variable for the 15 treatment cities. We also control for the 5 cities not treated with the
banner campaign but treated with free access. We observe that in our treatment cities the number of posts
about TV Rain clearly increases, while there is no effect for the non-treated cities. In a placebo regression,
we then repeat this analysis with August as synthetic treatment period and July as benchmark. Here we do
not find an effect of our dummy variable on posts about TV Rain, suggesting that the effect found for
September ensues from our advertisement campaign, and not from some other unobserved city-level
pattern. This indicates that our advertisement campaign indeed had ripple effects on social media that
increased the reach of the campaign beyond the circle of directly treated subjects, which could help to
explain the size of the effects found in our main city level regressions.
Table 10: Ripple effect of the VKontakte banner campaign on social media
Posts on user's walls and city groups Placebo regressions
VARIABLES Posts in September (before 26) Posts in August (before 26)
Whole September
September Before Elections
September After Elections
Posts on users' walls
Posts in groups
Both
Advertising_Free 1.093*** 1.407*** 0.924** 0.235 -0.997 -0.290
[0.275] [0.450] [0.366] [0.553] [1.472] [0.557]
Free_Only 1.513 -15.506*** 1.840* -1.002 -15.221*** -1.164**
[0.927] [0.640] [0.967] [1.000] [0.633] [0.582]
Posts in August (before 26) 0.344*** 0.428*** 0.284***
[0.042] [0.054] [0.072]
Posts in July 0.566*** 0.438* 0.304***
[0.190] [0.242] [0.106]
6. Individual experiment
To verify whether city level results, based on real outcomes in a field experiment using social media, are
robust to the level of individual respondents, we complement them with an individual randomized
25
like their use of social media. This individual experiment will also allow us to disentangle the polarization
effect from the salience effect through the inclsion of city fixed effectss, since the treatment is not longer
at the level of the city, but at the individual level. If we find the same results in the individual experiment,
then the reslts can only be explained by the polarization effect and not by the saliencey effect, because the
latter is absorbed by the city fixed effects.
As in the previous experiment we want to randomly distribute awareness and access to TV Rain to
individual respondents of a survey. For this purpose, we distributed a free subscription to TV Rain to a
random sample of Russian citizens with the help of a telephone survey carried out before the Russian
Duma election in September 2016. As a control group, a third of the survey respondents did not receive a
subscription code. The survey was conducted by the Levada-Center, a professional Moscow-based
sociological polling and research organization with a reputation for being independent from the
government.
The experimental design of the survey includes two waves of telephone interviews, a first wave before the
election, and a second wave after the election. This permits us to control for pre-treatment intentions to
vote: in the first wave respondents were asked whether they plan to vote in the upcoming election and if
yes, which party they are planning to vote for. In the second wave, we asked respondents for which party
they actually voted, enabling us to determine whether the randomly distributed access to TV Rain had an
effect on reported voting behavior. This setting allows to minimize reporting bias, as we only analyze the
deviation between self-reported intentions from the first wave and self-reported behavior from the second
wave.
6.1 Methodology and Data
The first wave of the survey started 17 days before the election, and was completed 8 days before the
election. It was conducted in 12 medium-sized cities in the European part of Russia, which were randomly
selected from the 42 cities described in section 4.2. In every city, we conducted a randomized telephone
interview of on average 100 people who reported to use the internet at least 2-3 times a week25. Our final
sample for the first wave consists of 1211 respondents.
26
During the first wave of the interview, we collected data on personal characteristics of the respondents,
such as age, gender, education, income, whether they are employed in the public sector, their satisfaction
or dissatisfaction with Russia’s political and economic situation, as well data on personal media
consumption and preferred sources of information. We then also ask whether respondents were planning
to vote, and if yes for which party. At the end of the interview, 66% of our respondents were randomly
selected to receive a one-month free subscription to TV Rain. The free subscription was described as a
reward for the successful completion of the survey.
Directly after completing the survey, respondents from the treatment group received a telephone message
with a personal twelve digits code and a link to the website of TV Rain, where the code could be activated
to start a 30-day free trial subscription. In total, we distributed 806 activation codes for TV Rain. All
respondents who received a code later received an additional message via SMS after all the interviews had
been conducted, stating that the code would expire within three days and reminding them to activate the
code.
The second wave of the survey was carried out from October 12th to October 18th, 2016. During the second
wave, respondents were asked about their actual voting behavior during the election of September 18th,
2016. The response rate in the second wave was about 40%, providing us with a final sample of 483
respondents, including 296 who had received a free subscription code during the first wave, and 187
respondents who were not offered this option.
After the distribution of the subscription codes, respondents had the choice either to comply with our
treatment, or to ignore it. To estimate the compliance rate, we asked respondents in both waves of the
survey about their previous experience with TV Rain. Both in the first and in the second wave, respondents
were asked “Do you know anything about the online TV channel TV Rain?” They were then offered three
answer options: “Yes, I heard about it and watched it”, “Yes, I heard about it but never watched it”, “No, I
do not know anything about it”. The answers from the second wave show that the group of respondents
that received our treatment were 10.8% more likely to say that they have watched TV Rain in the past
compared to their answers during the first wave, while we observe no difference between the two waves
in the control group. This effect demonstrates the compliance rate for our treatment.
Table 11 presents the summary of survey variables employed in our individual experiment. The variable
"Started TV Rain" equals 1 for respondents without prior experience of watching the channel in the first
27
the efficiency of our treatment to promote TV Rain. We expect that the overall effect of our treatment can
be larger than those that started to watch, since respondents with prior TV Rain experience may have
started to watch TV Rain more because of the treatment. In our main estimations we therefore use the
randomly offered free trial subscription as the main treatment.
Table 11: Summary of variables for the individual experiment
Variable name Description Mean St.
dev. Subscription
offer
Dummy variable that equals 1 if respondent was offered a code for activation of free trial subscription
0.61 0.49
Started TV Rain Dummy variable that equals 1 if the respondent has reported “having watched TV Rain” in the second wave but did no report “watching TV Rain previously” in the first wave; equals 0 otherwise
0.13 0.33
Intention to vote
Dummy variable that equ