Nuclear Physics Institute, Moscow State University, Russia
3Space Research Institute, Austrian Academy of Sciences, Graz, Austria 4Faculty of Physics, Moscow State University, Russia
Received: 22 June 2009 – Revised: 21 October 2009 – Accepted: 21 October 2009 – Published: 29 October 2009
Abstract. Kinetic structure of embedded thin horizontal rent sheets is investigated. Current density estimated by cur-lometer technique is in general agreement with a sum of elec-tron and proton currents. Embedding of observed thin cur-rent sheets in the much wider plasma sheet is appacur-rent in the current density profiles. Ion velocity distributions con-sist of two parts: the cold non-drifting core likely belongs to the plasma sheet background, while the hotter asymmetric “wings” carry the main portion of the current. Oxygen ions (if present) and higher-energy tails of distribution function can contribute up to 30% of the total current. We compared current density profiles across sheets with three typical cur-rent sheet models. Models which allow embedding, describe observed structures equally well at the level of experimental accuracy.
Keywords. Magnetospheric physics (Magnetotail) – Space plasma physics (Numerical simulation studies)
1 Introduction
With the recent four-spacecraft observations in the Earth’s magnetotail it is now possible to determine magnetic gra-dients, electric current densities, to restore (under the con-dition of stationarity) current density profiles across current sheets (CS) (Runov et al., 2006; Nakamura et al., 2006) as well as to make quantitative comparisons with theory (Sit-nov et al., 2006; Baumjohan et al., 2007; Artemyev et al., 2008a). Though some elements of CS structure were de-scribed in previous two-spacecraft, or even single-spacecraft experiments, these results substantially relied on lucky occa-sions and/or limiting suppositions about the sheet geometry
Correspondence to: A. V. Artemyev
and motion. With four points, however, one can investigate CS structure in the full 3-D geometry and on a much larger statistics. For example, CS bifurcation (double-peaked cur-rent density) was first reported in GEOTAIL observations by Hoshino et al. (1996). With the recent observations of bi-furcated CS by CLUSTER (Sergeev et al., 2003; Runov et al., 2003; Thompson et al., 2006; Israelevich et al., 2008) it became possible to perform thorough comparisons with the-ories (Zelenyi et al., 2002; Sitnov et al., 2006).
An important result of CLUSTER measurements in the magnetotail is abundance of thin CS (TCS), with the thick-ness of the order of several ion larmor radii and with very di-verse properties (Asano et al., 2005; Petrukovich et al., 2006, 2007; Runov et al., 2006; Nakamura et al., 2006; Baumjo-hann et al., 2007). Though TCS were observed also ear-lier by ISEE-1,2 spacecraft (Mitchell et al., 1990; Pulkki-nen et al., 1993; Sergeev et al., 1993), their occurrence was not quite clear thus far. In majority of cases current den-sity profiles were distinctly different from the classical Har-ris shape (HarHar-ris, 1962) and were categorized as embedded, bifurcated, or asymmetric (Asano et al., 2005; Runov et al., 2006; Nakamura et al., 2006; Thompson et al., 2006). An-other unexpected feature was abundance of strongly tilted (in the YZ GSM plane) sheets with rather variable profiles (Sergeev et al., 2004; Petrukovich et al., 2006), which most likely represent nonstationary structures (Malova et al., 2007; Petrukovich et al., 2008; Zelenyi et al., 2009; Erkaev et al., 2009) and often cannot be explained by motion of the sheet as a whole. A variety of TCS models available now is also quite wide (Kropotkin and Domrin, 1996; Schindler and Birn, 2002; Sitnov et al., 2006; Zelenyi et al., 2004; Yoon and Lui, 2004) (see Sect. 6 for details).
same maximum current density. Current density is practi-cally vanishing at some magnetic fieldBx=B0, which is dis-tinctly smaller, than the lobe field obtained from the pressure balanceBext=
√
8π n (Ti+Te)(temperature and density val-ues are obtained at CS midplane, whereBx=0). Therefore the (background) plasma density is still quite large atBx=B0 and TCS is embedded in a much thicker plasma sheet. Note, that the current density and plasma pressure profiles of Har-ris CS (HarHar-ris, 1962) are identical and B0=Bext, while at Bx=Bext2 current density is still almost 80% of the max-imum. Since a spacecraft is usually crossing TCS in a mat-ter of few minutes (for a thickness of several thousand km and typical flapping velocity of 10-s km/s), and outside it is moving in an almost constant field of a much thicker plasma sheet, observationallyB0 can be also discerned as a maxi-mum of magnetic field in a fast crossing event.
Another important problem of CS structure is a weak cor-relation between current density measured with the help of the curlometer technique (jcurl= c4π
rotB)and that ob-tained from proton flows (Runov et al., 2006; Israelevich et al., 2008). This result (see Sect. 4) contradicts a widespread theoretical assumption that protons are main current carriers and also points out to a presence of some mechanism of cur-rents redistribution.
Using the CS model by Zelenyi et al. (2004), which pro-vides an essential embedding, Artemyev et al. (2008a) have been able to reach an impressing agreement between theoret-ical and observed current density profiles. However, plasma density and temperature, required by the model to fit the ex-perimental profiles were often rather different (by 30%) from the measured ones. In this report we further elaborate this ap-proach, taking into account the structure of ion distribution function.
The paper is organized as follows. In Sect. 2 we describe the data sources and event selection. In Sect. 3 observed elec-tron and proton currents are compared with curlometer data. In Sects. 4–5 ion component of current is analyzed using dis-tribution functions. In Sect. 6 we review the available TCS models and select three of them for a detailed comparison with experiment. In Sect. 7 we perform comparison with these models.
Table 1, ## 2, 5, 9, 12, 15, 21, 22, 28). Finally we added six new events with relatively low current densities and thicker sheet (aka “slow” crossings, Table 1).
All selected events are almost horizontal current sheets with relatively small value of By (By∼BzBext). We built the proper coordinate system for each crossing as: normal vector n (almost parallel to zgsm axis, nz>0.8), vector of maximum variation l (close to X, lx∼1) and vector m=[l×n]. Curlometer current density jcurl= c
4π(m·rotB), as well as the coordinate along the normal z (t )−z0=
t
R
t1 ∂Bl
∂t[∇nBl]−1dt (z0 is location of CS centre andt1 is an initial time moment of crossing) are computed with the help of the standard method (see Runov et al., 2006).
Particle current densityjwas computed as a sum of proton flows, taken from the C-4 and electron flows taken from the C-2, which were interpolated to a common time scale and shifted to allow for different spacecraft positions relative to the magnetic field profile.
3 Comparison between curlometer current density and moments of particle distribution functions
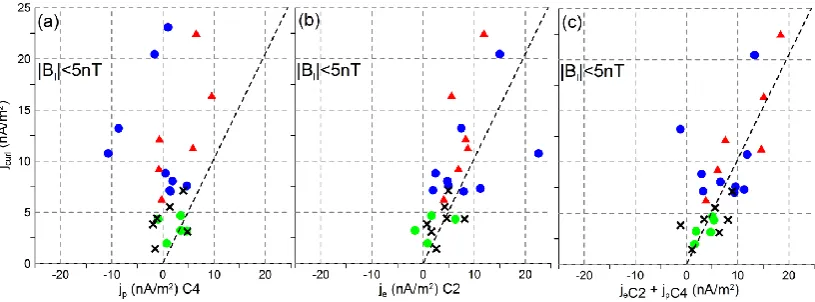
[image:2.595.49.287.99.190.2]Fig. 1. Comparison of current densityjcurlwith proton and electron currents. Current density is averaged over central region of CS
hBlisc<5 nT. Following symbols are used: blue circles -for fast crossings from 2001 and 2004, green circles – for slow crossings from Table 1, red triangles – for fast crossings from 2003 and crosses – for thinning CS. Dashed line corresponds tojparticle=jcurl.
findings for bifurcated CS (Israelevich et al., 2008) and thin CS (Runov et al., 2006). Electron currents are always pos-itive and generally better correspond tojcurl (Fig. 1b), es-pecially for higher current densities. Addition of electron currents practically eliminates the shift to negative values in proton currents and improves correlation withjcurl(Fig. 1c). Despite the general statistical agreement, curlometer and particle currents may differ substantially for some events. Another difficult issue is a balance of electron and proton contributions to current. Though the models described in Sect. 6 have a possibility to manipulate with electron cur-rents, the major component is still expected to be the proton one. Cases with negative or very small proton currents thus can not be now straightforwardly interpreted. Ion bulk ve-locity related to diamagnetic drift and quasi-adiabatic motion should be much larger than electron bulk velocity (in the sys-tem without electric field). To explain the dominant electron current one can use the assumption about particle cross field drift (Asano et al., 2004; Israelevich et al., 2008). It means that coordinate system in which CS does not move has some velocity in negative direction.
Due to small value of such electric field in quiet condi-tions it can not be directly measured. In this case the balance between electron and ion currents could be used for deter-mination of the coordinate system in which the comparison between theory and observation could be carried out. For the detailed analysis we choose in this investigation several events with substantial proton current and good agreement between particle current andjcurl. Therefore we try to ana-lyze the ion velocity distribution structure in the system close to one without a drift (without electric field).
4 Proton currents and distribution functions
In this section we will study the kinetic structure of a proton component of TCS currents. For this purpose we are
choos-ing two crosschoos-ings with substantial proton currents for which full cross-sheet profiles are available (Figs. 2 and 3). The comparison of curlometer current density with the proton and electron currents (averaged over 16 s) is shown in these fig-ures. In addition we also calculate the “partial” proton cur-rent, carried by protons with energies higher thanEmin.
jp = 1 2e
Z
fpsin 2θsinϕdθ dϕ Emax
Z
Emin
EdE (1)
Varying the minimum energy Emin one can determine the relative importance of the core and wings of the velocity dis-tribution. Figures 2 and 3 include such partial current density forEmin∼2
3Tpwith the cold core removed. The curves of partial and total current practically coincide in both events, and therefore the most of the current is carried by hot wings of ion distribution.
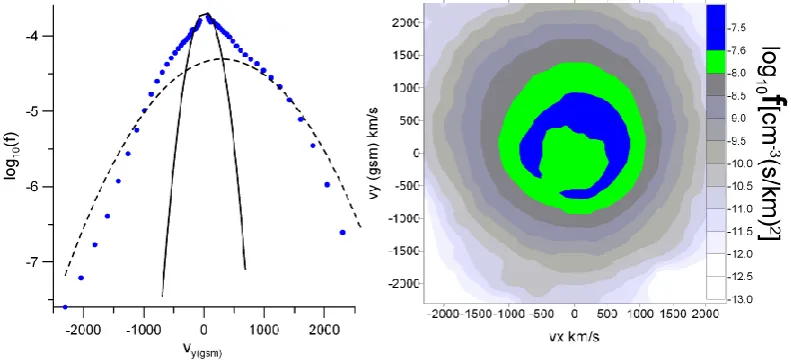
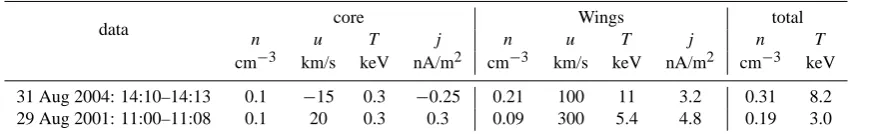
This bimodal structure is further investigated in velocity distributions (Figs. 4 and 5) averaged over the time inter-vals shown in Figs. 2 and 3 by thin vertical lines. The right “wings” of 1-D velocity distributions (Figs. 4a and 5a) are indeed noticeably higher than the left ones and this effect is responsible for the bulk of the current. Such a function cannot be approximated by a single shifted maxwellian dis-tribution, because the shift alongvygrows with the increase of energy (not shown here). This asymmetry is well mani-fested in 2-D distribution (Figs. 4b and 5b) as a broken ring structure. A part of distribution withE<Emin(Emin=5 keV for Fig. 4 andEmin=2 keV for Fig. 5) is removed from these 2-D plots to increase the visibility.
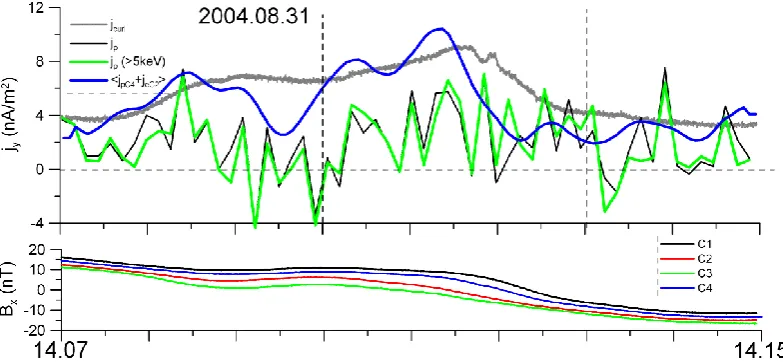
Fig. 2. Crossing of thin CS detected on 31 August 2004. Top panel: curlometer current density (grey curve) compared with particle currents (see text for details). Bottom panel:Bxmagnetic field.
Fig. 3. The same as Fig. 2 but for 8 August 2001.
different sign (for the crossing shown in Fig. 2) . Densi-ties of cold and hot components are comparable. Therefore up to 50–70% of particle density (the whole cold compo-nent) in these cases could be interpreted as another popula-tion of plasma differing from current carriers (here it is called background plasma). Of course, a part of the hotter compo-nent might also belong to background plasma and density of current-carrying particles could be overestimated.
5 Currents of heavy ions and high-energy particles
The real space plasmas may contain several ion species, in particular O+, which can carry current also. Indeed for a current sheet crossing (from 11 September 2002, Fig. 6) with 25% presence of O+, oxygen ions carry a substantial part of current and their velocity distribution has asymmetric
“wings” too (Fig. 7a, b), which are even more pronounced than the proton ones.
[image:4.595.99.495.293.477.2]Fig. 4. Event 31 August 2004. Left: 1-D proton velocity distribution (blue points) and maxwellian approximations for central core (black line), and “wings” (dashed line). Right: 2-D proton velocity distribution obtained by integration alongvz for all particles withE>5 kev. Color scale is selected to highlight asymmetry of distribution wings.
Fig. 5. The same as Fig. 4, but for event 29 August 2001 (cut-off energyE>2 kev for the right plot).
protons have low temperature (Tp∼3 keV) such extrapola-tion practically does not add any addiextrapola-tional current. Substan-tial part of the oxygen current (30%) can also be missed at higher energies (for event 11 September 2002).
6 Models of current sheet
Several important features of observed current sheets should be incorporated in any model, attempting to describe real data. First of all, the models under discussion should be able to reproduce the embedding of current sheets into much broader plasma sheet, so that plasma pressure at CS edges (where current density has sufficiently small value) is still essential. The second crucial feature is a finite normal
[image:5.595.99.495.309.490.2]Fig. 6. Crossing of thin CS detected on 9 September 2002 with oxygen current. Top panel: curlometer current density (grey curve) compared with particle currents (see text for details). Bottom panel:Bxmagnetic field.
Table 2. Parameters of two maxwellians fitted to observed proton velocity distribution.
data core Wings total
n u T j n u T j n T
cm−3 km/s keV nA/m2 cm−3 km/s keV nA/m2 cm−3 keV
31 Aug 2004: 14:10–14:13 0.1 −15 0.3 −0.25 0.21 100 11 3.2 0.31 8.2
29 Aug 2001: 11:00–11:08 0.1 20 0.3 0.3 0.09 300 5.4 4.8 0.19 3.0
balance along XZ-direction. In YL2004 it could be done by introducing a slow gradient along x-coordinate (Kan, 1973; Voronina and Kan, 1993).
The second model that we adopt, is a modification of a thin CS model (Schindler and Birn, 2002 – hereinafter referred to as SB2002), which is constructed using more general class of velocity distributions with specific dependence on the canon-ical moment (see for detail Schindler and Birn, 2002; Birn et al., 2004). The problem of the stress balance in the presence of the finiteBn could be solved again taking into account some spatial gradient alongx. However, if we want to study the 1-D configuration, this gradient can be chosen by hand, so that the value ofBnis equal to the observed one. The ra-tio of electron and proton currents is controlled by the model parameters (see for details Schindler and Birn, 2002). The embedding is achieved by inclusion of the additional term to velocity distribution – the nonshifted maxwelian distribu-tion with densityn00. The ration00n0determines the relative fraction of the background plasma density (this option with n006=0 hereafter is referred to as SB2002*).
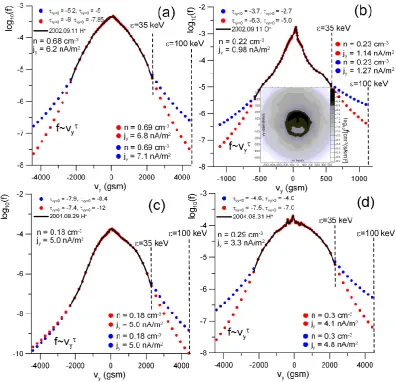
The third model we use is a thin anisotropic CS model (Zelenyi et al., 2004) with electron component (hereafter re-ferred to as TACS). It can be also considered as a general-ization of some earlier models of thin CS (Eastwood, 1972; Kropotkin and Domrin, 1996). The ion component of TACS
was found taking into account conservation of the quasi-adiabatic invariant Iz=
H
vzdz. Such an approach is valid for equilibriums withBn≤0.2B0. Here we assume that CS is thin enough and could assume that equilibrium is exactly 1-D (butBn6=0), so∂Bn
∂x≡0. For the electron component the guiding-center approach was used. The ratio of proton and electron currents can be adjusted by parameterbn=BnB0. TACS embedding is controlled by the ratio of thermal and a flow velocitiesε=vTvDat the edges of CS (Burkhart et al., 1992; Artemyev et al., 2008a).
7 Comparison of observations and models of thin CS
[image:6.595.83.519.317.384.2]Fig. 7. Observed CIS/CODIF ion velocity distribution functions (black curves) with extrapolation obtained by using two (red circles) and five (blue circles) last points. The text on panels includes parameters of extrapolationf∼vy−τ, CIS/CODIF number and current densities, as well as their extrapolated values.
Fig. 8. Comparison of current density profiles for event 31 August 2004.
R2(M)=1−Bext(M).Bext
2
+1−B0(M).B0
2
+1−j0(M).j0
2
+
1−Te(M).Te
2
+
1−n(M)p .np
2
+1−Tp(M).Tp
2
(2) Model parameters are with the superscript(M), experimental parameters – without superscripts. The priority was given to better coincidence of the maximum current density (the value of function1−j0(M).j0
2
Fig. 9. Comparison of current density profiles for event 29 August 2001.
Fig. 10. Comparison of current density profiles for event 31 August 2004. Only current-carrying plasma component is taken (see text for details).
spacecraft separation ∼1000 km (for 2001 and 2004). Ex-perimental curlometer profiles as a function of spatial coor-dinate are built as explained in Sect. 2 and paper by Runov et al. (2006). Input parameters of the models are: proton temperature, electron temperature, andB0. We use parame-terBzB0as input only for TACS model, because in YL2004 and SB2002 models value ofBzis controlled only by a spa-tial gradient ∂
∂x, which can not be determined from our observations. Model plasma density was determined using the pressure balance. Model profiles of current density were obtained self-consistently. Input parameters of the models were varied in the vicinity of experimental ones to achieve a better coincidence of theoretical current density profiles with observations (see Artemyev et al., 2008a, for details).
The model and observed current density profiles as func-tions of spatial coordinate and magnetic field are shown in Figs. 8 and 9 for two crossings described in Sect. 5. All three models used for the comparison approximate observed pro-files reasonably well. However, comparison between model
Fig. 11. Velocity distribution of protons for models of CS. The color scale highlights asymmetry of hot wings. Black circles mark energy 5 keV.
and experimental parameters (density, temperature,B0,Bext and estimate of CS thicknessL0∼ c4π
B0j0, Tables 3 and 4) reveals certain differences between the models. Both experimental crossings are approximated equally well only by YL2004, which has free parameterδ(ratio of background and current-carrying plasma densities). Usingδ one can ad-just easily the value BextB0. TACS model has also the possibility to regulate the value ofBext
B0with the help of parameterε, but this mechanism is not so flexible, because εaffects CS thickness as well. Nevertheless, TACS model describes observations with only 30% error (see Artemyev et al., 2008a, for more examples). The worst is the model SB2002, which can not regulate embedding and plasma den-sity in SB2002 model is substantially smaller than the ob-served one.
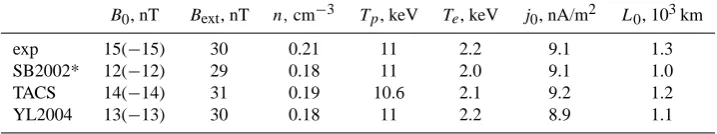
Now we continue comparison of YL2004, TACS and SB2002* models for one observation (event 31 August 2004), but will use only plasma density and temperature of current-carrying plasma (hot wings, from Table 2) as an in-put (Fig. 10, to be compared with Fig. 8). All three models again approximate observations reasonably well. Note that the pressure of excluded cold plasma is less than 10% of the total one and thus removing of this part practically does not change static balance. But now model and observed plasma parameters are practically equal (Table 5, to be compared with Table 3). Here SB2002* model, allowing the embed-ding was used in this comparison instead of SB2002.
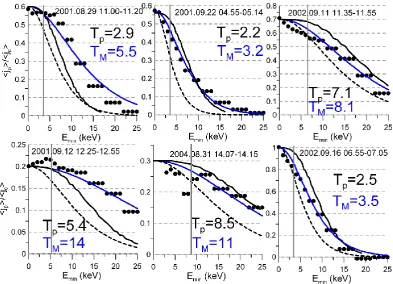
[image:8.595.50.287.268.416.2]Fig. 12. Observed ratiojphjcurlias a function of minimum integration energy for six events (black points). The expected ratio for a
single maxwellian distribution with the observed temperatureTp(dashed curve). The expected ratio for distribution from TACS model with temperatureTp(black curve). The best fit maxwelian distribution with temperatureTM (grey curve).
Table 3. Comparison with models for event 31 August 2004.
B0, nT Bext,nT n, cm−3 Tp, keV Te, keV j0, nA/m2 L0, 103km
exp 15(−15) 35 0.31 8.2 2.2 9.1 1.3
SB2002 13(−13) 17 0.09 6.0 1.5 9.1 1.1
TACS 13(−13) 25 0.12 6.4 1.6 8.5 1.2
YL2004 13(−13) 32 0.25 8.0 2.0 9.3 1.1
asymmetric “wings”, carrying the bulk of the current. The central region of the model velocity space generally could be filled by the background plasma (in the case of approxima-tion of CS as a whole with background) or could be empty (in a case of approximation of current carriers only). All three models used above have such hot asymmetric “wings”. The model distribution functions are presented in Fig. 11. The central region (hereE<5 keV, shown with black circles) could be cut out without substantial current density decrease. Finally we confirm our conclusions by the analysis of pro-ton distribution functions obtained during several crossings (including two described above) with a substantial proton current (two cases have been chosen from a set of thinning CS and other two – from the Table 1). For each event the ratio
jp
hjcurliwas computed as a function of a low limit of
inte-gration energyEmin(Fig. 12, dotted curves) (velocity distri-bution functions were averaged over the central sheet where hBlisc<5 nT). Observed proton temperaturesTpare shown by thin vertical lines and printed at each panel. Indeed, proton current density does not decrease substantially, until Emin<Tp in agreement with the presence of a hot current-carrying component. Further we attempted to approximate the observedjp
[image:9.595.120.474.436.504.2]
B0, nT Bext, nT n,cm Tp, keV Te, keV j0, nA/m L0, 10 km
exp 15(−15) 30 0.21 11 2.2 9.1 1.3
SB2002* 12(−12) 29 0.18 11 2.0 9.1 1.0
TACS 14(−14) 31 0.19 10.6 2.1 9.2 1.2
YL2004 13(−13) 30 0.18 11 2.2 8.9 1.1
can conclude that the current is formed either by hot shifted maxwelian distribution with the temperature larger than the observed one or by protons with the complex velocity distri-bution structure (like in TACS model).
8 Discussion
With the comprehensive Cluster multi-point measurements of magnetic field, ion and electron moments and ion distri-bution functions in the magnetotail, we performed a detailed comparison of embedded current sheets with several typical theoretical models. Only horizontal thin current sheets ob-served in quiet conditions with single peaked current density profiles well resolved by curlometer were used in the analy-sis.
The embedding of thin intense current sheets in a much wider plasma sheet with much smaller current density was confirmed by ion distribution function analysis. The cur-rent is transported mainly by hot wings of proton distribu-tion funcdistribu-tion (in Cluster case, measured by CIS/CODIF up to 40 keV). A smaller part of the current could be transported by protons above 40 keV (in case of higher temperature) and/or oxygen ions. Cold ions (with energy is roughly about 1 keV) do not carry noticeable current and thus form the plasma pop-ulation probably belonging to the embedding plasma sheet. The scale of this plasma sheet is supposed to be much larger than the typical CLUSTER separation and therefore corre-sponding magnetic gradients are generally not well resolved by the spacecraft tetrahedron.
Ion distribution functions were often studied for active events with bursty bulk flows (Nakamura et al., 1991; Raj et al., 2002), as well as generally in the plasma sheet or PSBL (Eastman et al., 1984; Elphic and Gary, 1990).
How-ever such specific analysis in TCS has not been carried out so far. Recently Zhou et al. (2009) reported about similar fea-tures in the structure of ion distribution function, observed by THEMIS.
Taking for comparison only current-carrying component of proton distribution functions helps to improve substan-tially the degree of conformity between of experimental and theoretical profiles and plasma moments. All three models used (SB2002*, YL2004, TACS) have almost an equally good agreement with analyzed CLUSTER observa-tions. However, it should be mentioned that two models discussed above (SB2002*, YL2004) require a finite gradi-ent∂∂x6=0 to support finiteBz6=0. In this paper we ana-lyzed only the vertical cuts of the model plasma configura-tions (i.e. forx=const). And therefore to prove the model applicability in the vicinity of observed CS one needs also to make an additional comparison of∂∂xandBz, which is currently impossible with available dataset. TACS model as-sumes∂∂x∼0 and if the observed CS is thin and stretched enough (∂
∂xBzB0∂∂z)the model is valid in some do-main along the Sun-Earth line (x-direction).
However for CLUSTER with its relatively small satellite separation measurements of gradients in x-direction will not be of any practical use. For such quasi 1-D configurations the models differ only in modifications of particle distribu-tion funcdistribu-tion. However since the distribudistribu-tion of the current-carrying protons can not be clearly separated from the plasma population, which does not carried any current, it’s properties like anisotropy and non-gyrotropy are hard to resolve in the experimental data. In particular Cully et al. (2006) reported about absence of specific anisotropy of plasma pressure (pre-dicted by TACS) in CLUSTER data.
[image:10.595.121.474.89.157.2] [image:10.595.117.476.210.277.2]bility due to increasing free energy of CS (Zelenyi et al., 2008; Zelenyi et al., 2009, and references therein). For the kink instability in Harris CS Karimabadi et al. (2003) have shown that growth rate increases and real part of frequency decreases with addition of background plasmas. Similar re-sult has been obtained for TACS model (Artemyev et al., 2008b). Therefore observations of CS oscillations (Sergeev et al., 2004; Petrukovich et al., 2006) with frequencies much lower than theoretical predictions for CS without any ground could be related right with the presence of back-ground plasma.
Finally we want to make one more substantial remark for a future study. In many experimental cases electron current dominates over proton current. However, in the models elec-tron properties are substantially less restricted by observable parameters, than the proton ones. Therefore for the analy-sis of embedding presented above we have taken only sheets with substantial proton currents. The problem of electron currents needs it is own study.
Comparison between current density determined with the help of curlometer technique and that computed as a sum of proton and electron flows shows the general agreement of two quantities, both for the statistics of averaged val-ues and for the time profiles for specific cases. How-ever, in agreement with the previous investigations jcurl and proton current are only weakly correlated (Runov et al., 2006; Israelevich et al., 2008). One could conclude that there exists some mechanism of decreasing proton cur-rent and increasing electron one, while preserving the to-tal current. This mechanism might be quite different from the mechanisms of the total current formation. The lat-ter can be due to pressure gradientjDM∼dpdz, paramag-netic effect of open trajectories of “Speiser” ions, as well as due to gradient driftsjGR∼dBldz. On the other hand the general eastward plasma drift withv0velocity decrease proton current (jp→jp−enpv0)and increase electron one (je→je+enpv0), keeping total current unchanged.
The velocity −v0ey of plasma could be supported by Ez=− v0cB2Bxor byEx= v0cB2Bz.Ezis taken into account by many CS models. In case of absence of nor-mal magnetic fieldBzone can use the balance between ion and electron current to determine the Ez (see for example
1-D or quasi 1-D equilibriums. However, such field with the correct sign (Earthward pointing) was detected in the labora-tory experiment (Minami et al., 1993). Also some estimates ofExhave been done by taking into account averaged parti-cle bulk velocity with connection CS evolution around sub-storm onset (Asano et al., 2004).
9 Conclusions
Thin quiet horizontal current sheets, observed by Cluster are shown to be essentially embedded in a much thicker plasma sheet and thus could be considered as a special plasma con-figuration. In consistency with the embedding of electric current, ion velocity distributions in CS contain two parts: cold non-drifting core, likely belonging to the plasma sheet background and hot asymmetric “wings”, carrying the cur-rent. Density of these current-carrying particles could be substantially smaller than total plasma density. A number of models, having sufficient flexibility to incorporate the em-bedding, could conform with observations with similar ac-curacy. To make further distinction of models one needs to measure∂∂xgradient in the current sheet or to reveal de-tails in velocity distribution of current carriers. For YL2004 and SB2002 models gradient ∂∂x should have specified values to match the experiment, while for TACS model the only requirement is that the gradient∂∂xshould be small enough.
In the future electron currents need to be studied in more detail, to explain that the ratio of electron and proton currents could differ very significantly from case to case, while mod-els usually predict the dominance of ion current. One such candidate mechanism might be an electric field drift in the direction opposite to direction of total current.
Physics Report, 34(9), 771–779, 2008b.
Asano, Y., Mukai, T., Hoshino, M., Saito, Y., Hayakawa, H., and Nagai, T.: Statistical study of thin current sheet evolu-tion around substorm onset, J. Geophys. Res., 109, A05213, doi:10.1029/2004JA010413, 2004.
Asano, Y., Nakamura, R., Baumjohann, W., Runov, A., Voros, Z., Volwerk, M., Zhang, T. L., Balogh, A., Klecker, B., and Reme, H.: How typical are atypical current sheets?, Geophys. Res. Lett., 32(3), L03108, doi:10.1029/2004GL021834, 2005.
Balogh, A., Carr, C. M., Acu˜na, M. H., Dunlop, M. W., Beek, T. J., Brown, P., Fornacon, H., Georgescu, E., Glassmeier, K.-H., Harris, J., Musmann, G., Oddy, T., and Schwingenschuh, K.: The Cluster Magnetic Field Investigation: overview of in-flight performance and initial results, Ann. Geophys., 19, 1207–1217, 2001,
http://www.ann-geophys.net/19/1207/2001/.
Baumjohann, W., Roux, A., Le Contel, O., Nakamura, R., Birn, J., Hoshino, M., Lui, A. T. Y., Owen, C. J., Sauvaud, J.-A., Vaivads, A., Fontaine, D., and Runov, A.: Dynamics of thin current sheets: Cluster observations, Ann. Geophys., 25, 1365–1389, 2007, http://www.ann-geophys.net/25/1365/2007/.
Birn, J., Schindler, K., and Hesse, M.: Thin electron current sheets and their relation to auroral potentials, J. Geophys. Res., 109(A2), A02217, doi:10.1029/2003JA010303, 2004.
Buechner, J. and Zelenyi, L. M.: Regular and chaotic charged par-ticle motion in magnetotaillike field reversals 1. Basic theory of trapped motion, J. Geophys. Res., 94(A9), 11812–11842, 1989. Burkhart, G. R., Drake, J. F., Dusenbery, P. B., and Speiser, T. W.:
A particle model for magnetotail neutral sheet equilibria, J. Geo-phys. Res., 97(A9), 13799–13815, 1992.
Christon, S. P., Williams, D. J., Mitchell, D. G., Frank, L. A., and Huang, C. Y.: Spectral characteristics of plasma sheet ion and electron populations during undisturbed geomagnetic conditions, J. Geophys. Res., 94, 13409–13424, 1989.
Cully, C. M., Ergun, R. E., Lucek, E., Eriksson, A., Baker, D. N., and Mouikis, C.: Forced current sheets in a flapping magnetotail, Int. Conf. Substorms, 8, 43–48, 2006.
Eastman, E. T., Frank, L. A., Peterson, W. K., and Lennartsson, W.: The plasma sheet boundary layer, J. Geophys. Res., 89(A3), 1553–1572, 1984.
Eastwood, J. W.: Consistency of fields and particle motion in the ‘Speiser’ model of the current sheet, Planet. Space Sci., 20, 1555–1568, 1972.
Elphic, E. C. and Gary, S. P.: ISEE observation of low frequency waves and ion distribution function evolution in the plasma sheet boundary layer, Geophys. Res. Lett., 17(11), 2023–2026, 1990.
Israelevich, P. L., Ershkovich, A. I., and Oran, R.: Current car-riers in the bifurcated tail current sheet: Ions or electrons?, J. Geophys. Res., 113(A4), A04215, doi:10.1029/2007JA012541, 2008.
Kan, J. R.: On the structure of the magnetotail current sheet, J. Geophys. Res., 78, 3773–3781, 1973.
Karimabadi, H., Daughton, W., Pritchett, P. L., and Krauss-Varban, D.: Ion-ion kink instability in the magneto-tail: 1. Linear theory, J. Geophys. Res., 108(A11), 1400, doi:10.1029/2003JA010026, 2003.
Kropotkin, A. P. and Domrin, V. I.: Theory of a thin one-dimensional current sheet in collisionless space plasma, J. Geo-phys. Res., 101(A9), 19893–19902, 1996.
Malova, H. V., Zelenyi, L. M., Popov, V. Y., Delcourt, D. C., Petrukovich, A. A., and Runov, A. V.: Asymmetric thin cur-rent sheets in the Earth’s magnetotail, Geophys. Res. Lett., 34, L16108, doi:10.1029/2007GL030011, 2007.
Minami, S., Podgornyi, A. I., and Podgornyi, I. M.: Laboratory evi-dence of earthward electric field in the magnetotail current sheet, Geophys. Res. Lett., 20(1), 9–12, 1993.
Mitchell, D. G., Williams, G. J., Huang, C. Y., Frank, L. A., and Russell, C. T.: Current carriers in the near-Earth cross-tail current sheet during substorm growth phase, Geophys. Res. Lett., 17, 583–586, 1990.
Nakamura, M., Paschmann, G., Baumjohann, W., and Sckopke, N.: Ion distribution and flows near the neutral sheet, J. Geophys. Res., 96(A4), 5631–5649, 1991.
Nakamura, R., Baumjohann, W., Runov, A., and Asano, Y.: Thin current sheets in the magnetotail observed by Cluster, Space Sci. Rev., 122, 29–38, 2006.
Owen, C. J., Fazakerley, A. N., Carter, P. J., Coates, A. J., Krauk-lis, I. C., Szita, S., Taylor, M. G. G. T., Travnicek, P., Wat-son, G., WilWat-son, R. J., Balogh, A., and Dunlop, M. W.: Clus-ter PEACE observations of electrons during magnetospheric flux transfer events, Ann. Geophys., 19, 1509–1522, 2001,
http://www.ann-geophys.net/19/1509/2001/.
R`eme, H., Aoustin, C., Bosqued, J. M., et al.: First multispacecraft ion measurements in and near the Earths magnetosphere with the identical Cluster ion spectrometry (CIS) experiment, Ann. Geo-phys., 19, 1303–1354, 2001,
http://www.ann-geophys.net/19/1303/2001/.
the near Earth plasma sheet, J. Geophys. Res., 107, 1419, doi:10.1029/2001JA007547, 2002.
Runov, A., Nakamura, R., Baumjohann, W., Zhang, T. L., Volw-erk, M., Eichelberger, H.-U., and Balogh, A.: Cluster observa-tion of a bifurcated current sheet, Geophys. Res. Lett., 30, 1036, doi:10.1029/2002GL016136, 2003.
Runov, A., Sergeev, V. A., Nakamura, R., Baumjohann, W., Ap-atenkov, S., Asano, Y., Takada, T., Volwerk, M., V¨or¨os, Z., Zhang, T. L., Sauvaud, J.-A., R`eme, H., and Balogh, A.: Local structure of the magnetotail current sheet: 2001 Cluster observa-tions, Ann. Geophys., 24, 247–262, 2006,
http://www.ann-geophys.net/24/247/2006/.
Schindler, K. and Birn, J.: Model of two-dimensional embed-ded thin current sheets from Vlasov theory, J. Geophys. Res., 107(A8), 1193, doi:10.1029/2001JA000304, 2002.
Sergeev, V. A., Mitchell, D. G., Russell, C. T., and Williams, D. J.: Structure of the tail plasma/current sheet at 11 Re and its changes in the course of a substorm. J. Geophys. Res., 98, 17345–17365, 1993.
Sergeev, V., Runov, A., Baumjohann, W., Nakamura, R., Zhang, T. L., Volwerk, M., Balogh, A., Reme, H., Sauvaud, J. A., An-dre, M., and Klecker, B.: Current sheet flapping motion and structure observed by Cluster, Geophys. Res. Lett., 30(6), 1327, doi:10.1029/2002GL016500, 2003.
Sergeev, V., Runov, A., Baumjohann, W., Nakamura, R., Zhang, T. L., Balogh, A., Louarnd, P., Sauvaud, J.-A., and Reme, H.: Ori-entation and propagation of current sheet oscillations, Geophys. Res. Lett., 31(5), L05807, doi:10.1029/2003GL019346, 2004. Sitnov, M. I., Swisdak, M., Guzdar, P. N., and Runov, A.: Structure
and dynamics of a new class of thin current sheets, J. Geophys. Res., 111(A8), A08204, doi:10.1029/2005JA011517, 2006.
sheet model withκdistribution, Phys. Plasmas, 13(10), 102108– 102108-6, 2006.
Zelenyi, L. M. and Krasnoselskikh, V. V.: Relativistic Modes of Tearing Instability in a Background Plasma, Soviet Astronomy (tr. Astr. Zhurn.), 23, 460–467, 1979.
Zelenyi, L. M., Delcourt, D. C., Malova, H. V., and Sharma, A. S.: “Aging” of the magnetotail thin current sheets, Geophys. Res. Lett., 29(12), L05105, doi:10.1029/2001GL013789, 2002. Zelenyi, L. M., Malova, H. V., Popov, V. Yu., Delcourt, D., and
Sharma, A. S.: Nonlinear equilibrium structure of thin currents sheets: influence of electron pressure anisotropy, Nonlin. Pro-cesses Geophys., 11, 579–587, 2004,
http://www.nonlin-processes-geophys.net/11/579/2004/. Zelenyi, L., Artemyev, A., Malova, H., and Popov, V.: Marginal
sta-bility of thin current sheets in the Earth’s magnetotail, J. Atmos. Solar-Terr. Phys., 70, 325–333, 2008.
Zelenyi, L. M., Artemyev, A. V., Petrukovich, A. A., Nakamura, R., Malova, H. V., and Popov, V. Y.: Low frequency eigenmodes of thin anisotropic current sheets and Cluster observations, Ann. Geophys., 27, 861–868, 2009,
http://www.ann-geophys.net/27/861/2009/.