© Author(s) 2009. This work is distributed under the Creative Commons Attribution 3.0 License.
Forest floor carbon exchange of a boreal black spruce forest in
eastern North America
O. Bergeron1,*, H. A. Margolis1, and C. Coursolle1
1Centre d’´etude de la forˆet, Facult´e de foresterie, de g´eographie et de g´eomatique, Universit´e Laval, Qu´ebec, Qu´ebec, Canada *now at: Department of Natural Resource Sciences, McGill University, Montr´eal, Qu´ebec, Canada
Received: 14 April 2009 – Published in Biogeosciences Discuss.: 5 June 2009 Revised: 10 August 2009 – Accepted: 15 August 2009 – Published: 2 September 2009
Abstract. This study reports continuous automated mea-surements of forest floor carbon (C) exchange over feather-moss, lichen, and sphagnum micro-sites in a black spruce forest in eastern North America during snow-free periods over three years. The response of soil respiration (Rs-auto) and forest floor photosynthesis (Pff) to environmental fac-tors was determined. The seasonal contributions of scaled upRs-autoadjusted for spatial representativeness (Rs-adj) and
Pff (Pff-eco) relative to that of total ecosystem respiration (Re) and photosynthesis (Peco), respectively, were also quan-tified.
Shallow (5 cm) soil temperature explained 67–86% of the variation inRs-autofor all ground cover types, while deeper (50 and 100 cm) soil temperatures were related to Rs-auto only for the feathermoss micro-sites. Base respiration was consistently lower under feathermoss, intermediate under sphagnum, and higher under lichen during all three years. The Rs-adj/Re ratio increased from spring through autumn and ranged from 0.85 to 0.87 annually for the snow-free pe-riod. TheRs-adj/Reratio was negatively correlated with the difference between air and shallow soil temperature and this correlation was more pronounced in autumn than summer and spring.
Maximum photosynthetic capacity of the for-est floor (Pffmax) saturated at low irradiance levels (∼200µmol m−2s−1) and decreased with increasing air temperature and vapor pressure deficit for all three ground cover types, suggesting that Pff was more limited by desiccation than by light availability. Pffmax was lowest for sphagnum, intermediate for feathermoss, and highest for lichen for two of the three years. Pff normalized for light
Correspondence to: O. Bergeron (onil.bergeron@mcgill.ca)
peaked at air temperatures of 5–8◦C, suggesting that this is the optimal temperature range for Pff. The Pff-eco/Peco ratio varied from 13 to 24% over the snow-free period and reached a minimum in mid-summer when both air temperature andPecowere at their maximum. On an annual basis,Pff-eco accounted for 17–18% ofPecodepending on the year and the snow-free season totals of Pff-eco were 23–24% that ofRs-adj.
1 Introduction
Total ecosystem respiration (Re)is a major determinant of the carbon (C) balance of northern forests (e.g. Valentini et al., 2000). Re includes respiration by above-ground plant parts (stems, branches, twigs, and leaves) and soil. Soil respi-ration (Rs)is a dominant component of C exchange in boreal ecosystems, accounting for at least half ofRe (Black et al., 2005). The temporal variability of respiratory metabolism is influenced mostly by temperature and humidity condi-tions (Davidson et al., 1998; Gaumont-Guay et al., 2006a). Above- and below-ground processes contributing toRe can respond in different ways to the seasonal variation of air and soil temperature, to the availability of water and to substrate type (Davidson et al., 2006b; Jassal et al., 2007).
(Swanson and Flanagan, 2001; Kolari et al., 2006; Tupek et al., 2008) and also on the composition and relative pres-ence of different forest floor communities in the ecosystem (O’Connell et al., 2003; Heijmans et al., 2004).
The boreal forest of eastern North America is subjected to climatic conditions that differ significantly from those of other boreal regions in North America and Eurasia. For ex-ample, precipitation is generally more abundant in this re-gion than in central Canada, while air temperatures are much cooler than in boreal Scandinavia. Also, the markedly dif-ferent latitudes of boreal forests in Scandinavia and Canada lead to different light regimes in regards to both photoperiod and intensity. Such differences in climatic conditions influ-ence the C exchange of boreal forest ecosystems (Bergeron et al., 2007). Furthermore, climate change is expected to have different regional consequences in northern forests (Flanni-gan et al., 2001; Heimann and Reichstein, 2008). Thus, it is important to characterize the response of C exchange to en-vironmental conditions in the eastern Canadian region of the circumpolar boreal forest.
Information on the seasonal contribution of soil respiration to ecosystem respiration is still very limited (e.g., Davidson et al., 2006b) since values have been primarily reported on an annual or growing season basis (e.g., Lavigne et al., 1997; Law et al., 1999; Janssens et al., 2001; Gaumont-Guay et al., 2006b). Furthermore, there is apparently little informa-tion available for the vast area of cool humid boreal forest that is characteristic of eastern North America. On the other hand, photosynthesis of the moss stratum has been studied in different ecosystems (e.g., Swanson and Flanagan, 2001; Heijmans et al., 2004; Botting and Fredeen, 2006; Kolari et al., 2006). However, the extent to which it might contribute to the interannual variability in gross ecosystem productivity has apparently not been studied for boreal forests of eastern North America. Moreover, the relative contribution of differ-ent boreal micro-sites (sphagnum, feathermoss, lichen) has not been well explored. Such information is important for partitioning the different C sinks within an ecosystem and characterizing their specific response to environmental con-ditions.
Numerous automated chamber systems have been devel-oped to produce continuous measurements that help gain insight into the seasonal variability of soil respiration and forest floor photosynthesis (e.g., Goulden and Crill, 1997; Pumpanen et al., 2001; Gaumont-Guay et al., 2008). Cou-pling automated chamber measurements with eddy covari-ance (EC) measurements can provide valuable information on the concomitant response of respiratory and photosyn-thetic processes of different ecosystem components to envi-ronmental variables at fine time scales. However, due to lo-gistical and equipment constraints, automated chamber sys-tems are typically confined to a small portion of the footprint measured by an EC tower. This can lead to a mismatch in the source area, resulting in an apparent discrepancy between measurement methods (Drewitt et al., 2002). This source of
error can be controlled by assessing the spatial representa-tiveness of soil respiration using a portable manual chamber system (Savage and Davidson, 2003) and by limiting ecosys-tem C exchange estimates to specific sectors of the tower footprint (e.g., Yuste et al., 2005).
This study presents continuous automated measurements of ecosystem and forest floor CO2exchange for the snow-free period over three years in a boreal black spruce forest ecosystem in eastern North America. The objectives of this study were to (1) quantify the relationship of soil respira-tion and photosynthesis of different forest floor micro-sites (sphagnum, feathermoss and lichen) to environmental factors and (2) contrast the seasonal contribution of soil respiration and forest floor photosynthesis to that of the entire ecosys-tem. The spatial representativeness of automated soil res-piration measurements in the tower footprint area was also assessed.
2 Methods
2.1 Site description
Our study site (Eastern Old Black Spruce, EOBS; 49.692◦N, 74.342◦W) lies in the commercial boreal forest of Canada and is located about 30 km south of Chibougamau, QC. The study site corresponds to a 500 m radius centered on the tower where at least 90% of the flux footprint originates (Bergeron et al., 2007). Black spruce (Picea mariana) domi-nates the site and there are sparse jack pine (Pinus banksiana) and tamarack (Larix laricinia). The shrub stratum is com-prised of sheep laurel (Kalmia angustifolia) and Labrador tea (Rhododendron groenlandicum) on dry micro-sites and alder (Alnus rugosa) on wet micro-sites. The forest floor is covered by feathermoss (Hylcomnium splendens, Pleurozium schreberi), sphagnum (Sphagnum spp.), and lichen (Cladina spp.; see Table 1). Most of the study area originates from fire disturbance that occurred between 1885 and 1915. EOBS is dominated by podzol soils with 15–40 cm organic layers ly-ing on silty-sand parent material. Mean tree height is 13.8 m, mean DBH is 12.7 cm, tree density is 4490 stems ha−1, black spruce basal area is 22.8 m2m−2, and hemispherical LAI is 3.7 m2m−2. The 30-year average of mean annual temper-ature and total annual precipitation measured at the near-est weather station (15 km NW of the site) are 0.0◦C and 961.3 mm, respectively. Additional details can be found in Bergeron et al. (2007).
2.2 Automated measurements of forest floor CO2 exchange
Table 1. Sector characteristics and number of manual measurement points by sector.
Azimuth angles Cover
Sector from the tower type Feathermoss Lichen Sphagnum Other
Proportion of ground cover (%) % of total study area
S 150–205◦ 73 (81) 8 (9) 8 (9) 11 (0) 15 SW 205–257◦ 70 (80) 2 (2) 16 (18) 13 (0) 14 NW 257–322◦ 69 (76) 3 (4) 19 (20) 9 (0) 18 All 150–322◦ 70 (79) 5 (5) 14 (16) 11 (0) 48 Number of measurement points Total
S 150–205◦ 8 3 1 3 15
SW 205–257◦ 6 4 2 4 16
NW 257–322◦ 9 1 2 2 14
All 150–322◦ 23 8 5 9 45
Number in brackets corresponds to the proportion of ground cover excluding the category Other.
the Biometeorology and Soil Physics Group (University of British Columbia, Vancouver, BC, Canada; see Gaumont-Guay et al., 2008 for a complete description). The system is comprised of three temperature-controlled housings enclos-ing data loggenclos-ing, pumpenclos-ing and gas measurement equipment, as well as 6 to 9 chambers. The chambers are made of a clear acrylic dome fixed with a hinge to a 13-cm high PVC collar inserted 8–12 cm in the forest floor. The chambers are about 50 L in volume and cover an area of 0.216 m2. A 50-cm long venting tube is inserted into the top of each cham-ber to allow pressure equalisation. A pneumatic system con-trols the opening and closing of the chambers. All chambers are deployed in a 15 m radius around the main equipment stand which is located about 80 m south of the flux tower. In June 2004, a total of six chambers were installed on feath-ermoss (3 chambers), lichen (2), and sphagnum (1). In June 2005, three more chambers were set up on feathermoss (2) and sphagnum (1). Shrubs were excluded from the collars.
At the time of measurement, chambers were closed for 2.5 min or 3 min (when 6 or 9 chambers were in use, re-spectively), otherwise the chamber stayed in the open posi-tion (83 or 92% of the time based on a 15 or 30 min cycle, respectively). Air was sequentially circulated at 9 L min−1 through ∼35 m of tubing (Synflex 1300, 4.0 mm Internal Diameter, Saint-Gobain Performance Plastics, Wayne, NJ, USA) between the chambers and an infrared gas analyser (IRGA) (model LI-6262, LI-COR Inc., Lincoln, NE, USA). The IRGA was calibrated daily using the same procedure as the EC system (see below). Data were sampled at 1 Hz and averaged every 5 s.
Soil CO2efflux (Fcs)was calculated on a half-hour basis using the equation:
Fcs=ρa
Ve
A dsc
dt , (1)
whereρais the density of dry air in the chamber headspace (mol m−3),Vethe effective volume of the chamber (m3),A the area of ground covered by the chamber (m2)and dsc/dt the time rate of change of the CO2mixing ratio in the cham-ber head space over a 60-s interval beginning 5–7 s follow-ing lid closure (mol CO2mol−1dry air s−1). Ve was esti-mated daily using the dilution technique described in detail in Drewitt et al. (2002) and Gaumont-Guay et al. (2006a). A 5-day running mean with a one-day increment was computed forVeto minimize day-to-day variation. MultipleFcs mea-surements performed in the same half-hour were averaged. 2.3 Manual soil respiration measurements
actual chamber volume during post-processing. The whole measurement sequence was completed within 10 minutes at each location. Measurements were made between 09:00 and 20:00 (LT) during one single day and measurements began at a different location for each measurement date in a latin square fashion as suggested by Davidson et al. (2002). 2.4 Ecosystem CO2flux measurements
CO2 flux at the ecosystem level was measured half-hourly following the EC technique as described in detail in Berg-eron et al. (2007). A closed-path IRGA (model LI-7000, LI-COR Inc.) enclosed in a thermostatic box (37.5±0.5◦C) was coupled to a 3-D sonic anemometer-thermometer (model CSAT3, Campbell Scientific Canada corp. (CSC), Edmon-ton, AB, Canada) to make 10 Hz measurements of CO2 con-centration and vertical wind velocity at a height of 24 m. The IRGA was calibrated daily by injecting dry, CO2free nitro-gen and an air/CO2 gas mixture with a CO2 concentration of approximately 370 ppm (0.001 ppm precision, traceable to NOAA/CMDL standards). Net ecosystem exchange was computed as the sum of CO2flux at the ecosystem level and CO2 storage in the air column below the EC sensors mea-sured with a 5-height profile system.
2.5 Ancillary climate measurements
Air temperature (Ta)and vapour pressure deficit (VPD) were measured at a height of 24 m with a shielded thermistor and humidity sensor (model HMP45C, CSC). Soil temperature at 5 (Ts5 cm), 50 (Ts50 cm)and 100 cm (Ts100 cm)and soil wa-ter content at 5 cm (SWC) below the active moss layer were measured in two soil pits using thermistors (model 107, CSC) and reflectometers (model CS616, CSC), respectively. The two soil pits were located on different micro-sites, the first one under a relatively closed canopy with feathermoss cov-ering the ground surface, the second one under a relatively open canopy with lichens on the ground surface. Photo-synthetically active radiation was measured with quantum sensors (model LI-190SB, LI-COR Inc.) at a 24-m height (PAR24 m)on the tower and∼30 cm above the forest floor (PAR30 cm)beside (<50 cm away) seven of the nine cham-bers. Three chambers were located within a 2-m radius and shared the same quantum sensor. Wind direction was moni-tored at a 24 m height with a wind monitor (Model 05103-10, RM Young, Traverse City, MI, USA).
2.6 Data analysis
For each chamber of the automated system, soil respiration (Rs-auto)and photosynthesis of the forest floor (Pff)were calculated for the snow-free season using a modified version of the Fluxnet-Canada Research Network (FCRN) standard partitioning and gap-filling algorithm described in detail in Barr et al. (2004). In our study, soil respiration refers to CO2
efflux from autotrophic and heterotrophic respiration origi-nating from below-ground as well as autotrophic respiration from ground cover plants.
First, an exponential temperature function (Eq. 2) was fit to nighttime (mean chamber PAR30 cm<5µmol m−2s−1)Fcs data to estimate daytime and missing half-hourlyRs-autoas follows:
Rs-auto=R10Q(T10s5 cm−10)/10 (2) ln(Rs-auto)=A+BTs5 cm (3) whereQ10 (=exp(10B))is a temperature sensitivity coeffi-cient andR10(=Q10exp(A))is base soil respiration at 10◦C (µmol m−2s−1). A time varying factor was calculated as the regression slope between measured and predicted values using a moving window (100 good measurement points, in-crement of 20) to adjust for any seasonal variability of the temperature response ofRs-auto. Ts5 cm measured in the soil pit under feathermoss served to estimate daytimeRs-autoof chambers installed on feathermoss or sphagnum, whileTs5 cm measured in the lichen soil pit was used for automated cham-bers over lichens. The response ofRs-autotoTs5 cmwas char-acterized using a log transformedQ10 function (Eq. 3) as presented by Morgenstern et al. (2004). The transformation provides homoscedasticity to perform linear least squares gression. Equation (3) was also used to characterize the re-sponse ofRs-autotoTs5 cm, calculateRs-autonormalized for soil temperature (Rs-auto/Rs-auto (Ts5 cm)) and to assess the influence ofTa,Ts-50 cm and SWC onRs-auto. In all cases, only nighttime non gap-filled measurements were used.
Pff was then calculated as daytimeFcs–Rs-autofor each chamber. ThePff record was gap filled using a rectangular hyperbola function:
Pff =
αPffmaxPAR30 cm
αPAR30 cm+Pffmax
(4) whereα is the apparent quantum yield andPffmax is the horizontal asymptotic value ofPff. As forRs-auto, a time varying adjustment factor (moving window) was included.
Rs-auto andPff were then averaged by cover type. Equa-tion (4) was also used with non gap-filled data to characterize the response ofPff to PAR30 cmand calculatePff normal-ized for light (Pff/Pff (PAR30 cm))to assess the influence ofTa, VPD and SWC onPff.
Fig. 1. Relationship between predicted (with the gap-filling
algo-rithm) and measured daytime soil respiration (Rs)for three periods
in 2004 when chambers were darkened (18–19 July, 27 August–1 September and 22–24 September). A log transformation was used on both x and y to provide homoscedasticity. Given the error asso-ciated with x, geometric mean regression was used.
Estimates of soil respiration and forest floor photosynthe-sis scaled-up to the ecosystem level (Rs-ecoandPff-eco, re-spectively), were computed as a weighted average ofRs-auto and Pff, respectively, based on the surface area of each ground cover for the three main cover types in the study area (Table 1). In 2006, one chamber on feathermoss showed un-realistic results and its measurements were thus discarded for that year. Also, the IRGA yielded unstable measurements in September and October 2006, which led to the exclusion of automated chamber data for this period.
Rs-manwas aggregated by sector and for the whole study area. Sectors were delimited by azimuth angles from the flux tower to include approximately the same number of measure-ment points per sector (Table 1). Each sector included collars located 120 to 450 m from the tower.
The EC record was quality controlled as described in Bergeron et al. (2007). Nighttime data under calm con-ditions (friction velocity (u∗)<0.25 m s−1) were discarded. Net ecosystem exchange was partitioned into total ecosystem respiration (Re)and photosynthesis (Peco)using the FCRN standard partitioning and gap-filling algorithm (see Bergeron et al., 2007 for details). EC data were corrected for the lack of closure in the energy budget (82% closure), as suggested by Barr et al. (2006).
Monthly totals ofRs-eco,Pff-eco,Re, andPecowere ob-tained by summing gap-filled values. Regressions were
per-Fig. 2. Time series of automated (Auto; daily mean of
non-gap-filled nighttime measurements) and manual (Man) soil respiration (Rs)measurements for three sectors of the tower footprint.
formed using SAS (version 9.1; SAS Institute Inc., Cary, NC, USA), SigmaPlot (version 8.02; SPSS Inc. Chicago, IL, USA) and/or MatLab (version 7.3.0; The MathWorks Inc., Natick, MA, USE) and its curve fitting toolbox (version 1.1.6).
2.7 Adjustment of Rs-ecofor spatial representativeness
Manual soil respiration measurements made within three sec-tors of the tower footprint showed the same general seasonal patterns as automated measurements made in the surround-ings of the flux tower (Fig. 2). Nonetheless, total gap-filled
Rs-eco was compared to totalRs-manfor the period from 16 June to 4 October 2005 to assess the spatial representative-ness of scaled-up automated soil respiration measurements.
Rs-eco totals were calculated using daily averages from (1) only nighttime measurements and (2) only daytime mea-surements, multiplied by 48, and (3) from the sum of both nighttime and daytime measurements to test for the effect of time of measurement. This was done because Rs-man was measured during the daytime while daytime Rs-auto (thus
Rs-eco)was estimated using the partitioning algorithm de-scribed above. TotalRs-manwas estimated using two com-mon techniques, i.e. linear interpolation between sampling dates (e.g., Davidson et al., 2006b) and derivation from an exponential temperature function (e.g., Law et al., 1999).
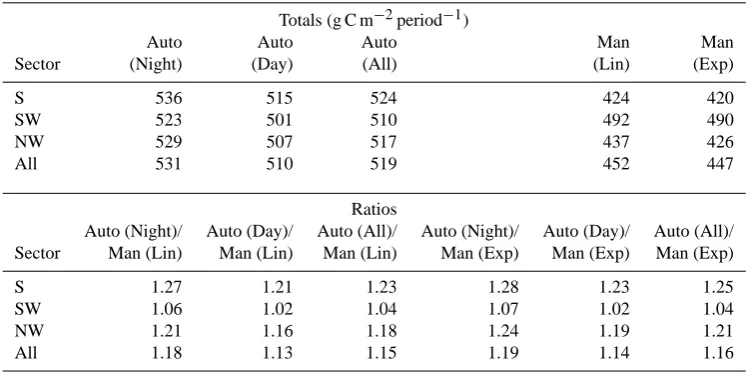
[image:5.595.51.285.65.298.2]Table 2. Total ecosystem soil respiration as estimated by automated (Rs-auto)and manual (Rs-man)measurements, andRs-auto/Rs-manratio
per sector.
Totals (g C m−2period−1)
Auto Auto Auto Man Man
Sector (Night) (Day) (All) (Lin) (Exp)
S 536 515 524 424 420
SW 523 501 510 492 490
NW 529 507 517 437 426
All 531 510 519 452 447
Ratios
Auto (Night)/ Auto (Day)/ Auto (All)/ Auto (Night)/ Auto (Day)/ Auto (All)/ Sector Man (Lin) Man (Lin) Man (Lin) Man (Exp) Man (Exp) Man (Exp)
S 1.27 1.21 1.23 1.28 1.23 1.25
SW 1.06 1.02 1.04 1.07 1.02 1.04
NW 1.21 1.16 1.18 1.24 1.19 1.21
All 1.18 1.13 1.15 1.19 1.14 1.16
Data for the period 16 June to 4 October 2005 are included. Totals for automated measurements (Auto) were calculated using nighttime (Night), daytime (Day), or nighttime and daytime data (All). Totals for manual measurements (Man) were calculated using values gap-filled by daily linear interpolation (Lin) and a 5-day exponential soil temperature function (Exp).
day used for the calculation (Table 2). As well, total soil res-piration estimated fromRs-mandiverged between summation techniques by less than 10 g C m−2 for the 80-day period, corresponding to an uncertainty of less than 3% (Table 2). Hence, the method chosen to estimate snow-free season to-tals of soil respiration from manual measurements did not account for the higher total respiration obtained from the au-tomated measurements.
Therefore, the average of all the ratios of automated to manual measurements for each sector presented in Table 2 (S: 1.24; SW: 1.04; NW: 1.20; All sectors: 1.16) was used as a correction factor to empirically adjust the spatial repre-sentativeness of our time series of automated soil respiration measurements.Rs-ecoadjusted for spatial representativeness (Rs-adj)was computed by decreasing each half-hour mea-surement ofRs-ecoby the correction factor corresponding to the appropriate sector. Half-hours when wind direction was from outside the three sectors or when the footprint length did not match the source area defined above were corrected using a correction factor averaged for all three sectors. The footprint length was calculated using an inverse Lagrangian model (Kljun et al., 2004).
3 Results and discussion
3.1 Response of soil respiration to environmental factors
3.1.1 Q10and base respiration
Q10values derived from Eq. (3) ranged from 3.22–4.36 for feathermoss, 3.54–4.42 for lichen, and 3.33–4.04 for sphag-num micro-sites (Table 3) for soil temperatures varying be-tween 0 and 16◦C (data not shown). These estimates are within the range of reported values for other boreal forest soils (e.g. Davidson et al., 1998; Rayment and Jarvis, 2000; Gaumont-Guay et al., 2006a, 2008). Q10 values of sphag-num micro-sites were lowest overall in 2005 and 2006 and were consistently lower than lichen micro-sites during all three years. Q10 values estimated on a growing season ba-sis represent the temperature sensitivity of enzymatic activ-ity and other temperature-dependant processes (Davidson et al., 2006b) but also include phenological effects (e.g. root growth stage) and microbial population shifts (Janssens and Pilegaard, 2003; Yuste et al., 2004). Hence, our results sug-gest that the dynamics of the processes influencing the tem-perature sensitivity of soil CO2efflux are to some degree af-fected by forest floor vegetation type, which is, to some ex-tent, a reflection of underlying soil properties.
Table 3. Parameter values derived from Eq. (3) relatingRs-autotoTs5 cm.
Year Cover Type A1 B1(◦C−1) Q101 R110(µmol m−2s−1) r2 n 2004 Feathermoss a0.057±0.003 a0.1170±0.0002 a3.22±0.01 a3.41±0.01 0.86 2845
Lichen c0.261±0.007 c0.1487±0.0005 c4.42±0.02 c5.74±0.05 0.71 2845 Sphagnum b0.196±0.006 b0.1397±0.0004 b4.04±0.02 b4.92±0.03 0.76 2845 2005 Feathermoss a-0.299±0.005 b0.1472±0.0004 c4.36±0.01 a3.23±0.02 0.84 3649 Lichen c0.333±0.007 a0.1264±0.0005 b3.54±0.02 c4.94±0.04 0.74 3649 Sphagnum b0.067±0.006 a0.1228±0.0003 a3.41±0.01 b3.65±0.03 0.69 3630 2006 Feathermoss a-0.364±0.006 b0.1456±0.0003 b4.29±0.01 a2.98±0.02 0.82 1907 Lichen b0.026±0.008 b0.1447±0.0005 b4.25±0.02 c4.36±0.04 0.67 1907 Sphagnum c0.128±0.005 a0.1202±0.0003 a3.33±0.01 b3.78±0.02 0.73 1906
1Uncertainty corresponds to 1 SE. Superscripts indicate significant differences (p<0.05) between cover types for each year (beginning with
a for lowest values).
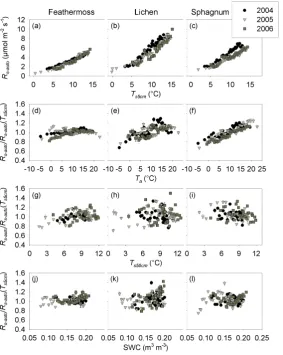
Fig. 3. Relationships between soil temperature at 5 cm depth (Ts5 cm)and automated soil respiration (Rs-auto)under (a) feathermoss, (b)
lichen and (c) sphagnum ground cover. Relationships ofRs-autonormalized forTs5 cm(Rs-auto/Rs-auto(Ts5 cm))with (d–f) air temperature
(Ta), (g–i), soil temperature at 50 cm depth (Ts50 cm)and (j–l) soil water content (SWC) for the three forest floor cover types. Binned
[image:7.595.158.442.288.644.2]spatial variability of soil respiration has been related to the physical (micro-topography, porosity, organic horizon depth, temperature, humidity), chemical (nutrient status of mineral and organic horizons, organic matter quantity and quality) and biological (microbial and fine root biomass, microbial community composition) properties of the soil which can in-fluence either the production of CO2, its transport to the sur-face or both (Fang et al., 1998; Longdoz et al., 2000; Ray-ment and Jarvis, 2000; Xu and Qi, 2001; Heijmans et al., 2004; Khomik et al., 2006; Saiz et al., 2006). These proper-ties are linked to micro-site structural characteristics that are in turn related to the distribution and composition of mosses and lichens (Bisbee et al., 2001; Sulyma and Coxson, 2001). Our results provide evidence that the heterogeneity of the ground cover vegetation, which can represent the spatial vari-ability of soil properties, should be taken into account when characterizing or simulating the response of soil CO2efflux to environmental factors.
Shallow soil temperature explained 67–86% of the tem-poral variation ofRs-autounder all ground cover types (Ta-ble 3, Fig. 3a–c). Rs-auto normalized for soil temperature (Rs-auto/Rs-auto(Ts5 cm)) showed a significant (p<0.0001) positive linear correlation with air temperature for all three ground cover types (r2=0.01–0.07 for feathermoss, 0.02– 0.13 for lichen, and 0.18–0.28 for sphagnum, Fig. 3d–f). Fur-thermore, normalizedRs-autoof feathermoss micro-sites ex-hibited a significant (p<0.05), but very weak, positive corre-lation with deep soil temperature (Ts50 cm)in 2004 and 2005 (r2=0.04 for both years, Fig. 3g–i). Temperature has been demonstrated to exert a major influence on soil respiration (Singh and Gupta, 1977; Raich and Schlesinger, 1992; Lloyd and Taylor, 1994; Davidson et al., 2006a). Studies have also shown that most soil respiration occurs in the upper soil lay-ers in northern forest ecosystems (Drewitt et al., 2005; Jassal et al., 2005). These results again emphasize the need to ac-count for different ground cover vegetation types in soil and ecosystem C exchange studies as they may reflect the spatial variability of soil properties and the distribution of respira-tory processes along the soil profile.
3.1.2 Response to substrate moisture
Substrate moisture limitation on Rs-auto was apparent only under sphagnum when soil water content near the surface reached values below 0.10 m3m−3in 2005 (Fig. 3j–l). Soil moisture has been reported to affect the soil respiration of temperate and boreal forest ecosystems (Davidson et al., 1998; Subke et al., 2003; Gaumont-Guay et al., 2006a). However, Gaumont-Guay et al. (2008) also reported no effect of soil moisture on soil respiration for a boreal black spruce site in Saskatchewan. This Saskatchewan site is located in a topographic depression where the water table and soil wa-ter content are generally high. Our site is less hydric than the site in Saskatchewan but the wetter climate prevailing in eastern Canada can induce more frequent rainfall throughout
the growing season, in addition to larger amounts of water re-leased by snowmelt, compared to ecosystems located in the drier regions of central Canada (Bergeron et al., 2007). As a result, our soils stayed relatively moist, at least in deeper soil horizons (data not shown), thereby partly explaining the lack of a relationship between soil respiration and soil humidity under feathermoss and lichen. Also, root respiration is po-tentially less sensitive to the drying of superficial soil layers than soil organic matter decomposition (Gaumont-Guay et al., 2008) likely because tree root systems can access deep water that is not available to decomposers in the upper soil layer. In addition, micro-habitats dominated by sphagnum in boreal black spruce forests are less favourable for tree root growth as they are associated with wetter and colder con-ditions (Bisbee et al., 2001), hence microbial decomposi-tion presumably contributes more to soil respiradecomposi-tion under sphagnum micro-sites. As a result, it is possible that the mi-crobial populations on sphagnum microsites were more sen-sitive to soil moisture than those on feathermoss or lichen microsites. The differences we observed in the response of
Rs-auto to SWC between ground cover types may therefore reflect different contribution levels of autotrophic (root) and heterotrophic (microbial) respiration between micro-sites. 3.2 Contribution of soil respiration to ecosystem
respiration
During the study period, monthly ratios of Rs-eco, not ad-justed for spatial representativeness, toReranged from 82– 120%, with values exceeding 100% on several occasions (Ta-ble 4), suggesting our scaling method overestimated soil res-piration at the ecosystem level. On the other hand, adjusted
Rs-eco (Rs-adj)toReratios ranged from 72% to 103% dur-ing the snow-free season on a monthly basis and exceeded 100% on only one occasion. These results emphasize the importance of assessing the spatial representativeness of au-tomated soil respiration measurements when scaled up to the ecosystem level to help resolve the mismatch in source area between chamber and EC measurements and thus produce comparable estimates.
Table 4. Monthly totals ofRs-eco,Rs-adj,Re,Pff-ecoandPeco.
Month R1s-eco R1e Rs-eco/Re
2004 2005 2006 2004 2005 2006 2004 2005 2006
May – 50 55 – 60 61 – 0.83 0.90
Jun 84 119 114 97 145 124 0.88 0.82 0.92
Jul 137 143 169 148 163 161 0.93 0.88 1.05 Aug 149 165 166 153 150 147 0.97 1.10 1.13
Sep 125 128 127 108 121 – 1.16 1.06 –
Oct 78 85 82 68 71 – 1.15 1.20 –
Total 573 690 713 574 710 493 Mean 1.02 0.98 1.00
Month R1s-adj R1e Rs-adj/Re
2004 2005 2006 2004 2005 2006 2004 2005 2006
May – 43 47 – 60 61 – 0.72 0.77
Jun 73 104 99 96 145 124 0.76 0.72 0.80
Jul 118 123 146 148 163 161 0.80 0.75 0.91 Aug 128 142 142 153 150 147 0.84 0.95 0.97
Sep 107 110 – 108 121 – 0.99 0.91 –
Oct 66 73 – 68 71 – 0.97 1.03 –
Total 492 595 434 573 710 493 Mean 0.87 0.85 0.86
Month Pff1 -eco Peco1 Pff-eco/Peco
2004 2005 2006 2004 2005 2006 2004 2005 2006
May – 17 17 – 101 101 – 0.17 0.17
Jun 24 25 25 136 159 162 0.18 0.16 0.15
Jul 24 26 31 165 195 188 0.15 0.13 0.17
Aug 31 31 32 180 177 180 0.17 0.17 0.18
Sep 21 24 – 119 125 – 0.18 0.19 –
Oct 12 14 – 56 58 – 0.21 0.24 –
Total 112 137 105 656 815 631 Mean 0.18 0.18 0.17
1Values are in g C m−2month−1. Gap-filled values were used. See Methods for details.
The somewhat higher Rs-adj toRe ratio reported in our study, as compared to sites in the western Canadian boreal forest, could be a result of regional differences within the boreal forest in terms of the various component contributions to total ecosystem respiration. Bergeron et al. (2007) showed that total ecosystem C exchange differs between our east-ern Canadian site and two other black spruce sites located in central Canada. This difference was partly attributed to higher soil temperatures at 5 and 50 cm. The higher win-ter temperatures were attributable to a thicker snowpack, at the eastern Canadian black spruce site and led to higher winter soil respiration, which may explain the proportion-ately higher contribution of soil respiration to total ecosys-tem respiration at this site. The eastern site also has a greater below-ground biomass (Bergeron et al., 2007) compared to the western coniferous sites which may have led to propor-tionately higher soil respiration as compared to ecosystem respiration at this site. Furthermore, Bergeron et al. (2007) also observed a lower water table at the eastern site during the second half of the growing season, which may have led
to higher soil respiration rates due to the absence of anaer-obic conditions. They also noted that soil moisture helped explain anomalies in the response of ecosystem respiration to temperature between sites at the monthly time scale, with our eastern site at the low end of soil water content. Thus, it is possible that the contribution of soil respiration to ecosystem respiration was greater at the eastern site. This finding, and the fact that little to no soil respiration restriction due to low soil moisture was found in our study, suggests that regional differences may exist in tree root phenology and physiology and/or in microbial community composition and dynamics and help explain the high soil to ecosystem respiration ra-tios reported here. However, further study is needed to shed light on these regional differences. It is also possible that the lower above-ground biomass at the eastern site or its associ-ated respiration could help explain the regional differences in the soil to ecosystem respiration ratio.
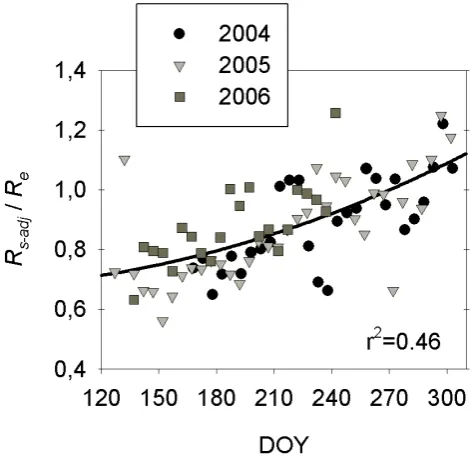
autumn (Fig. 4). On a monthly basis, a similar general in-crease was also observed (Table 4). TheRs-adj/Re ratio had a significant negative linear correlation with the difference between air and soil temperature for the May–June, July– August and September–October periods using daily values (Fig. 5). Few studies have described in detail the seasonal variation of the soil to ecosystem respiration ratio. Black et al. (2005) reported that the soil to ecosystem respiration ratio of a boreal black spruce site was greater in mid-summer and in winter and reached a minimum in spring and early sum-mer. Davidson et al. (2006b) showed that the soil to ecosys-tem respiration ratio was minimal in spring and increased to a maximum in autumn and winter for a temperate deciduous forest. Jassal et al. (2007) also showed a spring to autumn increase for a coastal coniferous forest. This seasonal vari-ation was related to the different phenologies of above- and below-ground ecosystem components, to variations in sub-strate supply, and to lags between changes in air and soil temperature.
It is worth noting that the Rs-auto/Re ratio close to one in autumn reported here returns to a much lower value by the following spring. This reset likely occurs in springtime when warm air stimulates above-ground respiration and the cold soil limits root growth and organic matter decomposi-tion (Davidson et al., 2006b), thus limiting soil CO2 efflux and decreasing the contribution of soil respiration to total ecosystem respiration to a minimum.
3.3 Response of forest floor photosynthesis (Pff)to en-vironmental factors
3.3.1 Response to light
Maximum photosynthetic capacity (Pffmax)was higher for feathermoss than sphagnum in 2004 and 2005 (Table 5).
Pffmaxwas lowest for lichen in 2005 and 2006 but highest in 2004. Feathermoss consistently showed lower photosyn-thetic apparent quantum yield (α) values than sphagnum (Ta-ble 5). The same was true for lichen except in 2005 whenα
was not significantly lower than for sphagnum. Feathermoss and lichen showed significantly differentαonly in 2004.
[image:10.595.309.547.65.294.2]These results contrast with other published values of light response curve parameters. Swanson and Flanagan (2001) reported higher maximum photosynthetic capacity and quan-tum yield for sphagnum compared to feathermoss from mea-surements made at an old black spruce site in Saskatchewan. Goulden and Crill (1997) also observed higher maximum photosynthetic capacity values for sphagnum than feather-moss at the Northern Old Black Spruce flux site in Mani-toba. In both studies, ecological differences between sphag-num and feathermoss micro-sites were greater than in the present study. At these central Canadian sites, sphagnum oc-cupied open, wet micro-sites in lower elevations (hollows) where the water table is near or at the surface, while feath-ermoss was found in shady, dry upland areas (hummocks)
Fig. 4. Time series of five-day means of theRs-adjtoReratio using
gap-filled values.
Table 5. Parameter values derived from Eq. (4) relatingPff to
PAR30 cm.
Cover α(X 10−2)1 Pff1max
Year Type (mol mol−1) (µmol m−2s−1) r2 n 2004 Feathermoss b4.12±0.11 b2.95±0.05 0.62 2907
Lichen a3.05±0.13 c3.44±0.10 0.35 2747 Sphagnum c5.20±0.30 a2.24±0.06 0.26 2677 2005 Feathermoss a5.98±0.25 c2.17±0.03 0.32 4204 Lichen ab6.06±0.42 a1.68±0.04 0.11 4003 Sphagnum b7.29±0.39 b1.83±0.03 0.20 4074 2006 Feathermoss a3.70±0.14 b2.67±0.05 0.48 3048 Lichen a3.39±0.25 a2.03±0.06 0.13 2902 Sphagnum b4.55±0.18 b2.79±0.06 0.41 3000
[image:10.595.308.551.392.527.2]Fig. 5. Relationship between dailyRs-adjtoReratio and the difference between air and soil (5 cm depth) temperature for (a) May–June, (b)
July–August, and (c) September–October. All correlations are significant (p<0.002).
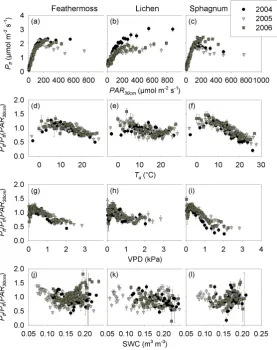
Fig. 6. Relationships between below canopy photosynthetically active radiation (PAR30 cm)and forest floor photosynthesis (Pff)of (a)
feathermoss, (b) lichen and (c) sphagnum. Relationships ofPff normalized for PAR30 cm(Pff/Pff(PAR30 cm))with (d–f) air temperature (Ta), (g–i) vapor pressure deficit (VPD) and (j–l) soil water content (SWC) for the three forest floor cover types. Binned data±SE (n=100)
[image:11.595.159.437.265.616.2]cover to environmental conditions appears to depend on the interaction between ground cover type (feathermoss, sphag-num and lichen) and microhabitat environmental conditions. The response of lichen photosynthesis to light is not well documented and specific information about the physiology of Cladina spp. is rare. Lichens are considered to have pho-tosynthetic rates similar to bryophytes when hydrated (Green and Lange, 1994). Coxson and Wilson (2004) reported val-ues of maximum photosynthesis per mass unit of Cladina mi-tis similar to those reported for feathermoss and sphagnum. Our results provide evidence that bryophytes and lichens have photosynthetic rates per unit ground area that are sim-ilar in range. However, our study shows that lichen has dis-tinct light response curve parameters and provides values for these parameters that can be used to simulate the photosyn-thetic response of lichen to light.
The photosynthesis of feathermoss, sphagnum and lichen saturated at relatively low irradiance values (∼200µmol m−2s−1; Fig. 6a–c) that correspond to the maximum daytime irradiance below the canopy for most days of the snow-free season (data not shown). This was expected, since bryophytes and lichen would likely be well adapted to shade conditions (Green and Lange, 1994). The saturating light levels observed here are consistent with those measured by Whitehead and Gower (2001) and Kolari et al. (2006) for feathermoss and with those reported by Swanson and Flanagan (2001) for sphagnum. For lichen photosynthesis, Coxson and Wilson (2004) reported lower saturating light levels that decreased with temperature. Kolari et al. (2006) observed that light levels at the forest floor of a Scots pine forest in Finland were high enough for photosynthesis to saturate most of the time. On the other hand, Bisbee et al. (2001) suggested that the photosynthetic production of the forest floor is light limited. Given thatPff reached saturation at low light levels that are typical of the understory environment on our site, our results support the idea that factors other than light (i.e., temperature and/or water stress) limit the photosynthesis, and thus the carbon uptake, of forest floors composed of sphagnum, feathermoss or lichen. Furthermore, increased light availability due to non-stand replacing disturbances (e.g., windthrow, canopy dieback) generally increases the abundance of understory vascular plants thus leaving unchanged the light regime at the forest floor (Hart and Chen, 2006).
3.3.2 Response to other environmental variables
[image:12.595.311.547.63.285.2]The response of Pff normalized for light (Pff/Pff(PAR30 cm))to air temperature and vapor pressure deficit was similar for all three ground cover types (Fig. 6d– i). Pff/Pff(PAR30 cm)peaked atTa=5–8◦C and decreased at temperatures below and above this range, suggesting that forest floor photosynthesis is optimal at temperatures ranging from 5–8◦C. These results are consistent with those of Goulden and Crill (1997) for feathermoss and sphagnum.
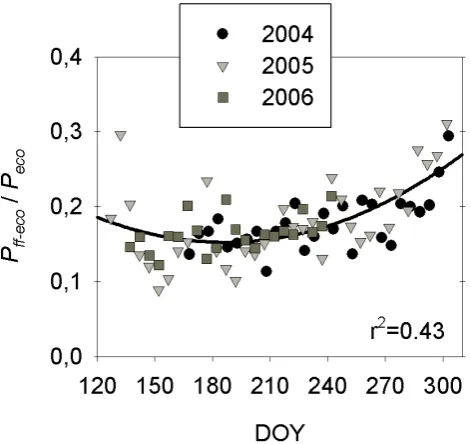
Fig. 7. Five-day means of the ratio ofPff toPecousing daytime
gap-filled values.
Coxson and Wilson (2004) reported an optimal temperature for Cladina mitis photosynthesis of about 15◦C, which is somewhat higher than reported here. Normalized Pff of sphagnum showed a sharper decline at temperatures above 8◦C compared to feathermoss and lichen, decreasing from 1.4 to 0.6, while normalizedPff of feathermoss and lichen decreased from 1.2 to 0.8. This indicates that light response curves can overestimate sphagnum photosynthesis by up to 40% under high air temperature conditions while this overestimation is limited to 20% for feathermoss and lichen. Sphagnum also showed a stronger decrease of normalized
Pff when VPD values were above 1 kPa and Pff was overestimated by as much as 50% for sphagnum (normalized
Pff=0.5) compared to about 25% for feathermoss and lichen (normalizedPff=0.75). No restriction of Pff was observed at low SWC for any of the three ground cover types (Fig. 6j–l).
Fig. 8. Five-day mean of (a–c) 5 cm and 50 cm soil temperature (Ts), (d–f) gap-filled soil and ecosystem respiration (R), (g–i) total daily
photosynthetically active radiation (PAR), (j–l), air temperature (Ta)and (m–o) mean gap-filled forest floor and ecosystem photosynthesis
(P) for 2004 to 2006.
3.4 Contribution ofPff-ecotoPeco
The mean Pff-eco/Peco ratios on a snow-free season basis were consistent between years at 0.17–0.18 (Table 4). These results agree with published values for mature black spruce ecosystems in other regions of Canada. Swanson and Flana-gan (2001) reported that moss photosynthesis accounted for 13% of gross ecosystem productivity (GEP) for the grow-ing season. Goulden and Crill (1997) estimated the contribu-tion of moss photosynthesis to GEP ranged between 10 and 50% on a daily basis with a greater contribution observed after rain events. In our study, the forest floor vegetation accounted for as much as 45% of daily ecosystem photo-synthesis toward the end of the snow-free season (data not shown). Snow-free season totals ofPff-eco were 23–24% that ofRs-adj(Table 4). Drewitt et al. (2002) also measured
a decrease in daytime soil CO2 efflux of up to 25% due to moss photosynthesis. Mor´en and Lindroth (2000) observed an offset of soil respiration of about 20% due to forest floor photosynthesis. Our results demonstrate that C fixation by forest floor photosynthesis is a significant component of C exchange of boreal ecosystems and that mature black spruce ecosystems in the eastern portion of North America seem to obtain a similar proportion of their assimilated carbon from the forest floor compared to black spruce forests in other re-gions.
Table 6. Relationships ofPff-eco/Pecowith air and soil
tempera-tures.
Variables Parameters p r2
Ta y=2.33906–0.35617x+0.01278x2 <0.0001 0.09 Ts5 cm y=3.13177–0.58279x+0.02737 <0.0001 0.04 Ts50 mm y=3.62913–0.79176x+0.04379x2 0.0001 0.04 Ts100 cm y=3.39657–0.82296x+0.05033x2 0.0003 0.04
Daily gap-filled values were used. See Methods for details.
floor vegetation decreased as air temperature increased up to 20◦C and varied little for further increases up to 30◦C (data not shown). This observed temperature limitation of the Pff-eco/Peco ratio is consistent with the limitation of photosynthesis at temperatures above 8◦C mentioned earlier (Fig. 6d, f). On the other hand, boreal forest GEP is not only dependent on light levels but also on air temperature (van Dijk et al., 2005; Bergeron et al., 2007, Fig. 8g–o) and thus shows a pronounced seasonal variation with maximum values reached during mid-summer when air temperature is high (Black et al., 2005, Fig. 8j–o). These two contrasting responses, along with the fact that the seasonal variability ofPecois almost an order of magnitude greater than that of
Pff-eco, can explain the seasonal pattern of thePff-eco/Peco ratio.
4 Conclusions
This study reports on C exchange of the forest floor within a boreal black spruce forest in eastern North America and its seasonal contribution to ecosystem C exchange. We have shown that the response of soil respiration to environmen-tal factors differs between micro-sites. Soil respiration was a dominant component of ecosystem respiration during the study period, accounting for 85–87% of total ecosystem res-piration on a snow-free season basis. However, the contribu-tion of soil respiracontribu-tion to ecosystem respiracontribu-tion varied sea-sonally, ranging 72 to 103% from May to October and this variation was related to the difference between air and soil temperature.
This study also showed that C assimilation by the moss and lichen stratum can significantly impact ecosystem C ex-change in the boreal forest of eastern North America, ac-counting for 17–18% of the total ecosystem C assimilation. The contribution of forest floor to ecosystem photosynthe-sis did not vary significantly between years but showed a pronounced seasonal variation, ranging from 13 to 24% on a monthly basis and even more on a daily basis, indicating that the different vegetation strata respond differently to envi-ronmental conditions. The three ground cover types showed some differences in photosynthetic responses to
environmen-tal conditions but light did not appear to limit photosynthesis of bryophytes and lichen during the snow-free season.
To better understand and predict the consequences of the modification of temperature and precipitation regimes under different climate change scenarios, process models could uti-lize the parameters and response functions described in this paper to better characterize the physiological processes gov-erning C exchange of the soil and ground cover of boreal ecosystems in eastern North America.
Acknowledgements. This study was supported by the Fluxnet-Canada Research Network and the Canadian Carbon Program funded by the Canadian Foundation for Climate and Atmospheric Sciences, the Natural Sciences and Engineering Research Council of Canada, BIOCAP Canada, Environment Canada, and Natural Resources Canada. Onil Bergeron was also supported by a fellowship from the “Fondation de l’Universit´e Laval”. The authors would like to thank Marc-Andr´e Giasson, Martin Waltz, Vincent Paris, Luc Guindon, Francis Foley, Mathieu Godbout, Sara Boivin-Chabot and Debbie Stowe for their technical assis-tance. We gratefully acknowledge the valuable contributions of David Gaumont-Guay, Zoran Nesic, and T. Andrew Black for the automated chamber system. We also thank Pierre Bernier and David Par´e for their valuable scientific input.
Edited by: B. D. Sigurdsson
References
Baldocchi, D., Kelliher, F. M., Black, T. A., and Jarvis, P.: Climate and vegetation controls on boreal zone energy exchange, Glob. Change Biol., 6, 69–83, 2000.
Barr, A. G., Black, T. A., Hogg, E. H., Kljun, N., Morgenstern, K., and Nesic, Z.: Inter-annual variability in the leaf area index of a boreal aspen-hazelnut forest in relation to net ecosystem produc-tion, Agr. Forest Meteorol., 126, 237–255, 2004.
Barr, A. G., Morgenstern, K., Black, T. A., McCaughey, J. H., and Nesic, Z.: Surface energy balance closure by the eddy-covariance method above three boreal forest stands and implica-tions for the measurement of the CO2flux, Agr. Forest Meteorol., 140, 322–337, 2006.
Bergeron, O., Margolis, H. A., Black, T. A., Coursolle, C., Dunn, A. L., Barr, A. G., and Wofsy, S. C.: Comparison of carbon dioxide fluxes over three boreal black spruce forests in Canada, Glob. Change Biol., 13, 89–107, 2007.
Bisbee, K. E., Gower, S. T., Norman, J. M., and Nordheim, E. V.: Environmental controls on ground cover species composition and productivity in a boreal black spruce forest, Oecologia, 129, 261– 270, 2001.
Black, T. A., Gaumont-Guay, D., Jassal, R. S., Amiro, B. D., Jarvis, P. G., Gower, S. T., Kelliher, F. M., Dunn, A., and Wofsy, S. C.: Measurement of CO2 exchange between boreal forest and
the atmosphere, in: The carbon balance of forest biomes, edited by: Griffiths, H. and Jarvis, P. J., Taylor and Francis Group, New York, 151–186, 2005.
sub-boreal spruce forests in central British Columbia, Canada, Forest Ecol. Manag., 235, 240–251, 2006.
Coxson, D. S. and Wilson, J. A.: Carbon gain in Cladina mitis from mixed feather moss mats in a sub-alpine spruce-fir forest: The role of soil respiratory carbon dioxide release, Symbiosis, 37, 307–321, 2004.
Davidson, E. A., Belk, E., and Boone, R. D.: Soil water content and temperature as independent or confounded factors control-ling soil respiration in a temperate mixed hardwood forest, Glob. Change Biol., 4, 217–227, 1998.
Davidson, E. A., Janssens, I. A., and Luo, Y. Q.: On the variability of respiration in terrestrial ecosystems: moving beyond Q(10), Glob. Change Biol., 12, 154–164, 2006a.
Davidson, E. A., Richardson, A. D., Savage, K. E., and Hollinger, D. Y.: A distinct seasonal pattern of the ratio of soil respiration to total ecosystem respiration in a spruce-dominated forest, Glob. Change Biol., 12, 230–239, 2006b.
Davidson, E. A., Savage, K., Verchot, L. V., and Navarro, R.: Min-imizing artifacts and biases in chamber-based measurements of soil respiration, Agr. Forest Meteorol., 113, 21–37, 2002. Drewitt, G. B., Black, T. A., and Jassal, R. S.: Using measurements
of soil CO2efflux and concentrations to infer the depth
distri-bution of CO2production in a forest soil, Can. J. Soil Sci., 85,
213–221, 2005.
Drewitt, G. B., Black, T. A., Nesic, Z., Humphreys, E. R., Jork, E. M., Swanson, R., Ethier, G. J., Griffis, T., and Morgenstern, K.: Measuring forest floor CO2fluxes in a Douglas-fir forest, Agr.
Forest Meteorol., 110, 299–317, 2002.
Fang, C., Moncrieff, J. B., Gholz, H. L., and Clark, K. L.: Soil CO2
efflux and its spatial variation in a Florida slash pine plantation, Plant Soil, 205, 135–146, 1998.
Flannigan, M., Campbell, I., Wotton, M., Carcaillet, C., Richard, P., and Bergeron, Y.: Future fire in Canada’s boreal forest: paleoe-cology results and general circulation model – regional climate model simulations, Can. J. Forest Res., 31, 854–864, 2001. Gaumont-Guay, D., Black, T. A., Barr, A. G., Jassal, R. S.,
and Nesic, Z.: Biophysical controls on rhizospheric and het-erotrophic components of soil respiration in a boreal black spruce stand, Tree Physiol., 28, 161–171, 2008.
Gaumont-Guay, D., Black, T. A., Griffis, T. J., Barr, A. G., Jassal, R. S., and Nesic, Z.: Interpreting the dependence of soil respiration on soil temperature and water content in a boreal aspen stand, Agr. Forest Meteorol., 140, 220–235, 2006a.
Gaumont-Guay, D., Black, T. A., Griffis, T. J., Barr, A. G., Morgen-stern, K., Jassal, R. S., and Nesic, Z.: Influence of temperature and drought on seasonal and interannual variations of soil, bole and ecosystem respiration in a boreal aspen stand, Agr. Forest Meteorol., 140, 203–219, 2006b.
Gaumont-Guay, D., Black, T.A., McCaughey, H., Barr, A. G., Kr-ishnan, P., Jassal, R. S., and Nesic, Z.: Soil CO2efflux in
con-trasting boreal deciduous and coniferous stands and its contribu-tion to the ecosystem carbon balance, Glob. Change Biol., 15, 1302–1319, 2009.
Goulden, M. L. and Crill, P. M.: Automated measurements of CO2
exchange at the moss surface of a black spruce forest, Tree Phys-iol., 17, 537–542, 1997.
Green, T. G. A. and Lange, O. L.: Photosynthesis in poikilohydric plants: a comparison of lichens and bryophytes, in: Ecophysiol-ogy of photosynthesis, edited by: Schulze, E. D. and Caldwell,
M. M., Springer-Verlag, New York, 319–341, 1994.
Hart, S. A. and Chen, H. Y. H.: Understory vegetation dynamics of North American boreal forests, Crit. Rev. Plant Sci., 25, 381– 397, 2006.
Heijmans, M. M. P. D., Arp, W. T., and Chapin, F. S.: Carbon diox-ide and water vapour exchange from understory species in boreal forest, Agr. Forest Meteorol., 123, 135–147, 2004.
Heimann, M. and Reichstein, M.: Terrestrial ecosystem carbon dy-namics and climate feedbacks, Nature, 451, 289–292, 2008. Janssens, I. A., Lankreijer, H., Matteucci, G., Kowalski, A. S.,
Buchmann, N., Epron, D., Pilegaard, K., Kutsch, W., Long-doz, B., Grunwald, T., Montagnani, L., Dore, S., Rebmann, C., Moors, E. J., Grelle, A., Rannik, U., Morgenstern, K., Oltchev, S., Clement, R., Gudmundsson, J., Minerbi, S., Berbigier, P., Ibrom, A., Moncrieff, J., Aubinet, M., Bernhofer, C., Jensen, N. O., Vesala, T., Granier, A., Schulze, E. D., Lindroth, A., Dolman, A. J., Jarvis, P. G., Ceulemans, R., and Valentini, R.: Productiv-ity overshadows temperature in determining soil and ecosystem respiration across European forests, Glob. Change Biol., 7, 269– 278, 2001.
Janssens, I. A. and Pilegaard, K.: Large seasonal changes in Q(10) of soil respiration in a beech forest, Glob. Change Biol., 9, 911– 918, 2003.
Jassal, R., Black, A., Novak, M., Morgenstern, K., Nesic, Z., and Gaumont-Guay, D.: Relationship between soil CO2
concentra-tions and forest-floor CO2effluxes, Agr. Forest Meteorol., 130, 176–192, 2005.
Jassal, R. S., Black, T. A., Cai, T. B., Morgenstern, K., Li, Z., Gaumont-Guay, D., and Nesic, Z.: Components of ecosystem respiration and an estimate of net primary productivity of an intermediate-aged Douglas-fir stand, Agr. Forest Meteorol., 144, 44–57, 2007.
Khomik, M., Arain, M. A., and McCaughey, J. H.: Temporal and spatial variability of soil respiration in a boreal mixedwood for-est, Agr. Forest Meteorol., 140, 244–256, 2006.
Kljun, N., Calanca, P., Rotach, M. W., and Schmid, H. P.: A sim-ple parameterisation for flux footprint predictions, Bound.-Lay. Meteorol., 112, 503–523, 2004.
Kolari, P., Pumpanen, J., Kulmala, L., Ilvesniemi, H., Nikinmaa, E., Gronholm, T., and Hari, P.: Forest floor vegetation plays an im-portant role in photosynthetic production of boreal forests, Forest Ecol. Manag., 221, 241–248, 2006.
Lavigne, M. B., Ryan, M. G., Anderson, D. E., Baldocchi, D. D., Crill, P. M., Fitzjarrald, D. R., Goulden, M. L., Gower, S. T., Massheder, J. M., McCaughey, J. H., Rayment, M., and Striegl, R. G.: Comparing nocturnal eddy covariance measurements to estimates of ecosystem respiration made by scaling chamber measurements at six coniferous boreal sites, J. Geophys. Res.-Atmos., 102, 28977–28985, 1997.
Law, B. E., Ryan, M. G., and Anthoni, P. M.: Seasonal and annual respiration of a ponderosa pine ecosystem, Glob. Change Biol., 5, 169–182, 1999.
Lloyd, J. and Taylor, J. A.: On the Temperature-Dependence of Soil Respiration, Funct. Ecol., 8, 315–323, 1994.
Longdoz, B., Yernaux, M., and Aubinet, M.: Soil CO2efflux
mea-surements in a mixed forest: impact of chamber disturbances, spatial variability and seasonal evolution, Glob. Change Biol., 6, 907–917, 2000.
boreal forest, Agr. Forest Meteorol., 101, 1–14, 2000.
Morgenstern, K., Black, T. A., Humphreys, E. R., Griffis, T. J., Drewitt, G. B., Cai, T. B., Nesic, Z., Spittlehouse, D. L., and Livingstone, N. J.: Sensitivity and uncertainty of the carbon bal-ance of a Pacific Northwest Douglas-fir forest during an El Nino La Nina cycle, Agr. Forest Meteorol., 123, 201–219, 2004. O’Connell, K. E. B., Gower, S. T., and Norman, J. M.: Comparison
of net primary production and light-use dynamics of two boreal black spruce forest communities, Ecosystems, 6, 236–247, 2003. Pumpanen, J., Ilvesniemi, H., Keronen, P., Nissinen, A., Pohja, T., Vesala, T., and Hari, P.: An open chamber system for measur-ing soil surface CO2efflux: Analysis of error sources related to the chamber system, J. Geophys. Res.-Atmos., 106, 7985–7992, 2001.
Raich, J. W. and Schlesinger, W. H.: The Global Carbon-Dioxide Flux in Soil Respiration and Its Relationship to Vegetation and Climate, Tellus B, 44, 81–99, 1992.
Rayment, M. B. and Jarvis, P. G.: Temporal and spatial variation of soil CO2efflux in a Canadian boreal forest, Soil Biol. Biochem., 32, 35–45, 2000.
Saiz, G., Green, C., Butterbach-Bahl, K., Kiese, R., Avitabile, V., and Farrell, E. P.: Seasonal and spatial variability of soil respira-tion in four Sitka spruce stands, Plant Soil, 287, 161–176, 2006. Savage, K. E. and Davidson, E. A.: A comparison of manual and automated systems for soil CO2flux measurements: trade-offs
between spatial and temporal resolution, J. Exp. Bot., 54, 891– 899, 2003.
Schipperges, B. and Rydin, H.: Response of photosynthesis of Sphagnum species from contrasting microhabitats to tissue wa-ter content and repeated desiccation, New Phytol., 140, 677–684, 1998.
Singh, J. S. and Gupta, S. R.: Plant decomposition and soil respira-tion in terrestrial ecosystems, Bot. Rev., 43, 499–528, 1977. Subke, J. A., Reichstein, M., and Tenhunen, J. D.: Explaining
tem-poral variation in soil CO2 efflux in a mature spruce forest in Southern Germany, Soil Biol. Biochem., 35, 1467–1483, 2003. Sulyma, R. and Coxson, D. S.: Microsite displacement of
terres-trial lichens by feather moss mats in late seral pine-lichen wood-lands of north-central British Columbia, Bryologist, 104, 505– 516, 2001.
Swanson, R. V. and Flanagan, L. B.: Environmental regulation of carbon dioxide exchange at the forest floor in a boreal black spruce ecosystem, Agr. Forest Meteorol., 108, 165–181, 2001.
Trumbore, S. E. and Harden, J. W.: Accumulation and turnover of carbon in organic and mineral soils of the BOREAS northern study area, J. Geophys. Res.-Atmos., 102, 28817–28830, 1997. Tupek, B., Minkkinen, K., Kolari, P., Starr, M., Chan, T., Alm,
J., Vesala, T., Laine, J., and Nikinmaa, E.: Forest floor versus ecosystem CO2exchange along boreal ecotone between upland
forest and lowland mire, Tellus B, 60, 153–166, 2008.
Valentini, R., Matteucci, G., Dolman, A. J., Schulze, E. D., Reb-mann, C., Moors, E. J., Granier, A., Gross, P., Jensen, N. O., Pilegaard, K., Lindroth, A., Grelle, A., Bernhofer, C., Grunwald, T., Aubinet, M., Ceulemans, R., Kowalski, A. S., Vesala, T., Ran-nik, U., Berbigier, P., Loustau, D., Guomundsson, J., Thorgeirs-son, H., Ibrom, A., Morgenstern, K., Clement, R., Moncrieff, J., Montagnani, L., Minerbi, S., and Jarvis, P. G.: Respiration as the main determinant of carbon balance in European forests, Nature, 404, 861–865, 2000.
van Dijk, A. I. J. M., Dolman, A. J., and Schulze, E. D.: Radiation, temperature, and leaf area explain ecosystem carbon fluxes in boreal and temperate European forests, Global Biogeochem. Cy., 19, GB2029, doi:2010.1029/2004GB002417, 2005.
Whitehead, D. and Gower, S. T.: Photosynthesis and light-use ef-ficiency by plants in a Canadian boreal forest ecosystem, Tree Physiol., 21, 925–929, 2001.
Williams, T. G. and Flanagan, L. B.: Effect of changes in water con-tent on photosynthesis, transpiration and discrimination against (CO2)-C-13 and (COO)-O-18-O-16 in Pleurozium and Sphag-num, Oecologia, 108, 38–46, 1996.
Xu, M. and Qi, Y.: Soil-surface CO2efflux and its spatial and tem-poral variations in a young ponderosa pine plantation in northern California, Glob. Change Biol., 7, 667–677, 2001.
Yuste, J. C., Janssens, I. A., Carrara, A., and Ceulemans, R.: Annual Q(10) of soil respiration reflects plant phenological patterns as well as temperature sensitivity, Glob. Change Biol., 10, 161–169, 2004.