www.ann-geophys.net/27/2011/2009/
© Author(s) 2009. This work is distributed under the Creative Commons Attribution 3.0 License.
Annales
Geophysicae
Intermittency of storms and substorms: is it related to the critical
behaviour?
P. Dobias1and J. A. Wanliss2
1DRDC CORA, 101 Colonel By Dr., Ottawa, ON, K1A0K2, Canada 2Presbyterian College, 503 S Broad St, Clinton, SC 29325-2865, USA
Received: 1 September 2008 – Revised: 14 April 2009 – Accepted: 14 April 2009 – Published: 4 May 2009
Abstract. Intermittency is one of the possible means of quantifying dynamics of fractal processes. In this paper, the analysis of the intermittency of magnetospheric storms and substorms is presented. The analysis allows for a classifica-tion of the processes in terms of the power-law scaling of the magnitude of deviations of the index values from the values at quiet times (normal state), and the relative timings of oc-currences of such deviations. These are expressed in terms of the co-dimension and the Fano factor. The relationship between the two is related to the nature of the processes be-hind the observed storm and substorm dynamics. The results suggest that there is a similarity between the two, and there-fore it is possible that there are common dynamical processes behind the storms and substorms. In particular, it appears that both of them behave consistently with what would be expected for critical systems, which is consistent with the conclusions of several previous works.
Keywords. Electromagnetics (Plasmas) – Interplanetary physics (Instruments and techniques; General or miscella-neous)
1 Introduction
There have been ongoing arguments about the relationship between the nature of magnetospheric storms and substorms, and about the triggering mechanisms for both of them. Wan-liss and Dobias (2007) suggested that the dynamical proper-ties of the DST index, in particular the variations between quiet and storm times, are consistent with nonequilibrium phase transition-like dynamics. Similar analyses were per-formed for substorms (Ukhorskiy et al., 1997; Sitnov et al.,
Correspondence to: P. Dobias
2001; Uritsky and Pudovkin, 1998; Lui et al., 2001). If sub-storms did indeed feature critical behavior, this might ex-plain ongoing disagreements as to the substorm trigger, with some observations pointing to a near-earth trigger such as field-line resonances (Samson et al., 2003) and other obser-vations pointing to the near-earth neutral line (NENL) and braking of earthward flows (Shiokawa et al., 1997) as the cause. Similarly, it would explain sometimes contradictory evidence as to the relationship between the solar wind dy-namics and storms (Wanliss and Weygand, 2007).
In this paper, the properties of the storm (Sym-H) and sub-storm (AE and AL) indices (see Sect. 2) are explored with regard to intermittency to further explore the possibility of the presence of critical behaviour. The Sym-H index is a rep-resentative of the low-latitude and the AE and AL indices of the high-latitude geomagnetic disturbances. To establish whether it is likely that storms and substorms are fractal pro-cesses the three indices are tested for a presence of the power-law relationship between the size and the frequency of occur-rences of such events.
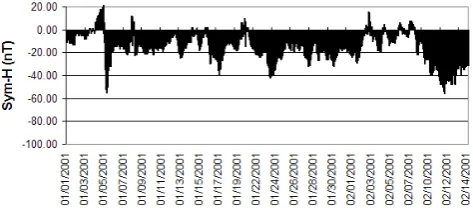
Fig. 1. SYM-H index for the period between 1 January and 15 February 2001 (collected at 1 min intervals). Only negative values are shown.
magnetospheric indices in order to establish a possibility of the presence of critical behaviour in the magnetosphere.
The paper is organized as follows. At first, the data sources are discussed, then a brief summary of intermittency and fractal point processes, as well as the classification of point processes in terms of intermittency are presented. Following this, the frequency distribution of the indices is analyzed to establish the related fractal nature of storms and substorms. Afterwards, the intermittency of the Sym-H, AE, and AL in-dices is analyzed, and the results are interpreted in terms of point processes. Finally, the fractal nature of storms and sub-storms is compared, and the implications of the findings are discussed.
2 Data
The data used in this study comprise sources from low and high-latitudes. For low-latitudes the SYM-H index, one of the important space storm indices, is utilized. This is the 1-min high-resolution version of DST (Wanliss and Showalter, 2006). This index is considered to reflect variations in the intensity of the symmetric part of the ring current that cir-cles Earth at altitudes ranging from about 3 to 8 Earth radii (RE), and is proportional to the total energy in the drifting
particles that form the ring current (Dessler and Parker, 1959; Sckopke, 1966). The index is formed from magnetic obser-vatories close enough to the magnetic equator that they are not strongly influenced by auroral current systems. Second, they are far enough away from the magnetic equator so that they are not significantly influenced by the equatorial elec-trojet current that flows in the ionosphere. They are also rel-atively evenly spaced in longitude. The convolution of their magnetic variations forms the SYM-H index, measured in nT, which is considered to provide a reasonable global esti-mate of the variation of the horizontal field near the equator. In the sense that they are constructed from multiple mag-netometer stations spanning 360 degrees in longitude, SYM-H indices can be considered global geomagnetic activity in-dicators. However, they represent rather localized effects in
of SYM-H is 1 min. The other two indices used are AL and AE that characterize high latitude dynamics relevant for sub-storms. There are actually four auroral electrojet indices: Auroral Lower (AL) Auroral Upper (AU), the other two are the linear combination of previous ones: AE=(AU−AL)/2; AO=(AU+AL)/2. In this paper we use the AE and AL dices. The AL index in particular is the most suitable in-dex for studying the dynamics of magnetospheric substorms. With these two different types of data, one clearly related to storms and the other to substorms, it is possible to gain some understanding of the behaviour of certain magnetospheric variations, and to capture a measure of the magnetospheric fluctuations from the low- to high-latitudes to which they map along magnetic field lines. The data used in the anal-ysis covered the period from 1 January to 15 February 2001. During this period the magnetosphere was in a slightly per-turbed state with few periods of storms activity (Fig. 1), and a number of substorms (Figs. 2, 3). Furthermore, there ap-pears to be a significant degree of correlations between the two indices for the analyzed period.
3 Stochastic point processes and intermittency
Natural processes with a long-term memory require a math-ematical description with fractal (power-law) statistics. This includes processes in physics, biology, and medical sciences (Bickel, 1999). Two classes of such discrete processes that are of potential interest here are the fractal point process (FPP) (Lowen and Teich, 1995) and the fractal rate point pro-cess (FRPP) (Thurner et al., 1997).
In general, a point process is defined as a representation of a sequence of events on a time line. The methodology used below applies to stationary point processes, which are defined as point processes independent of the time origint0. In terms of distributionsN (t, t+T ):
Fig. 2. AL index for the period between 1 January and 15 February 2001 (collected at 1 min intervals).
or possibly sharp increases (decreases) in AE and AL indices during substorms and SYM-H index during storms as is dis-cussed in this paper.
The definition of the intermittency used in this paper (Bickel, 1999) is applicable to critical systems, and is dif-ferent from the definition typically used by the turbulence community (see e.g. Stepanova et al., 2003). However, this not represent a major limitation, since this paper does not address the relationship between the turbulence and critical-ity. Bickel (1999) proposed the use of the correlation co-dimension as a measure of intermittency. The method of cal-culation applicable to the casualty numbers is briefly sum-marized here. The correlation co-dimensionC2is related to the second moment of the counting processN via a power law:
D
N2(T )E∼T2−C2 (2)
The correlation co-dimension values range between 0 and 1. The value of 0 corresponds to a non-intermittent (continuous) process, while the value of 1 corresponds to maximum inter-mittency (a solitary event). Typical intermittent processes have values between the two extremes which implies that they are fractal processes. The co-dimension is calculated as follows.
It is assumed that there is an experimental time series
Z1, Z2, . . . , Znsampled at time stepsT0. At first, a counting process is created:
Nk = k
X
i=1
Zi, k=1,2, . . . , n (3)
Afterwards, the variance
N2(T ) at times T=kT0 is estimated using maximum-overlap estimator Sk for all
k=1,2, . . . , kmax≤n:
Sk=
D
Nk2(kT0) E
= 1
n−k+1
n−k+1 X
j=1
Nj+k−Nj
2 (4)
[image:3.595.309.549.553.654.2]Finally, the value of 2−C2is estimated from the regression of the slope of logSk vs. logkT0. For FPPs the co-variance
Fig. 3. AE index for the period between 1 January and 15 February 2001 (collected at 1 min intervals).
can be related to the Fano factor, defined as the ratio of the variance to the mean:
F (T )≡ D
N2(T )
E −
D
N (T )
E2
D
N (T )E
=Tα (5)
Comparison with Eq. (2) yields equation connecting co-dimension with Fano factor:
α=1−C2 (6)
On the other hand, for FRPPs Eq. (6) does not hold for FRPP. If there are long-term correlations present in the time series (such as for fractional Brownian motion, or for critical sys-tems), the Fano factor is related to the Hurst coefficientH
(Hurst, 1951) as (Bickel, 1999):
H =1+α
2 (7)
Equation (7) only makes sense ifH >0.5, hence the require-ment for the correlated system.
The Fano factor can be estimated in a fashion similar to the calculation for the co-dimension. For an experimental time seriesZ1, Z2, . . . , Znthe counting process (3) is used to es-timate the Fano factor using maximum overlapping windows (Bickel, 1999):
Fk = 1
1/(n−k+1)Pn−k+1
j=1 Nj+k−Nj
×
× (
1
n−k n−k+1
X
j=1
Nj+k−Nj2−
1
(n−k)(n−k+1)
"n−k+1 X
j=1
Nj+k−Nj
#2)
(8)
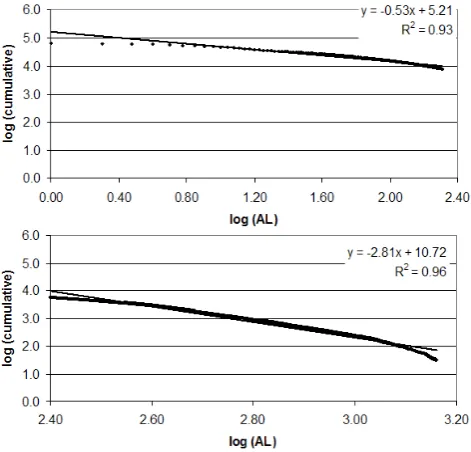
Fig. 4. Magnitude-frequency distribution for the AL index over −800 nT (quiet – top) and less than−800 nT (bottom).
Thus, the relationship betweenC2andαcan be used to de-termine the class of point process, and for correlated systems
Hcan be estimated.
4 Intermittency and criticality
The idea of a connection between criticality, especially in the context of self-organized criticality, and intermittency is not new, and has been discussed in a number of papers (Con-toyiannis and Diakonos, 2000; Halley et al., 2004; Murin et al., 1997). The fractal stochastic processes are typically char-acterized by a power-law size frequency distribution, related to the presence of long term memory in the system. How-ever, power-law size frequency distributions are also typi-cal for crititypi-cal systems (Bak, 1988; Turcotte, 1997) in which case they are related to the breakdown of scale separation (the dynamical changes reach across spatial and temporal scales). Thus the intermittent behaviour seems to imply the approach of the system to criticality (Contoyiannis and Di-akonos, 2000).
Furthermore, the power-law distribution implies the pres-ence of long-term memory in the system. This is likely to lead to either persistence or anti-persistence in the sys-tem, and in turn to the presence of non-integer intermittency (0<C2<1). Transition from a random to a correlated state was actually observed during the active periods in theDst
index (Wanliss and Dobias, 2007). A system in which anti-persistent behaviors dominates is likely to feature a higher intermittency, since the events are much sparser, and the nor-mal behaviour is no activity. On the other hand, the
persis-unlike critical systems, does not lead to a complete reorgani-zation of the system. In the context of high-latitudes, these kind of behaviors would refer to pseudo-breakups. These are high-latitude energy reorganizations that nevertheless do not progress to become full magnetospheric substorms. For anti-persistent systems (H <0.5) it is impossible to satisfy Eq. (7).
5 Size-frequency distribution of AE, AL, and SYM-H indices
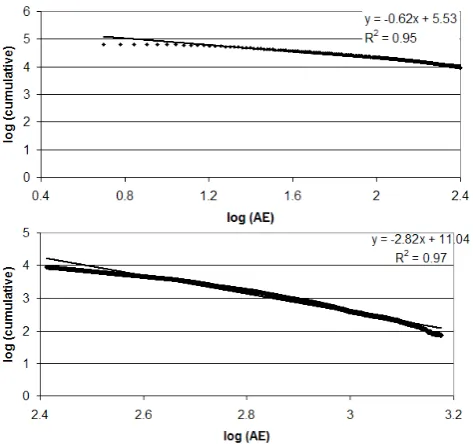
As mentioned in Sect. 3, fractal processes are characterized by fractal (inverse power-law) size-frequency distributions. This means that the numberN (M)of events with magnitude of at leastMscales as
N (M)=3M−b (9)
Equation (9) can be alternatively expressed as a log-log rela-tionship
logN (M)=a−blogM (10)
Fig. 5. Magnitude-frequency distribution for the AE index under 800 nT (quiet – top) and over 800 nT (bottom).
6 Intermittency of storms and substorms
As discussed in Sect. 4, there is possibly a relationship be-tween intermittency and criticality. In this paper the inter-mittency in storm and substorm activity expressed in terms of SYM-H, AL, and AE indices is analyzed. The results are qualitatively similar for both storms and substorms.
6.1 Storms
On the basis of variations in the nature of long-term cor-relations between magnetospheric storms and quiet times, Wanliss and Dobias (2007) suggested that at the moment of a storm intensification stage the magnetosphere undergoes a kind of non-equilibrium phase transition. This finding is consistent with the observations made for the SYM-H index as outlined in the previous section. To further corroborate this possibility, the intermittency was estimated at first for the entire period of 1 January–15 February 2001, and then it was estimated separately for the times with SYM-H<−30 nT and SYM-H>−30 nT (quiet times). For the analyzed period there were about half a dozen of short storms, and one pro-longed storm.
For the entire period, and for the quiet time the value for the co-dimension was found to be extremely low, with
C2=0.03. This suggests that the magnetospheric dynam-ics during this period was very uniform. The Fano factor for the entire analyzed period, and for the quiet times was
α=0.81. For the perturbed period, the co-dimension was
C2=0.09. While this implies relatively low intermittency, this was likely caused by the relatively limited storm
activ-Fig. 6. Magnitude-frequency distribution for the Sym-H index over −30 nT (quiet – top) and less than−30 nT (bottom).
ity, mainly focused in one long storm. The Fano factor was slightly higher than for the quiet times,α=0.89, suggesting a high degree of correlations in the activity. Furthermore, while for the quiet periods the relationship (6) between the co-dimension and the Fano factor did not hold, for the storms it was satisfied, suggesting that the storms might fall to the category of FPPs.
While the change in the intermittency between quiet and stormy periods is not too dramatic, the fact that there is a dif-ference in the relationship between the co-dimension and the Fano factor suggests that the magnetosphere is in a different statistical state during quiet times than during storms, which is consistent with the findings of Wanliss and Dobias (2007). To account for the fact that storms happen at the timescale of days (rather than hours, as is the case with substorms), an additional analysis was performed using hourly data. In this case the index values were more intermittent, withC2=0.17 for the entire timeseries. The Fano factor wasα=0.55. The low value of the Fano factor suggests that the quiet time val-ues are fairly random. The storms were more intermittent, with the values of C2=0.25, and the Fano factor α=0.74. Again, this is consistent with Eq. (6) for an FPP. Thus there is a qualitative agreement between the 1-min and 60-min data. 6.2 Substorms
[image:5.595.308.545.64.291.2]riods. The limit value for the analysis was taken from the break point of the power-law distribution, and was set to be 800 nT for the AE, and−800 nT for the AL index. The sub-storm activity was fairly intermittent, with the values for the co-dimension being 0.56 for the AL and 0.68 for the AL in-dex. The Fano factor was 0.47 for the AE, and 0.31 for the AE index. In both cases the Fano factor values are very close to the values predicted by Eq. (6). Thus, like storms, the substorms seem to behave as the FPPs, while the quiet times deviate from the characteristics of the FPPs.
7 Storms and substorms as point processes
The results for the intermittency of storms and substorms in Sect. 6, especially the consistency of the co-dimensionC2 and Fano factorαwith Eq. (6), suggest that both storms and substorms behave consistently with the expectations for the FPPs. In 1-min data the intermittency of the storms for the observed period was fairly low, likely related to the fact that the storm activity takes place over days rather than hours. This claim is further supported by much higher values for the intermittency in 60-min data. In 1-min data, the substorm activity was much more intermittent when than the storm ac-tivity. This difference suggests that there is likely no direct relationship between the storm and substorm activity for the observed period. On the other hand, the commonality of the transition to an FPP for both storms and substorms suggests that there might be a similar underlying (phase transition-like) dynamics for both types of processes.
For all three indices the values of the Fano factor, and in particular the increase in the values of the Fano factor for the perturbed periods suggest that there are strong temporal correlations in the magnetospheric system in a wide range of latitudes. However, it is impossible to use Eq. (7) to esti-mate the value of the Hurst coefficient, since both the storms and substorms behave as a FPP rather than a FRPP. For the storms, much more detailed analysis of the long term corre-lations has been done by Wanliss et al. (2005) and Wanliss and Dobias (2007). The latter work (Wanliss and Dobias, 2007) suggests that at least for the storms the perturbed peri-ods are indeed characterized by a high degree of correlations. Conversely, the quiet periods are characterized by almost no correlations (they seem to be driven by the white noise). The correlations of the indices for the storms and substorms have
properties, both storms and substorms have some common properties. While the substorm activity for the analyzed pe-riod was much more intermittent, the values of the Fano fac-tor for both sfac-torms and subsfac-torms were consistent with the relation between the Fano factor and the co-dimension valid for the FPP. The results suggest a correlated behaviour dur-ing both storms and substorms. This factor, combined with the scaling properties between the size of events and their frequency, suggests that both storms and substorms function in a way consistent with the behavior of critical systems.
of self-organized criticality (Dickman et al., 1998; Griffiths, 1972). It is now becoming clearer that in terms of their sta-tistical behavior storms and substorms are similar in many ways, though macroparameters and drivers appear so dissim-ilar.
This present study suggests further that there is a strong similarity between the critical nature of storms and sub-storms. This leads to a question: is there a common un-derlying dynamics? Many examples exist to distinguish the physics of storms and substorms, yet the observations made in this paper suggest that they may be in a similar class of physical processes. If the magnetosphere is in a critical or near-critical state, and has consistently similar statistical be-haviors at low- and high-latitudes, then the search for univer-sal parameters, such as energy or entropy, may be a step in the right direction. Future research could also address corre-lations between scaling of solar wind characteristics, as well as analyze longer time periods.
Acknowledgements. The authors would like to thank both reviewers
for insightful and valuable comments.
Topical Editor R. Nakamura thanks M. Stepanova and another anonymous referee for their help in evaluating this paper.
References
Angelopoulos, V., Mukai, T., and Kokubun, S.: Evidence for in-termittency in Earth’s plasma sheet and implications for self-organized criticality, Phys. Plasmas, 6, 4161–4168, 1999. Bak, P., Tang, C., and Wiesenfeld, K.: Self-organized criticality,
Phys. Rev. A, 38, 364–374, 1988.
Bargatze, L. F., Baker, D. N., McPherron, R. L., and Hones, E. W.: Magnetospheric response to the IMF: substorms, J. Geophys. Res., 90, 6387–6394, 1985.
Bickel, D. R.: Estimating the Intermittency of Point Processes with Applications to Human Activity and Viral DNA, Physica A, 265, 634–648, 1999.
Contoyiannis, Y. F. and Diakonos, F. K.: Criticality and intermit-tency in the order parameter space, Phys. Lett. A, 268, 286–292, 2000.
Dessler, A. J. and Parker, E. N.: Hydromagnetic theory of geomag-netic storms, J. Geophys. Res., 64, 2239–2252, 1959.
Dickman, R., Vespignani, A., and Zapperi, S.: Self-organized crit-icality as an absorbing-state phase transition, Phys. Rev. E, 57, 5095–5105, 1998.
Dobias, P.: Self-Organized Criticality in Asymmetric Warfare, Fractals, 17, 1–7, 2009.
Dobias, P., Voronkov, I. O., and Samson, J. C.: On the Nonlinear Plasma Instabilities During the Substorm Expansive Phase On-set, Phys. Plasmas, 11, 2046–2053, 2004.
Dobias, P., Wanliss, J. A., and Samson, J. C.: Nonlinear Stability of the Near-Earth Plasma sheet during substorms: February 9, 1995 event, Can. J. Phys., 84, 1029–1047, 2007.
Griffiths, R. B.: Rigorous Results and Theorems, in: Phase Transi-tions and Critical Phenomena, edited by: Domh, C. and Green, M. S., Academic Press, vol. 140, 1972.
Halley, J. D., Warden, A. C., Sadedin, S., and Li, W.: Rapid self-organized criticality: Fractal evolution in extreme environments,
Phys. Rev. E, 70, 036118, doi:10.1103/PhysRevE/70.036118, 2004.
Hurst, H. E.: Long-term storage capacity of reservoirs, Trans. Am. Soc. Civ. Eng., 116, 770–808, 1951.
Kantelhardt, J. W., Koscielny-Bunde, E., Rego, H. H. A., Havlin, S., and Bunde, A.: Detecting Long-range Correlations with De-trended Fluctuation Analysis, Physica A, 295, 441–454, 2001. Lui, A. T. Y.: Multifractal and intermittent nature of substorm
as-sociated magnetic turbulence in the magnetotail, J. Atmos. Sol. Terr. Phys., 63, 1379–1385, 2001.
Lowen, S. B. and Teich, M. C.: Estimation and Simulation of Frac-tal Stochastic Point Processes, FracFrac-tals, 3, 183–210, 1995. Murin, Yu., Ghetti, R., and Jakobsson, B.: Intermittency as a
sig-nal of criticality in multifragmentation studies, Phys. Rev. C, 55, 528–531, 1997.
Samson, J. C., Rankin, R., and Tikhonchuk, V. T.: Optical signa-tures of auroral arcs produced by field line resonances: compari-son with satellite observations and modeling, Ann. Geophys., 21, 933–945, 2003,
http://www.ann-geophys.net/21/933/2003/.
Sckopke, N.: A general relation between the energy of trapped par-ticles and the disturbance field near the Earth, J. Geophys. Res., 71, 3125–3130, 1966.
Shiokawa, K., Baumjohann, W., and Haerendel, G.: Braking of High-Speed Flows in the near-Earth Tail, Geophys. Res. Lett., 24, 1179–1182, 1997.
Sitnov, M. I., Sharma, A. S., Papadopoulos, K., and Vas-siliadis, D.: Modeling substorm dynamics of the magneto-sphere: From self-organization and self-organized criticality to nonequilibrium phase transitions, Phys. Rev. E 65, 016116, doi:10.1103/PhysRevE/65.016116, 2001.
Stepanova, M. V., Antonova, E. E., and Troshichev, O.: Intermit-tency of magnetospheric dynamics through non-Gaussian distri-bution function of PC-index fluctuations, Geophys. Res. Lett., 30, 1127, doi:10.1029/2002GL016070, 2003.
Stepanova, M. V., Antonova, E. E., Foppiano, A. J., Rosenberg, T. J., and Ovalle, E.: Intermittency of riometer auroral absorp-tion observed at South Pole, J. Atmosph. Solar-Terrestrial Phys., 67(17–18), 1876–1884, doi:10.1016/j.jastp.2004.11.016, 2005. Stepanova, M. V., Antonova, E. E., Foppiano, A. J., and
Rosen-berg, T. J.: Intermittency in the auroral absorption fluctuations as manifestation of magnetospheric turbulence, Adv. Space Res., 67, 1816–1884, doi:10.1016/jasr2005.04.112, 2005.
Thurner, S., Lowen, S. B., Feurstein, M. C., Heneghan, C., Fe-ichtinger, H. C., and Teich, M. C.: Analysis, Synthesis, and Es-timation of Fractal-Rate Stochastic Point Processes, Fractals, 5, 565–595, 1997.
Turcotte, D. L.: Fractals and Chaos in Geology and Geophysics, 2nd ed., Cambridge Univ. Press, Cambridge, UK, 1997. Ukhorskiy, A. Y., Sitnov, M. I., Sharma, A. S., and Papadopoulos,
K.: Global and multi-scale features of solar wind-magnetosphere coupling: From modeling to forecasting, Geophys. Res. Lett., 31, L08802, doi:10.1029/2003GL018932, 2004.
Uritsky, V. M. and Pudovkin, M. I.: Low frequency 1/f-like fluc-tuations of the AE-index as a possible manifestation of self-organized criticality in the magnetosphere, Ann. Geophys., 16, 1580–1588, 1998.