A b s t r a c t. The research presents spatial characteristics of water conductivity in the arable layer of Polish soils. It was found that the lowest water conductivity is 0.00087 cm day–1and the highest – 5900 cm day–1. Due to the considerable differentiation of water conductivity in the surface layer of the Polish arable soils, comprehensive spatial characteristics with a division into high, medium and low water conductivity was not possible.
K e y w o r d s. water conductivity, Polish arable soils
INTRODUCTION
Water retention and water permeability in both satura-ted and unsaturasatura-ted zones not only shape soil water balance but also decide the conditions for plant growth, development and yield. They also determine water availability for the plant root system and the transfer of water with chemical compounds dissolved into deeper soil layers. The above compounds are nutrients indispensable for plant growth and all kinds of other chemical substances which pose a threat to the environment. Water conditions in soil exerts a decisive influence on the thermal and mechanical properties which shape the temperature in the soil profile and conditions the efficiency of the agro-technical mechanical treatments applied. A knowledge of hydro-physical properties is ne-cessary for the interpretation and forecasting of practically all physical, chemical and biological processes which occur in soil since the modelling of these processes requires representative data on the soil hydro-physical characteri-stics [4–6,8]. The conductive properties of soils depend greatly on texture and structure. At saturation, the most con-ductive soils are those in which large and continuous pores constitute most of the overall pore volume, whereas the least conductive are soils in which the pore volume consists of numerous micropores. Thus, it is well known that a saturated
sandy soil conducts water more rapidly than a clayey soil, and a well-aggregated soil conducts more than a poorly ag-gregated or dispersed soil. However, the very opposite is often the case when unsaturated conditions prevail. In soil with large pores, these pores are quickly emptied and become non-conductive as suction develops, thus steeply decreasing the initially high conductivity. In soil with small pores, on the other hand, many of the pores retain and con-duct water even at appreciable suction, so that the hydraulic conductivity does not decrease as steeply and may actually exceed that of a soil with large pores subjected to the same suction. Most processes involving soil-water interaction in the field occur with the soil in an unsaturated condition. Unsaturated flow often entails changes in the state and con-tent of soil water, involving complex relations among such variables as soil wetness, suction, and conductivity, whose interrelations are further complicated by hysteresis. In re-cent decades unsaturated flow has become one of the most important and active topics of research in soil physics and hydrology, and this research has resulted in very significant theoretical and practical advances [5,8,10,13].
Hydro-physical soil properties are difficult to measure and require expensive specialist measuring equipment. Measuring procedures are also time-consuming. Hence, data bases on hydro-physical soil properties are scarce and scattered. These are mainly the results of studies carried out in individual research institutions. These results are difficult to interpret due to the various methods of research applied. The problem of creating a data bank of hydro-physical soil properties is very important and has been undertaken by the research commissions of the European Union [1,2,19–24, 30–32].
Spatial characteristics of water conductivity in the surface level of Polish arable soils
R. Walczak
1*, J. Ostrowski
2, B. Witkowska-Walczak
1, and C. S³awiñski
11Institute of Agrophysics, Polish Academy of Sciences, Doœwiadczalna 4, P.O.Box 201, 20-290 Lublin 27, Poland 2
Institute for Land Reclamation and Grassland Farming, Department of Land Use, 05-090 Raszyn, Poland
Received February 25, 2002; accepted April 15, 2002
© 2002 Institute of Agrophysics, Polish Academy of Sciences *Corresponding author’s e-mail: rwalczak@demeter.ipan.lublin.pl
A
A
Agggrrroooppphhyhyysssiiicccsss
w
w
The aim of this study was to present the spatial characteristic of water conductivity in the surface (arable) layer of Polish mineral soils.
MATERIALS AND METHODS
Characteristics of the soils
The assumed aim of the research has been the charac-terisation of the hydro-physical properties of arable soils on the basis of their water conductivity for a representative set of soil profiles from the whole of Poland reflecting soil variability and diversity. The solution of the above problem required a sensible compromise between the number of the soil profiles studied and samples taken from them that would fulfil statistical criteria.
Soil division into taxonomic elementary soil units used in Polish soil systematics selects too many taxonomic units, which makes this classification not appropriate in this investigation [18]. For the above reason and also due to economic and organisational reasons, it was decided to collect samples that would allow characterisation of the more important soils that exert a significant influence on plant production conditions and are important for the improvement of arable soils. A thousand representative samples of the soil profiles located in Poland were selected with a view to fulfilling the above condition adequately to the variability and differentiation of the soil cover to be able to evaluate them and present them cartographically on maps. Data of the soil cover structure was taken from the numerical presentations collected in the study called ‘Agricultural production space of Poland in numbers’ [30]. On the basis of the taxonomic division used in the above study, the arable mineral soils were aggregated into 29 groups with similar properties (Table 1). According to the FAO classification they are: Nos 1–2: Rendzinas; No. 3: Phaeozems; Nos 4–19: Cambisols, Luvisols and Podzols, Nos 20–22: Fluvisols, Nos 23–24: Gleysols and No. 25: Histosols. The aggregated soil groups are characterised by a differentiated area of their appearance in Poland ranging from 380 to 40 980 km2. Due to the above consideration, it was necessary to establish the number of profiles to represent each of the aggregated groups so that the appropriate proportions were observed. The studies carried out showed that the minimum number of samples in one population was 20, since with this amount of profiles the coefficient of variability of the more important properties of the selected soil units under studies became stabilised.
The next step was to solve the problem of localisation of the soil profiles studied. This required a knowledge of basic attributes such as:
• cartographic mapping of the soil cover structure in the form of a soil map,
• surface representation of the soil units in the structure of the soil cover of Poland.
The analysis carried out showed that the only available source of information for working out the location layout of the soil profiles studied, was a previous paper by Witek [30]. It included a surface structure of the aggregated soil groups according to the complexes of agricultural usability in the areas of individual districts (according to the administrative division of Poland before 1975). Hence, the structure of the spatial distribution of the profiles studied was created from the indications of which soil unit samples should be taken from individual districts, and the number of profiles which should represent them. Due to the morphological diversity of the soil profile structures and differentiated sequences of soil levels, their cartographic presentation of properties was based on the division of the soil profile into three levels for the sake of uniformity in the method of map preparation: – a level defined as a surface level referring to the arable –
humus level,
– a level defined as a subsurface level (sub-arable) that can be distinguished by the predominance of mineralisation processes of the organic matter which gets into it, – a level defined as subsoil, with predominating natural
features of the mineral soil substrate.
Following the above methodological assumptions, field experiments were carried out and documented: the location of the soil profile studied on the topographical map, morphological description of the soil features, soil samples with an undisturbed structure were placed into cylinders with a capacity of 100 cm3and a height of 5 cm from the more significant diagnostic levels in the surface layer (arable), subsurface layer (sub-arable) and from the subsoil. The documentation and soil material so-obtained was then used for setting up a bank of soil samples [3,11,12,17,26]. Two hundred-and-ninety profiles were then chosen out from the soil samples collected in the bank. The profiles chosen represented generalised soil units subjected to the testing of hydro-physical soil properties, in particular, water conductivity of the surface layer as conductive properties of this layer are decisive for the water balance of the whole soil profile and surface outflow as well as on the mass and energy exchange in the continuum soil-plant-atmosphere [14–16, 27–29].
Measuring methods
Generalized soil units
Water conductivity (cm day–1) in value intervals at chosen soil water potentials
pF 0 pF 2.2 pF 3
1 2 3 4
1. Rendzinas pure >1000 0.05–0.1 0.0005–0.001
2. Rendzinas mixed 5–500 0.05–0.1 0.001–0.005
3. Chernozems 500–1000 0.1–0.5 0.001–0.005
4. Brown, rusty and podzolic soils derived from weakly loamy sands and loose sands
>1000 0.05–0.1 0.001–0.005
5. Brown, rusty and podzolic soils derived from weakly loamy sands and light loamy sands
5–500 0.1–0.5 0.001–0.005
6. Brown and pseudopodzolic soils derived from loamy sands
500–1000 0.1–0.5 0.005–0.001
7a. Brown soils derived from loamy sands lying on heavier substrate
500–1000 0.1–0.5 0.001–0.005
7b. Pseudopodzolic soils derived from loamy sands lying on heavier substrate
500–1000 0.1–0.5 0.001–0.005
8a. Brown soils derived from light loam 5–500 0.1–0.5 0.001–0.005
8b. Pseudopodzolic soils derived from light loam
>1000 0.1–0.5 0.005–0.01
9a. Brown soils derived from medium loam
500–1000 0.05–0.1 0.001–0.005
9b. Pseudopodzolic soils derived from medium loam
500–1000 0.1–0.5 0.001–0.005
10. Brown and pseudopodzolic soils derived from heavy loam
>1000 0.01 -0.05 0.001–0.005
11. Brown and pseudopodzolic soils derived from shallow loam on light substrate
>1000 0.01–0.05 0.001–0.005
12. Brown and pseudopodzolic soils derived from gravel
>1000 0.05–0.1 0.001–0.005
13a. Brown soils derived from silts of water origin
>1000 0.1–0.5 0.001–0.005
13b. Pseudopodzolic soils derived from silts of water origin
5–500 0.1–0.5 0.005–0.01
14. Brown and pseudopodzolic soils derived from loess and loesslike materials
>1000 0.1–0.5 0.001–0.005
15. Brown and pseudopodzolic soils derived from clays
>1000 0.01–0.05 0.001–0.005
16. Brown and pseudopodzolic soils derived from lithic rocks-loamy and skeleton-loamy
>1000 0.1–0.5 0.001–0.005
17. Brown and pseudopodzolic soils derived from lithic rocks-loamy
500–1000 0.05–0.1 0.001–0.005
cover for 24 h in order to reach a state of thermodynamic equilibrium. Then the samples were uncovered and their hu-midity level and soil water potential was monitored during evaporation. The TDR gauge was linked to a PC which made automatic measurements possible, and the values of humi-dity and water potential taken were recorded on the compu-ter carrier. The measurements of the dynamics of soil profile humidity levels and the soil water potential levels obtained, rendered possible the coefficient of water conductivity, among other things.
Assuming that the process of water movement is one-dimensional and takes place in isothermal conditions, the one-dimensional Darcy equation can be used for the calculation of the water conductivity coefficient [5,7,8]:
( )
( )
( )
q z t k z t
z
, =- æ ,
-è
çç öø÷÷ Q ¶Y
¶ 1 , (1)
and the equation that make calculation of fluxes from the experimental data possible:
( )
( )
q z t z t
t dz z
, =-ò¶ ,
¶ Q 0
. (2)
Comparing the above equations, we arrive at a relation that makes determination of water conductivity possible:
( )
( )
( )
k z t t dz z t z z Q Q Y = ò -¶ ¶ ¶ ¶ , , 0 1 (3)where:q(z,t) – water flux running in a given time through a selected surface of a soil sample (cm day–1);k(Q) – water conductivity coefficient (cm day–1);Q(z,t) – water content
in the chosen layer of the soil sample in the selected time period (v/v);Y(z,t) – soil water potential in a chosen layer of soil sample within a selected time period (cm H2O).
RESULTS
Characteristics of water conductivity in the surface layer of the Polish arable soils
The values obtained for water conductivity in soil sam-ples belonging to individual soil units were subordinated to three-percent intervals. Such a subordination of the study results helped to carry out comparative analysis of the property studies both in relation to water conductivity and recognition of factors conditioning its variability and diffe-rentiation. The above analysis proved that water conduc-tivity showed a considerable differentiation in relation to soil units ranging from 0.00087 to 5900 cm day–1.
The water conductivity of the arable layers was inves-tigated at various moisture levels expressed as soil water potential with the following values:
– 0.1 kJ m–3(pF 0) – water saturation, – 16 kJ m–3(pF 2.2) – field water capacity,
– 100 kJ m–3(pF 3) – beginning of plant growth inhibition. Thekcoefficient reached the following values for the arable layer of the soils studied:
– for 0.1 kJ m–3(pF 0) – above 5 cm day–1, – for 16 kJ m–3(pF 2.2) – from 0.01 to 0.5 cm day–1, – for 100 kJ m–3(pF 3) – below 0.01 cm day–1.
Values of the k coefficient were divided into three intervals (representing the above mentioned soil water potential levels). The above results as well as the results of water conductivity measurement were then related to Generalized soil units
Water conductivity (cm day–1) in value intervals at chosen soil water potentials
pF 0 pF 2.2 pF 3
1 2 3 4
18. Brown and pseudopodzolic soils derived from lithic rocks-clayey
>1000 0.01–0.05 0.001–0.005
19. Brown and pseudopodzolic soils derived from lithic rocks-silty
5–500 0.05–0.1 0.001–0.005
20. Heavy alluvial soils 500–1000 0.01–0.05 0.001–0.005
21. Light and very light alluvial soils 500–1000 0.1–0.5 0.001–0.005
22. Light and medium alluvial soils >1000 0.01–0.05 0.001–0.005
23. Black earth >1000 0.05–0.1 0.001–0.005
24. Black earth derived from sands 500–1000 0.1–0.5 0.001–0.005
25. Moorsh soils >1000 0.1–0.5 0.001–0.005
generalised soil units. The results of subjecting soil units to individual intervals have been presented in Table 1. The analysis of data obtaned did not point to any correlation between the k coefficient and such soil properties as granulometric distribution, humus content and type of pa-rent material.
At water saturation of the arable layer, the predominant part of the soils showed the highest level of water conduc-tivity (k> 1000 cm day–1). Rendzinas (pure), soils derived from loose sands and weakly clayey sand or clays, moorsh soils also belong to the above group. The lowest water conductivity (5 <k< 500 cm day–1) was also characteristic of soils with extremally different granulometric composi-tion and other properties. The soil derived from weak clayey sands and light clays as well as pseudopodzolic soils derived from silts of water origin also belong to this latter group. Whereas brown soils derived from the same formation (parent material) are characterised by the highest values of this coefficient (k> 1000 cm day–1).
At the soil water potential representing field water capacity (pF 2.2), most of the soil units are also characterised by the relatively highest values of the coefficientk(0.1 <k< 0.5 cm day–1). Most often these are soil units different to previous cases. For example, light and medium alluvial soils as well as clayey soils at saturation level (pF 0) had the highest values of the water conductivity coefficient, and at pF 2.2, the lowest obtained values. The lightest soils derived from loose sands and weak, clayey sands are characterised by a similar property. Whereas brown loess soils, moorsh soils are characterised by the highest water conductivity at both values of the soil water potential.
At the soil water potential (pF 3) representing the be-ginning of the inhibition of plant growth, a predominant number of soil units fell into a group with 0.001 <k< 0.005 cm day–1. Only one soil unit (pure rendzinas) is cha-racterised by the lowestkcoefficient value in this soil hu-midity condition, and three soil units are characterised by the highest value of this coefficient.
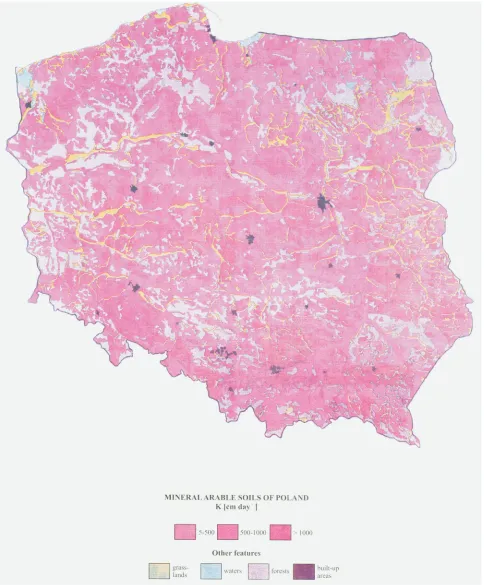
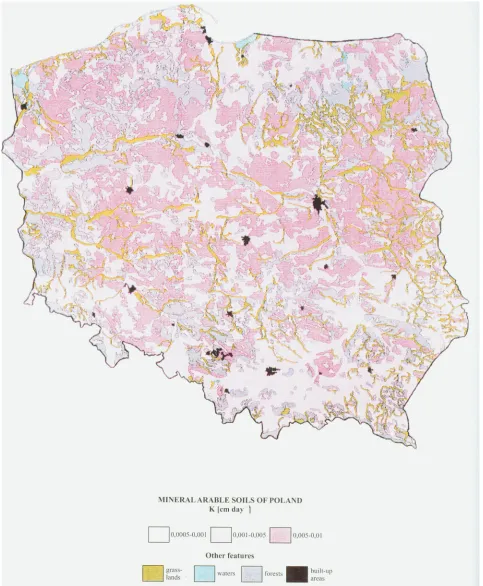
Cartographic presentation of soil water conductivity in the arable layer
The variability and differentiation of water conductivity at individual water capacity levels which represent soil water potential expressed in the pF units, have been presented in maps (Figs 1–3). The maps were prepared by computer technology combining research results on thek coefficient with the content of arable soil map in a scale of 1:1 000 000. The soil-cartographic data base contains a digital record of the map [11,12].
Analysis of the maps enclosed proved that the highest variability and spatial differentiation was found in the case of water conductivity of that arable layer at saturation. The lowest variability of thekcoefficient was observed at field
water capacity (pF 2.2). On the background of areas with increasedkvalues, the mountain region of the Karpaty range with medium values of the water conductivity coefficient can be distinguished and the river valleys of the Vistula and the Odra Rivers with their inlets characterised by the lowest values of this coefficient. In the case of water capacity repre-senting water potential pF 3, the cartographic presentation of the distribution of soils with various values ofkforms a two-element structure with the highest homogeneity in the southern sub-mountain and mountain regions of Poland.
Due to the fact that at various values of soil water po-tential, the coefficient of water conductivity of the same soils belongs to different groups of water conductivity, it was impossible to carry out a comprehensive characteri-sation of the soils and divide them into soils with high, me-dium or low water conductivity.
CONCLUSIONS
On the basis of the studies presented and maps con-structed on their basis, it is possible to draw the following conclusions:
1. Water conductivity coefficients of the surface layer of the arable Polish soils show a considerable differentiation in relation to soil units ranging from 0.00087 to 5900 cm day–1. 2. Water conductivity of the surface layer of the Polish soils was characterised by the highest spatial variability and differentiation at saturation level, and the lowest variability of the water conductivity coefficient at FWC.
3. No relation was found between the values of the water con-ductivity coefficient and such properties of the surface soil layer of the Polish soils as: granulometric distribution, pa-rent material, humus content and specific surface area.
4. Due to a significant differentiation of water conduc-tivity at various soil water potentials in the surface layer of the Polish soils, its comprehensive spatial characteristics with a division into areas of high, medium or low water con-ductivity was not possible.
REFERENCES
1. Batjes N.H., 1996.Develepment of a world data set of soil water retention properties using pedotransfer rules. Geoderma, 71, 31–52.
2. Dune K.A. and Willmott C.J., 1996.Global distribution of plant-extractable water capacity of soil. Intern. J. Climatology, 16, 841–859.
3. Gliñski J., Ostrowski J., Stêpniewska Z., and Stêpniewski W., 1991. Soil sample bank representing mineral soils of Poland (in Polish). Problemy Agrofizyki, 66, 1–61.
4. Gliñski J., Stêpniewski W., Stêpniewska Z., W³odarczyk T., and Brzeziñska M., 2000. Characteristics of areation properties of selected soil profiles from Central Europe. Int. Agrophysics, 14, 17–32.
6.Jong R. de., 1982.Assessment of empirical parameters that decribe soil water characteristics. Canadian Agricultural Engi-neering, 24, 65–70 .
7.Kutilek M. and Nielsen D., 1994.Soil Hydrology. Catena Verlag, Cremlingen-Destedt.
8.Kutilek M. and Novak V., 1998.Exchange of water in the soil-plant-atmosphere system. Int. Agrophysics, 12, 33–28. 9.Malicki M., Plagge R., Renger M., and Walczak R., 1992.
Application of time-domain reflectometry (TDR) soil mini-probe for determination of unsaturated soil water characte-ristics from undisturbed soil cores. Irrig. Sci., 13, 65–72. 10.Olszta W. and Kowalski D., 1996.Verification of the van
Ge-nuchten method of determination of the hydraulic conductivity of peat soils. Int. Agrophysics, 10, 83–88.
11.Ostrowski J., 1996.Base of soil-cartographic dates – structure and use. In: Systems of space information (in Polish). Proc. V Conf. Polish Society of Space Information, 18–19.06. 1966, Warszawa, 471–480.
12.Ostrowski J., Stêpniewska Z., Stêpniewski W., and Gliñski J., 1998.Computer maps of the redox properties of arable soils in Poland. J. Water and Land Development, 2, 19–29. 13.Pachepsky Y.A. and Timlin D., 1996.Infiltration into layered
soil covered with a depositional seal: a Green-Ampt approach. Int. Agrophysics, 10, 21–30.
14.S³awiñski C. and Walczak R., 2000.Comparison of measu-red and estimated values of unsaturated water conductivity of moorsh soils (in Polish). Acta Agrophysica, 34, 181–188. 15.S³awiñski C., Walczak R., and Witkowska-Walczak B.,
2000.Water conductivity of Polish rendzinas (in Polish). Acta Agrophysica, 38, 259–266.
16.S³awiñski C., Walczak R., and Witkowska-Walczak B., 2000.Water conductivity of Polish alluvial soils (in Polish). Acta Agrophysica, 38, 281–288.
17.Stawiñski J., Gliñski J., Ostrowski J., Stêpniewska Z., Soko³owska Z., Bowanko G., Józefaciuk G., Ksiê¿opolska A., and Matyka-Sarzyñska D., 2000. Spatial characteriza-tion of specific surface area of arable soils in Poland (in Polish). Acta Agrophysica, 33.
18. System of Polish Soils, 1989.(in Polish). Roczniki Glebo-znawcze, XL, 3–4, 7–150.
19.Thomasson A.J., 1995. Assessment of Soil Water Reserves Available for Plants (SWAP): a review. In: European land information systems for agro-environmetal monitoring (Eds D.King, R.J. Jones, A. Thomasson). Institute for Remote
Sensing Applictions. Joint Research Centre. Office for Official Publications of the European Community, Luxembourg. 20. Varallyay G., 1974.Hydraulic conductivity studies on
Hun-garian salt affected soils. In: Izd. Nauka, Moscow, 1, 12–120. 21. Varallyay G., 1974.Unsaturated conductivity studies on
Hun-garian soils (in HunHun-garian). Agrokemia es Talajtan, 23, 261–296.
22. Varallyay G., 1989.Mapping of hydrophysical properties and moisture regime of soils. Agrokemia es Talajtan, 38, 800–817. 23. Varallyay G., Szucs K., Rajkai K., Zilahy P., and Muranyi
A., 1980.Soil water management categories of Hungarian soils and the map of soil water properties (1:100 000) (in Hun-garian). Agrokemia es Talajtan, 29, 77–112.
24. Varallyay G., Szucs L., Zilahy P., Rajkai K., and Muranyi A., 1983. Map of soil water management characteristics. Trans. Vth Int. Soil Sci. Conf. Prague, 1981, II, 42–51. 25. Walczak R., S³awiñski C., Malicki M., and Sobczuk H.,
1993.Measurement of water charcateristics in soils using TDR technique. Int. Agrophysics, 7, 175–182.
26. Walczak R., S³awiñski C., and Witkowska-Walczak B., 1999. Methodical aspects of data base creation of hydro-physical characteristics of Polish arable soils (in Polish). Acta Agrophysica, 22, 245–251.
27. Walczak R., S³awiñski C., and Witkowska-Walczak B., 2001.Water retention and conductivity of Polish Terric Histo-sols and Histi-Mollic GleyHisto-sols (in Polish). Acta Agrophysica, 53, 201–209.
28. Walczak R., Witkowska-Walczak B., and S³awiñski C., 2001. Water retention and conductivity of Polish Mollic Gleysols (in Polish). Acta Agrophysica, 53, 211–223. 29. Walczak R., Witkowska-Walczak B., and S³awiñski C.,
2001.Hydrophysical characteristics of Polish brown and grey-brown soils derived from lithic rocks (in Polish). Acta Agro-1physica, 57, 159–168.
30. Witek T., 1974.An agricultural productive space in numbers – Poland (in Polish). Institute of Soil Tillage, Fertility and Soil Science, Pu³awy.
31. Wosten J.H., Finke P.A., and Jansen M.J., 1995. Compa-rison of class and continuous pedotransfer functions to gene-rate soil hydraulic characteristics. Geoderma, 66, 227–237. 32. Wosten J.H.M., Lilly A., Nemes A., and Le Bas C., 1998.