I
I
I
N
N
N
T
T
T
E
E
E
R
R
R
N
N
N
A
A
A
T
T
T
I
I
I
O
O
O
N
N
N
A
A
A
L
L
L
J
J
J
O
O
O
U
U
U
R
R
R
N
N
N
A
A
A
L
L
L
O
O
O
F
F
F
R
R
R
E
E
E
S
S
S
E
E
E
A
A
A
R
R
R
C
C
C
H
H
H
I
I
I
N
N
N
C
C
C
O
O
O
M
M
M
M
M
M
E
E
E
R
R
R
C
C
C
E
E
E
,
,
,
I
I
I
T
T
T
A
A
A
N
N
N
D
D
D
M
M
M
A
A
A
N
N
N
A
A
A
G
G
G
E
E
E
M
M
M
E
E
E
N
N
N
T
T
T
A Monthly Double-Blind Peer Reviewed Refereed Open Access International e-Journal - Included in the International Serial Directories Indexed & Listed at: Ulrich's Periodicals Directory ©, ProQuest, U.S.A., Open J-Gage, India as well as in Cabell’s Directories of Publishing Opportunities, U.S.A.
C
C
C
CONTENTS
ONTENTS
ONTENTS
ONTENTS
Sr.
No.
TITLE & NAME OF THE AUTHOR (S)
Page No.
1
.
RESPONSIBILITY ACCOUNTING IN SMALL AND MEDIUM SCALE INDUSTRIES MANUFACTURING AUTO COMPONENTSANIRUDDHA THUSE & DR. NEETA BAPORIKAR
1
2
.
LIBERALIZED FINANCIAL SYSTEM AND ECONOMIC DEVELOPMENT IN NIGERIAOLOWE, OLUSEGUN
6
3
.
AN INVESTIGATION ON HIGHER LEARNING STUDENTS SATISFACTION ON FOOD SERVICES AT UNIVERSITY CAFETERIASARAVANAN RAMAN & SUBHASENI CHINNIAH
12
4
.
IDENTIFYING AND PRIORITIZING THE MAIN BARRIERS TO KNOWLEDGE MANAGEMENTDR. S. ALI AKBAR AHMADI, MOHAMAD ALI AFSHARI & HAMIDEH SHEKARI
17
5
.
PERFORMANCE EVALUATION OF PRIVATE AND PUBLIC SPONSORED MUTUAL FUNDS IN INDIANOONEY LENIN KUMAR & DR. VANGAPANDU RAMA DEVI
24
6
.
TALENT MANAGEMENT PRACTICES IN IT SECTORDR. K. JANARDHANAM, DR. NIRMALA M. & PRATIMA PANDEY
36
7
.
FREQUENT PATTERN MINING USING DYNAMIC PROGRAMMINGV. G. RAJALEKSHMI & DR. M. S. SAMUEL
41
8
.
PRICE AND LIQUIDITY CHANGES AFTER STOCK SPLITS - EMPIRICAL EVIDENCE FROM INDIAN STOCK MARKETDHANYA ALEX, DR. K. B. PAVITHRAN & EAPEN ROHIT PAUL
45
9
.
THE IMPACT OF REVERSE CULTURAL SHOCK AMONG REPATRIATESN. PADMAVATHY & DR. N. THANGAVEL
50
10
.
BRAND LOYALTY’S INFLUENCE ON WOMEN’S BUYING BEHAVIOR WITH SPECIAL REFERENCE TO PERSONAL CARE PRODUCTSR. SUNDARI & DR. M. SAKTHIVEL MURUGAN
57
11
.
ANALYSIS OF COTTON TEXTILE INDUSTRY IN KARUR DISTRICT, TAMILNADUDR. N. RAJASEKAR & M. GURUSAMY
63
12
.
ANALYSING THE TRADING ACTIVITIES OF MUTUAL FUNDS TO IDENTIFY THE TREND OF THE INDIAN STOCK MARKETM. JEEVANANTHAN & DR. K. SIVAKUMAR
69
13
.
VIABILITY OF ORGANIC PRODUCTS’ BUSINESS AMONG THE NON-ORGANIC PRODUCT CONSUMERS – A DESCRIPTIVE STUDYDR. R. DHANALAKSHMI
75
14
.
EMPLOYEES PERCEPTION TOWARDS ENVIRONMENTAL CHALLENGES: AN EMPIRICAL STUDY ON VEDANTA LTD. IN ODISHADR. B. CHANDRA MOHAN PATNAIK, DR. IPSEETA SATPATHY & DEEPAK KUMAR SINGH
79
15
.
CASH CONVERSION CYCLE AND CORPORATE PROFITABILITY – AN EMPIRICAL ENQUIRY IN INDIAN AUTOMOBILE FIRMSDR. A. VIJAYAKUMAR
84
16
.
A STUDY ON BEST PRACTICES IN FINANCIAL SERVICES AT A PUBLIC SECTOR COMPANY AT BHOPALDR. N. SUNDARAM & AJAY KUMAR SHARMA
92
17
.
AN EMPIRICAL STUDY OF FIRM STRUCTURE AND PROFITABILITY RELATIONSHIP: THE CASE OF INDIAN AUTOMOBILE FIRMSDR. A. VIJAYAKUMAR
100
18
.
PERCEPTION OF BANK EMPLOYEES TOWARDS ADOPTION OF INFORMATION TECHNOLOGY IN PRIVATE SECTOR BANKS OF INDIABINDIYA TATER, DR. MANISH TANWAR & NAVRATAN BOTHRA
109
19
.
KEY SKILLS IDENTIFICATION AND TRAINING NEED ANALYSIS @ SMALL AND MEDIUM RETAILERS IN DELHI AND NCRPOOJA MISRA, NEHA JOSHI & RAHUL GOYAL
118
20
.
STRATEGIES FOR MERGERS AND ACQUISITIONS – CASE STUDIES OF SELECTED BUSINESS HOUSESDR. PREETI YADAV & DR. JEET SINGH
127
21
.
MANAGEMENT OF NPAS IN DCCBS IN INDIA – AN EMPIRICAL ASSESSMENTDR. A. DHARMENDRAN
136
22
.
IMPACT OF MOBILE MARKETING ON THE PURCHASE DECISION OF CONSUMERS: A STUDY OF JALANDHAR REGIONHARENDRA SINGH, SALEEM ANWAR & SHUJA QAMMER SHAH
141
23
.
A STUDY ON LEADERSHIP STYLE AND THEIR IMPACT IN PUBLIC SECTOR – TAMIL NADUN. PRABHA
146
24
.
PARAMETERS OF RATING OF INDIAN COMMERCIAL BANKS – A CRITICAL ANALYSISDR. MUKTA MANI
149
25
.
IMPACT OF INTERNET BANKING ON CUSTOMER SATISFACTION: A COMPARATIVE STUDY OF PUBLIC SECTOR BANKS, PRIVATE SECTOR BANKS AND FOREIGN SECTOR BANKSRITU SEHGAL & DR. SONIA CHAWLA
156
INTERNATIONAL JOURNAL OF RESEARCH IN COMMERCE, IT & MANAGEMENT
CHIEF PATRON
CHIEF PATRON
CHIEF PATRON
CHIEF PATRON
PROF. K. K. AGGARWAL
Chancellor, Lingaya’s University, Delhi
Founder Vice-Chancellor, Guru Gobind Singh Indraprastha University, Delhi
Ex. Pro Vice-Chancellor, Guru Jambheshwar University, Hisar
PATRON
PATRON
PATRON
PATRON
SH. RAM BHAJAN AGGARWAL
Ex. State Minister for Home & Tourism, Government of Haryana
Vice-President, Dadri Education Society, Charkhi Dadri
President, Chinar Syntex Ltd. (Textile Mills), Bhiwani
CO
CO
CO
CO----ORDINATOR
ORDINATOR
ORDINATOR
ORDINATOR
AMITA
Faculty, E.C.C., Safidon, Jind
ADVISORS
ADVISORS
ADVISORS
ADVISORS
PROF. M. S. SENAM RAJU
Director A. C. D., School of Management Studies, I.G.N.O.U., New Delhi
PROF. M. N. SHARMA
Chairman, M.B.A., Haryana College of Technology & Management, Kaithal
PROF. S. L. MAHANDRU
Principal (Retd.), Maharaja Agrasen College, Jagadhri
EDITOR
EDITOR
EDITOR
EDITOR
PROF. R. K. SHARMA
Dean (Academics), Tecnia Institute of Advanced Studies, Delhi
CO
CO
CO
CO----EDITOR
EDITOR
EDITOR
EDITOR
DR. BHAVET
Faculty, M. M. Institute of Management, Maharishi Markandeshwar University, Mullana, Ambala, Haryana
EDITORIAL ADVISORY BOARD
EDITORIAL ADVISORY BOARD
EDITORIAL ADVISORY BOARD
EDITORIAL ADVISORY BOARD
DR. AMBIKA ZUTSHI
Faculty, School of Management & Marketing, Deakin University, Australia
DR. VIVEK NATRAJAN
Faculty, Lomar University, U.S.A.
DR. RAJESH MODI
Faculty, Yanbu Industrial College, Kingdom of Saudi Arabia
PROF. SANJIV MITTAL
University School of Management Studies, Guru Gobind Singh I. P. University, Delhi
PROF. ANIL K. SAINI
Chairperson (CRC), Guru Gobind Singh I. P. University, Delhi
DR. KULBHUSHAN CHANDEL
Reader, Himachal Pradesh University, Shimla
DR. TEJINDER SHARMA
INTERNATIONAL JOURNAL OF RESEARCH IN COMMERCE, IT & MANAGEMENT
DR. SAMBHAVNA
Faculty, I.I.T.M., Delhi
DR. MOHENDER KUMAR GUPTA
Associate Professor, P. J. L. N. Government College, Faridabad
DR. SHIVAKUMAR DEENE
Asst. Professor, Government F. G. College Chitguppa, Bidar, Karnataka
MOHITA
Faculty, Yamuna Institute of Engineering & Technology, Village Gadholi, P. O. Gadhola, Yamunanagar
ASSOCIATE EDITORS
ASSOCIATE EDITORS
ASSOCIATE EDITORS
ASSOCIATE EDITORS
PROF. NAWAB ALI KHAN
Department of Commerce, Aligarh Muslim University, Aligarh, U.P.
PROF. ABHAY BANSAL
Head, Department of Information Technology, Amity School of Engineering & Technology, Amity University, Noida
PROF. A. SURYANARAYANA
Department of Business Management, Osmania University, Hyderabad
DR. ASHOK KUMAR
Head, Department of Electronics, D. A. V. College (Lahore), Ambala City
DR. JATINDERKUMAR R. SAINI
Head, Department of Computer Science, S. P. College of Engineering, Visnagar, Mehsana, Gujrat
DR. V. SELVAM
Divisional Leader – Commerce SSL, VIT University, Vellore
DR. PARDEEP AHLAWAT
Reader, Institute of Management Studies & Research, Maharshi Dayanand University, Rohtak
S. TABASSUM SULTANA
Asst. Professor, Department of Business Management, Matrusri Institute of P.G. Studies, Hyderabad
TECHNICAL ADVISOR
TECHNICAL ADVISOR
TECHNICAL ADVISOR
TECHNICAL ADVISOR
AMITA
Faculty, E.C.C., Safidon, Jind
MOHITA
Faculty, Yamuna Institute of Engineering & Technology, Village Gadholi, P. O. Gadhola, Yamunanagar
FINANCIAL ADVISOR
FINANCIAL ADVISOR
FINANCIAL ADVISOR
FINANCIAL ADVISORSSSS
DICKIN GOYAL
Advocate & Tax Adviser, Panchkula
NEENA
Investment Consultant, Chambaghat, Solan, Himachal Pradesh
LEGAL ADVISORS
LEGAL ADVISORS
LEGAL ADVISORS
LEGAL ADVISORS
JITENDER S. CHAHAL
Advocate, Punjab & Haryana High Court, Chandigarh U.T.
CHANDER BHUSHAN SHARMA
Advocate & Consultant, District Courts, Yamunanagar at Jagadhri
SUPERINTENDENT
SUPERINTENDENT
SUPERINTENDENT
SUPERINTENDENT
INTERNATIONAL JOURNAL OF RESEARCH IN COMMERCE, IT & MANAGEMENT
CALL FOR MANUSCRIPTS
CALL FOR MANUSCRIPTS
CALL FOR MANUSCRIPTS
CALL FOR MANUSCRIPTS
We
invite unpublished novel, original, empirical and high quality research work pertaining to recent developments & practices in
the area of Computer, Business, Finance, Marketing, Human Resource Management, General Management, Banking, Insurance,
Corporate Governance and emerging paradigms in allied subjects like Accounting Education; Accounting Information Systems;
Accounting Theory & Practice; Auditing; Behavioral Accounting; Behavioral Economics; Corporate Finance; Cost Accounting;
Econometrics; Economic Development; Economic History; Financial Institutions & Markets; Financial Services; Fiscal Policy;
Government & Non Profit Accounting; Industrial Organization; International Economics & Trade; International Finance; Macro
Economics; Micro Economics; Monetary Policy; Portfolio & Security Analysis; Public Policy Economics; Real Estate; Regional
Economics; Tax Accounting; Advertising & Promotion Management; Business Education; Business Information Systems (MIS);
Business Law, Public Responsibility & Ethics; Communication; Direct Marketing; E-Commerce; Global Business; Health Care
Administration; Labor Relations & Human Resource Management; Marketing Research; Marketing Theory & Applications;
Non-Profit Organizations; Office Administration/Management; Operations Research/Statistics; Organizational Behavior & Theory;
Organizational Development; Production/Operations; Public Administration; Purchasing/Materials Management; Retailing;
Sales/Selling; Services; Small Business Entrepreneurship; Strategic Management Policy; Technology/Innovation; Tourism,
Hospitality & Leisure; Transportation/Physical Distribution; Algorithms; Artificial Intelligence; Compilers & Translation; Computer
Aided Design (CAD); Computer Aided Manufacturing; Computer Graphics; Computer Organization & Architecture; Database
Structures & Systems; Digital Logic; Discrete Structures; Internet; Management Information Systems; Modeling & Simulation;
Multimedia; Neural Systems/Neural Networks; Numerical Analysis/Scientific Computing; Object Oriented Programming;
Operating Systems; Programming Languages; Robotics; Symbolic & Formal Logic; Web Design. The above mentioned tracks are
only indicative, and not exhaustive.
Anybody can submit the soft copy of his/her manuscript
anytime
in M.S. Word format after preparing the same as per our
submission guidelines duly available on our website under the heading guidelines for submission, at the email addresses,
or
.
GUIDELINES FOR SUBMISSION OF MANUSCRIPT
GUIDELINES FOR SUBMISSION OF MANUSCRIPT
GUIDELINES FOR SUBMISSION OF MANUSCRIPT
GUIDELINES FOR SUBMISSION OF MANUSCRIPT
1. COVERING LETTER FOR SUBMISSION:
DATED: _____________
THE EDITOR
IJRCM
Subject:
SUBMISSION OF MANUSCRIPT IN THE AREA OF .
(e.g. Computer/IT/Finance/Marketing/HRM/General Management/other, please specify)
.
DEAR SIR/MADAM
Please find my submission of manuscript titled ‘___________________________________________’ for possible publication in your journal.
I hereby affirm that the contents of this manuscript are original. Furthermore it has neither been published elsewhere in any language fully or partly, nor is it under review for publication anywhere.
I affirm that all author (s) have seen and agreed to the submitted version of the manuscript and their inclusion of name (s) as co-author (s).
Also, if our/my manuscript is accepted, I/We agree to comply with the formalities as given on the website of journal & you are free to publish our contribution to any of your journals.
NAME OF CORRESPONDING AUTHOR:
Designation:
INTERNATIONAL JOURNAL OF RESEARCH IN COMMERCE, IT & MANAGEMENT
Residential address with Pin Code:
Mobile Number (s):
Landline Number (s):
E-mail Address:
Alternate E-mail Address:
2. INTRODUCTION: Manuscript must be in British English prepared on a standard A4 size paper setting. It must be prepared on a single space and single column with 1” margin set for top, bottom, left and right. It should be typed in 8 point Calibri Font with page numbers at the bottom and centre of the every page.
3. MANUSCRIPT TITLE: The title of the paper should be in a 12 point Calibri Font. It should be bold typed, centered and fully capitalised.
4. AUTHOR NAME(S) & AFFILIATIONS: The author (s) full name, designation, affiliation (s), address, mobile/landline numbers, and email/alternate email address should be in italic & 11-point Calibri Font. It must be centered underneath the title.
5. ABSTRACT: Abstract should be in fully italicized text, not exceeding 250 words. The abstract must be informative and explain the background, aims, methods, results & conclusion in a single para.
6. KEYWORDS: Abstract must be followed by list of keywords, subject to the maximum of five. These should be arranged in alphabetic order separated by commas and full stops at the end.
7. HEADINGS: All the headings should be in a 10 point Calibri Font. These must be bold-faced, aligned left and fully capitalised. Leave a blank line before each heading.
8. SUB-HEADINGS: All the sub-headings should be in a 8 point Calibri Font. These must be bold-faced, aligned left and fully capitalised.
9. MAIN TEXT: The main text should be in a 8 point Calibri Font, single spaced and justified.
10. FIGURES &TABLES: These should be simple, centered, separately numbered & self explained, and titles must be above the tables/figures. Sources of data should be mentioned below the table/figure. It should be ensured that the tables/figures are referred to from the main text.
11. EQUATIONS: These should be consecutively numbered in parentheses, horizontally centered with equation number placed at the right.
12. REFERENCES: The list of all references should be alphabetically arranged. It must be single spaced, and at the end of the manuscript. The author (s) should mention only the actually utilised references in the preparation of manuscript and they are supposed to follow Harvard Style of Referencing. The author (s) are supposed to follow the references as per following:
•
All works cited in the text (including sources for tables and figures) should be listed alphabetically.•
Use (ed.) for one editor, and (ed.s) for multiple editors.•
When listing two or more works by one author, use --- (20xx), such as after Kohl (1997), use --- (2001), etc, in chronologically ascending order.•
Indicate (opening and closing) page numbers for articles in journals and for chapters in books.•
The title of books and journals should be in italics. Double quotation marks are used for titles of journal articles, book chapters, dissertations, reports, working papers, unpublished material, etc.•
For titles in a language other than English, provide an English translation in parentheses.•
The location of endnotes within the text should be indicated by superscript numbers.PLEASE USE THE FOLLOWING FOR STYLE AND PUNCTUATION IN REFERENCES:
BOOKS
•
Bowersox, Donald J., Closs, David J., (1996), "Logistical Management." Tata McGraw, Hill, New Delhi.•
Hunker, H.L. and A.J. Wright (1963), "Factors of Industrial Location in Ohio," Ohio State University. CONTRIBUTIONS TO BOOKS•
Sharma T., Kwatra, G. (2008) Effectiveness of Social Advertising: A Study of Selected Campaigns, Corporate Social Responsibility, Edited by David Crowther & Nicholas Capaldi, Ashgate Research Companion to Corporate Social Responsibility, Chapter 15, pp 287-303.JOURNAL AND OTHER ARTICLES
•
Schemenner, R.W., Huber, J.C. and Cook, R.L. (1987), "Geographic Differences and the Location of New Manufacturing Facilities," Journal of Urban Economics, Vol. 21, No. 1, pp. 83-104.CONFERENCE PAPERS
•
Garg Sambhav (2011): "Business Ethics" Paper presented at the Annual International Conference for the All India Management Association, New Delhi, India, 19–22 June.UNPUBLISHED DISSERTATIONS AND THESES
•
Kumar S. (2011): "Customer Value: A Comparative Study of Rural and Urban Customers," Thesis, Kurukshetra University, Kurukshetra. ONLINE RESOURCES•
Always indicate the date that the source was accessed, as online resources are frequently updated or removed. WEBSITEINTERNATIONAL JOURNAL OF RESEARCH IN COMMERCE, IT & MANAGEMENT
RESPONSIBILITY ACCOUNTING IN SMALL AND MEDIUM SCALE INDUSTRIES MANUFACTURING AUTO
COMPONENTS
ANIRUDDHA THUSE
RESEARCH SCHOLAR, UNIVERSITY OF PUNE, PUNE
ASST. PROFESSOR
ADITYA INSTITUTE OF MANAGEMENT
NARHE, PUNE
DR. NEETA BAPORIKAR
HOD-SRD
COLLEGE OF APPLIED SCIENCES
SALALAH
SULTANATE OF OMAN
ABSTRACT
Responsibility Accounting refers to the management control system of accounting and reporting at divisional level of the organization. This research paper focuses on the concept of Responsibility Accounting and its applications in the Small and Medium Scale Auto Component Manufacturers. The ever increasing demands for all types of vehicles puts extra increasing pressure on the Auto Components manufacturers, as these organizations manage the entire raw materials inputs for the large scale auto manufactures.. So it has become quite essential to measure and to control the performance of Production and other supporting divisions in the SME Auto Components. The performance is to be evaluated on the basis of divisional Profitability and for this; the Profit Center would be the strategic tool to be applied for the performance measurement.
KEYWORDS
Divisional Check, Performance, Profitability, Reporting and Strategy.
INTRODUCTION
ecentralization is now days a common process followed in all types of business organizations. It is the process of delegating decision authority and responsibility to the functional divisions. In centralization, a limited amount of authority is delegated. In decentralization, a significant amount of authority is delegated to the middle or lower level management. The large scale organizations always believe in decentralization and operate their key functional activities such as production, marketing, sales etc. accordingly. The decentralization is quite common now days due to the product or service varieties, branch networks and wide spread business areas.
In the small and medium scale organizations, usually the decision making is often rest in the hands of the top management or the owners. They highly follow the system of centralization. But the changing scenario of the small and medium scale organizations is now also demanding for the decentralization at least up to a certain extent. When the division is decentralized, then it considers as a separate responsibility center which carries entire responsibility of the given task. The responsibility center shows input output relationship very intensely. The divisional managers are held responsible for the performances of their respective divisions and the performance of each division is to be measured in the financial terms. Such a financial performance of the division can be measured by adopting the system of responsibility accounting.
Responsibility accounting is a management control system based on the principles of delegating and locating responsibility at the divisional level. Responsibility accounting is a system under which managers are authorized to decisions making, and holding responsibility for each activity that occurs within a specific area of the company. Under this system, managers are made responsible for the activities of segments. These segments may be called departments or branches or divisions or units.
OBJECTIVES OF STUDY
This particular research has been carried out for the following purposes,
• To evaluate the divisional performance in the Small and Medium scale (SME) Auto Components firms considering the ever increasing demands of auto vehicles.
• To apply Responsibility Accounting System in these divisions.
• To explain concept of Profit Center to these organizations
SIGNIFICANCE OF RESPONSIBILITY ACCOUNTING IN SMALL AND MEDIUM SCALE (SME) AUTO COMPONENTS
The present performance of the automobile sector is fabulous. It can be explained with the given data:
TABLE 1: SALES PERFORMANCE OF AUTOMOBILE VEHICLES (NUMBER OF VEHICLES SOLD) Segments 2008- 2009 2009 – 2010 Up to Oct.2010 % Change
Cars 103227 143976 39
Commercial Vehicles 29842 49086 61
3 Wheelers 27525 33144 20
Motor Bikes 562349 656119 17
Scooters 97129 148247 53
Total 894380 1120081 25
Exports 107424 201543 88
Source: Manual- Society of Indian Automobile Manufacturers (SIAM)
The efficiency and effectiveness in the performance of the large scale automobile manufacturing organizations largely depends upon the performance (especially the production performance) of the small and the medium scale auto ancillaries. The timely and quality supply of all types of auto components, spare parts, equipments etc. is entirely controlled by the SME auto units. So it is essential to measure the performance of these types of organizations and to decentralize the key divisions therein.
INTERNATIONAL JOURNAL OF RESEARCH IN COMMERCE, IT & MANAGEMENT
The SME auto component industries in India have about 500 organized and 600 unorganized firms. Chennai and Pune are the main centers of the auto ancillaries. These types of industries manufacture the components of the automobile vehicles. The SME auto component industries are production- wise categorized as follows:
TABLE 2: CATEGORY OF SME AUTO COMPONENTS INDUSTRIES Components % Market
Engine Parts 31
Drive Transmission and Steering Parts 19 Suspension and Brake Parts 12 Electrical Parts 9 Body and Chassis 12
Equipments 10
Source: Manual- Auto Components Manufacturing Association of India (ACMA)
Note: The Indian auto components industries have Original Equipment manufacturing of 50%, Replacement Market of 35% and Export Market of 15%.
The auto components manufacturing units are running their businesses on small and medium scale basis. These types of units have their fixed direct customers and these customers are the large scale automobile organizations which manufacture different types of vehicles.
SCOPE OF RESPONSIBILITY ACCOUNTING IN SME AUTO COMPONENTS UNITS
The automobile sector is performing exceptionally well in recent period and the SME auto components units have steady and ever increasing markets. Many of the SME units are enjoying monopoly up to the large extent in their selling. They have regular components supply to the big automobile houses such as Tata, Mahindra, Bajaj etc. The annual demand is fixed so the production scheduling is well preplanned. The concept of Responsibility Accounting has wide scope in such types of units especially for the production divisions.
THEOROTICAL BACKGROUND OF RESPONSIBILITY ACCOUNTING
“Responsibility Accounting is a system of Management Accounting under which accountability is established according to the responsibility delegated to various levels of management and Management Information and Reporting System instituted to give adequate feedback in terms of the delegated responsibility. Under this system, division or units of an organization under a specific authority in a person are developed as Responsibility Centers and evaluated individually for their performances.” (Institute of Cost and Works Accounts of India)
“Responsibility Accounting or Profitability Accounting or Activity Accounting which means the same thing, is a system that recognizes various decision or responsibility centers throughout the organization and traces costs (and revenue, assets and liabilities) to the individual managers who are primarily responsibility for making decisions about the costs in question”. (Charles T. Horongren)
To simplify with, the term Responsibility Accounting refers to an accounting process that reports how efficiently and effectively the managers of responsibility centers have fulfilled their responsibility. It is also known as Activity or Profitability Accounting. Such a system has great relevance of the cost accounting. All the functional divisions in any organization have performance responsibility usually of high output and cost controlling. The managers of the divisions are held accountable for the incurrence and control of the costs of their respective divisions. However, the divisional revenues are neglected.
The responsibility accounting is quite important for the firms for measuring the separate performance of the divisions there in. However, all the divisions are not exactly performance oriented, but all the divisions are responsibility oriented and hence these are the responsibility centers. An application of responsibility accounting is quite significant because of the following reasons.
1. It enables the identification of individual managers responsible for satisfactory or unsatisfactory performance.
2. The divisions and the employees therein are motivated for quality performance knowing that it is financially measurable.
3. Responsibility accounting system provides readymade Reporting system of the performance of the divisions. It provides a framework for the managerial performance appraisal and accordingly motivates managers to act in the best interests of the firm.
With reference to the definitions specified above, each functional division or unit within the organization has a separate individuality, clearly delegated responsibility of performance and thus, to be considered as a separate Responsibility Center. The performance of each Responsibility Center is financially measured on the basis of simple accounting principles as costs incurred for and revenues generated by that center. Responsibility accounting is a control device for the performance of the division. Each separate division like production, marketing, sales etc. should have to prepare its performance reports with reference to costs and revenue aspects. Here, the performance measurement is quite simple and it is done on the basis of only,
1. Total Actual Costs incurred in that division for the period or for the job against the predetermined Budgeted Costs.
2. Net Revenue generated at that division for the period or for the job against the predetermined budgeted revenue. The revenue may not be the sales of the organization.
DIVISIONAL OR RESPONSIBILITY CENTER ‘REVENUES’
For any company, revenue is the total amount of money received from the goods sold or services provided during a certain time period. It also includes all net sales, exchange of assets; interest and any other increase in owner's equity and is calculated before any expenses are subtracted. The company’s net profit is calculated by subtracting expenses from revenue. In terms of reporting revenue in a company's financial statements, different companies consider revenue to be received, or "recognized", different ways. For example, revenue could be recognized when a deal is signed, when the money is received, when the services are provided, or at other times. There are rules specifying when revenue should be recognized in different situations for companies using different accounting methods, such as cash basis and accrual basis.
INTERNATIONAL JOURNAL OF RESEARCH IN COMMERCE, IT & MANAGEMENT
TABLE 3: DIVISIONAL REVENUES Divisions Revenues options
Production Quick Output in units in the given capacity, Cost saving and Zero defect production Marketing Generating new customers, Searching new innovative modes of marketing and Cost saving
Finance Optimum capital structure, Economical mode of finance, Strategic investments decisions and Liquidity R&D Increase in sales due to innovative research and designs.
The revenues options shown in the Table 3 are more or less financial and affect the profits of the company up to a great extent. These revenue options can be the performance measurement tools for the respective divisions. But ultimately, the sales of the company are only the direct revenues.
PROFIT CENTER CONCEPT
According to Peter Drucker, “Profit Centers divide a company into smaller entities, allowing entrepreneurs to measure results more easily. These results can be used to hold each unit accountable for desired profit levels or simply to ensure that they are generating sufficient profits”.
Thus, in an organization when financial performance of the center, division or department is evaluated in terms of profits (revenue – expenditure) then the center, division or department is termed as the Profit Center. It is a separate segment of a business for which costs, revenues and profits are separately calculated. It is a branch or division of the company that creates Profitsindividually and separately from the main organization. The costs (which are direct divisional costs) are subtracted from the revenue of the division. (by eliminating Allocated costs which are common to all divisions in the organization.)
Profit Center is also called as the Contribution Center or Financial Performance Center. The organization can create better management control on its operations by converting its key functional units into the profit center.
Profit Center is a segment of business organization, which is responsible for the cost it incurs as well as the revenue it generates. It is a profit making responsibility center in the organization. The organization has an opportunity to convert its key divisions (production, marketing and sales) into the profit centers. It is a strategic tool of the performance measurement and strong management control. Profit Center is responsible for the Profits (Revenues minus Costs of that division) of that particular division.
The large scale manufacturing units often use the profit center system by converting their main functional divisions such as production, marketing or sales, into the profit centers. In this case, they decide Transfer Price for the internal transfers of goods or services. It is the price at which divisions of a company transact with each other and these are treated as the profit centers. The transactions may include the trade of raw materials, components and specialized services also. But for small or medium scale manufacturing units, such a system is not followed because of their restricted organizational structure, limited expertise skills and lower profitability. Many of the units have lack of departmentation also. These companies have good opportunity of converting their major functional division (usually the production division) into the profit center.
FIGURE 1: FUNCTIONAL DIVISION AS A PROFIT CENTER
The usefulness of Responsibility Accounting is purely the internal control aspect for the company. It enables company to establish internal control over the performance of its key functional divisions. When the division has to be converted into the profit center, the performance of the division is measured in terms of divisional profits and divisional profit is ascertained by deducting divisional expenditure from the divisional revenues (As mentioned in Table 3) or from the standard (budgeted) sales of the main organization.
RESEARCH PROBLEM STATEMENT
This research study is based on two statements of Hypothesis (H) i.e. H-0 and H- 1
H 0 - The SME auto components manufacturing units usually follow any traditional system for their divisional performance measurement.
H- 1 - The SME auto components manufacturing units are not familiar to the concept of Responsibility Accounting as a performance measurement tool.
RESEARCH METHODOLOGY
This research paper is based on face to face interaction with SME auto components located in Pune (Maharashtra.)
The relevant primary data for this research has been collected through personal visits to 3 SME auto components units. The selected units are in manufacturing of the components like gear boxes, steering wheels for four wheelers, sheet metal pressing etc. All these units are selling their components to commercial vehicles and light motor vehicles manufacturers. The annual turnover of the units is between Rs.50 crore to Rs.300 crore. The primary data is consisted of cost and expenditure details of the units, sales turnover, profit margin and the major practical problems faced by the SME auto components in their regular operations.
The secondary data is collected from the published reports of the selected units, relevant reference books and websites.
OBSERVATIONS AND FINDINGS
From the research it is observed that the selected SME auto components units have good market demand and ever increasing sales turnover every year. However these units have major proportion of their cost investment in the manufacturing activity only (about 75% to total costs). The manufacturing costs are uncontrollable up to a great extent. So, it has become quite essential to establish Responsibility Accounting system in the Production Divisions of the units. At present, these units evaluate performance of their production divisions on the basis of quick and timely supply as per the demands. (Accordingly H- 0 is tested and correct.) They are ready to compromise with increase in costs for maintaining quick and quality supply of the product components. Due to this, the cost control over production may become problematic.
The units measure performance of their Production Division with the following criteria. (H-0) Criteria 1: Timely and quick supply as per the orders.
Criteria 2: Zero defect production Criteria 3: Standard Cost v/s Actual Cost
However, these units do not follow any particular criteria for performance measurement of their divisions. The criteria mentioned above are only the traditional criteria. The units are experiencing some common problems. These are,
1. Use of traditional costing system. 2. Very lower profit margin of maximum 8%.
INTERNATIONAL JOURNAL OF RESEARCH IN COMMERCE, IT & MANAGEMENT
4. The actual costs incurred are many times much higher than the standard costs. The cost standards are set on total cost basis only. (Accordingly H- 1 is tested and correct.)
The SME units incur total 80% of its Total Cost on actual manufacturing and materials purchasing. The other divisions in the units do not have separate individuality and are treated as other divisions only. The units do not have the divisions like marketing and R&D as the customers are fixed and they only decide for the components designs. The overall production output is fully customized. The units are lacking of specific organizational structure. The production division is the key and only division in the units. The other divisions are treated as the administrative units.
FIGURE 2: COST STRUCTURE OF THE SME AUTO COMPONENTS UNITS
APPLICATION OF RESPONSIBILITY ACCOUNTING SYSTEM (PROFIT CENTER ACCOUNTING)
An application of Responsibility Accounting System in the production division of the SME auto components units is quite simple. They can use the following type of accounting system and measure the performance accordingly,
STEPS FOR TURNING OUT PRODUCTION DIVISION AS A PROFIT CENTER
1. To transfer all the Prime Costs and Factory Overheads to Production Division. or
2. To transfer entire Prime Costs but to transfer only specific Factory Overheads to the Production Division only after proper classification, Example: SME Auto Component Unit X.
X company has average turnover of Rs.325 crore (aprox.). This company has big customer like Tata Motors which regularly purchases the Sheet Metal Pressing Components for its light vehicles like Indica, Indigo and Safari.
The production related costs of the X Company are given below,
TABLE 4: PERFORMANCE REPORT OF THE PRODUCTION DIVISION FOR THE A.Y 2009-10
Heads Standards. Actual Actual
Rs. (in Crores) Rs. (in Crores) Rs. (in Crores) Prime Cost (Entire)
Long Term Variables: Power and Fuel Factory Electricity
Fixed Controllable: Indirect Wages and Salaries
Repairs and Maintenance of Machinery Repairs and Maintenance of Shafting Belting Repairs and Maintenance
Total Costs Transferred to Production Division Profit from Profit Center
Sales of the Company (Standard or average figure) 88.90 325.00
10.10 1.80
30.40 5.70 1.40 0.70
186.00
11.90
38.20
236.10
Factory Overheads (Nature of Cost wise)
Long Term Variable: Power and Fuel and Factory Electricity (100% transfer)
Fixed Controllable: Repairs and Maintenance of Machinery and Shafting and Renewals and Indirect Wages and Works Salaries (100% transfer) Fixed Uncontrollable: Depreciation on Machinery and Shafting and Factory Rent (not to be transferred).
Sales of the Company: The sales are taken as the standard or average annual turnover. The actual sales can be more or less than it. However, the company always tries to maintain the expected standard sales turnover. The costs transferred are actual. The company is not following the performance measurement system as Standard Costs v/s Actual Costs. The average turnover of the unit is Rs.325 crore and the profit margin is Rs.88.90 crore (i.e 27.35%). The task given to the production division is to retain the steady profit margin to the standard or average sales turnover for the given period and the performance of division can be controlled accordingly.
In the above table, the performance of the production division of the X Company is shown on the basis of the actual costs incurred on the manufacturing activities. The company has not determined the standard costs. Only the production and related costs are transferred to the production division. The Fixed Costs which are Uncontrollable such as Depreciation and Factory Rent are not transferred to the production division even though these are the factory overheads. This is because; these two overheads are to be incurred by the company in any cases (profit or loss, excess production or less production). This means, the costs which directly get affected by the change in production volume directly or indirectly, only are transferred to the production division. Here the performance of the profit center is its contribution in profits of the company or the profit earned only from the manufacturing activity which is Rs.88.90 Crore (27.35% to the Standard Sales).
Now the question can be raised that how the company will improve the performance of the production division? The company can improve it by, 1. The production division should follow the production planning exactly as per the standard and predetermined sales during the period. 2. The division should maintain the steady profit margin (e.g 27.35% in the above case.) to the standard sales turnover of the given period. 3. The division should make clear classification of the production costs as Controllable and Uncontrollable.
4. The division should keep continues track of its financial performance and for this; the performance reports (as shown in table 3 and 4) should be prepared periodically say monthly, quarterly or six monthly.
5. As the standard sales are taken for checking out the performance, it can create control on the performance of the sales division also. The sales division will try to achieve standard sales for the given period.
INTERNATIONAL JOURNAL OF RESEARCH IN COMMERCE, IT & MANAGEMENT
TABLE 5: AN INTERPRETATION OF PRODUCTION DIVISION’S PERFORMANCE (RATIOS) FOR THE A.Y 2009-10 Ratios Results (Standard) Results (Actual) Variance Divisional Profit Margin 27.35% ?
Prime Cost to Standard Sales ? 57.23% Long Term Variables (Total) ? Rs.11.90 Fixed Controllable Costs (Total) ? Rs.38.20 Total Production Cost to Standard Sales ? 72.65% Actual Sales to Standard Sales Rs.325 ?
The units should have to determine the standard budgeted figures for the above and check the results accordingly. They can go for necessary steps for improvement in the areas of unfavorable variances. This enables unit to keep direct control on the performance of the production division.
CONCLUSIONS AND RECOMMENDATIONS
An ultimate conclusion is about the performance measurement and control which lacks in the selected SME auto components units.
From the survey, it is concluded that the profits of the company hugely depend upon the sales turnover and the demand for SME auto components largely depends upon the market demand of auto vehicles which is ever increasing in the recent period.
The SME auto components units are not aware about the concept of Responsibility Accounting. They do not follow any authentic system for the internal performance control.
The job of production division is not to generate or to increase the sales, but to support the sales by keeping the expected output ready (quantitative and qualitative). If the company fails to generate the expected sales in any period, then there will be the wastage of overall costs which initially incurred on the production activity. The company can rectify this by adopting the system of Responsibility Accounting and especially by converting its production division into the profit center. In the large scale organizations, the production divisions usually perform as separate profit centers. But the SME organizations are still unaware about such a system of the performance measurement. These organizations can adopt the profit center system to measure the performance of their main divisions and especially of the production division. The profit center accounting system is simple to operate (as shown in the above tables). It is nothing but the Revenue and Expenditure Account for the concerned division. The profit calculated is the profit of the division and not the profit of the company. Thus, in profit center, the profit figure is used only for the performance measurement and it is the divisional profit and not the actual profit from the business operations. By adopting the Responsibility Accounting system, the top management will be in a better position to synchronize the overall goal congruence at divisional levels.
REFERENCES
BOOKS
• Jawahar Lal (2010),”Accounting for Management”, Himalaya Publishing House, Mumbai
• M.Y.Khan and P.K.Jain (2010), “Financial Management”, Tata McGraw Hill Education Pvt.Ltd. New Delhi
• R.Anthony and V. Govindarajan, (2010) “Management Control Systems”, Tata McGraw Hill Educations Pvt. Ltd. New Delhi.
• Shailesh Kasande, (2009) “Research Methodology” Nirali Prakashan, Pune JOURNALS
• Jerry Osteryoung – (2010) “Profit Centers show key results” BUSINESS Journal. RESEARCH ARTICLES
• B. Venkatrathnam and W. K. Raji Reddy, “Responsibility Accounting conceptual framework”.www.icwai.org/icwai/knowledgebank/ma3 WEBSITES
• www.acmainfor.com
• www.automobilebusiness.review.com
• www.behrgroup.com
• www.icwai.org/icwai/knowledgebank/ma34
• www.investorwords.com/4254/revenue.html
• www.referencefor business.com/small/Op/Qu/Profit Center.html#ixzzozUsIreyq
INTERNATIONAL JOURNAL OF RESEARCH IN COMMERCE, IT & MANAGEMENT
LIBERALIZED FINANCIAL SYSTEM AND ECONOMIC DEVELOPMENT IN NIGERIA
OLOWE, OLUSEGUN
LECTURER
DEPARTMENT OF BANKING & FINANCE
COLLEGE OF DEVELOPMENT STUDIES
COVENANT UNIVERSITY
OTA
ABSTRACT
For the past twenty years, an enhanced financial sectoral deregulation has been a major economic tool in the agenda of most less developed economies and Nigeria is no exception. The discouraging level of growth with reference to the savings and investment culture of the people and government involvement in these economies has call to question whether financial sector liberalization have an impact on savings and investment in the economy and by extension on the level of growth and development of such economies. This study attempted to take a cursory look at the issue by examining the impact of financial system liberalization on savings and investment and by extension growth and development in Nigeria between 1997 and 2008. Some of the policy recommendations centred on the government creating an enabling environment for private investment to thrive. This will go a long way in helping to promote private investment with significant benefits in the long run for growth and development to the advantage of the citizenry and the economy at large.
KEYWORDS
Financial Sector Deregulation, Liberalization.
INTRODUCTION
ince the mid-1980s, financial liberalization in several African countries has been implemented largely through on-going structural adjustment programmes. As a prerequisite for the financial liberalization programmes, stabilization policies have been designed to ensure macroeconomic stability, low inflation and reduced budget deficits. The focus has been on liberalizing interest rates, deregulation of the financial sector, strengthening the banking system, introduction of new financial instruments, and development of securities markets, in particular the stock market. Stock market is viewed as a medium to encourage savings, help channel savings into productive investment, and to improve the efficiency and productivity of investments, (Ali,1995). The emphasis on the growth of stock markets for domestic resource mobilization has also been strengthened by the need to attract foreign capital in non-debt creating forms.
It is an established fact that financial system played an important role in the economic development of any nation. In this instance the financial services industry denotes an important link between the macro economic policies of a country with the rest of the globe and her basic role in this regard is resource mobilization and resource allocation among the productive sectors of the economy via financial intermediation; funds are attracted from the surplus sectors of the economy and channeled to the deficit sectors of the economy for investment purposes. Whenever any financial system is repressed, domestic capital are usually fragmented with adverse impacts on the quality and quantity of accumulation of real capital. The adoption of financial liberalization under any of these situations has been recommended so as to enhance the level of economic growth and development of less developed economies.
The objectives in this regard via the use of stabilization policies as a prerequisite to financial liberalization programmes had been to liberate interest rates, deregulate financial services sector, strengthen the banking system, introduce new financial products and develop the securities market. Adverse economic challenges that faced the Nigerian economy between the tail end of 1985 and 1986 led to the introduction of the Structural Adjustment Programme (SAP) and one of its major strategies was the adoption of appropriate pricing policies in all sectors with greater reliance on market forces and reduction in complex administrative controls. The deregulation of the financial market therefore led to an enabled market forces in determination of credit costs within the economy. This attracted a number of significant changes in the rules and regulations governing financial operations and these includes;
• Relaxation of controls on interest rates and also on conditions of granting banking licence.
• Abolition of credit ceilings and guidelines
• Complete deregulation of money and capital markets
In the light of the above, and according to the Central Bank of Nigeria Annual Report (various years) this resulted in a tremendous increase in the number of new entrants into the banking industry rising by over 100% from 58 banks in 1985 to 189 in 2004 prior to banking consolidation exercise which reduced the number of banks further to 24 banks. The banks’ branches also rose from 1,288 in 1985 to 2,489 in 1993, thus bringing the kilometer per square of 689.4 in 1986 to 356.75 in 1993. The money and capital markets were also affected in one form or the other by the programme and a major development in the money market was the introduction of auction-based system in 1989 on Federal Treasury Bills and Treasury Certificates issuance.
With the post-consolidation situation, the universal banking model is being reviewed and this will definitely portray Nigeria as a country with policy inconsistency since the current policy is less than five years in operation and we are reverting back to the previous order. It is worthy of note that the current move could be of strong similarity with other less developed economies like Nigeria. In the light of current developments, Nigerian banks are to be categorized into national banks (N25 billion for banks operating in Nigeria only and N100 billion for banks with operations outside Nigeria) and regional banks (N15 billion minimum capital requirement and must have the word “Regional” in its name) (CBN, 2010)2.
The major aim of financial liberalization is an enhanced economic performance via improved level of competitiveness with a robust efficiency posture within financial markets and with accrued benefits indirectly flowing to the coffers of non-financial sectors of the Nigerian economy. Since the application of the prescribed financial liberation, the Nigerian economy has not been able to experience impressive performances such as an enviable attraction of foreign investment or to checkmate capital flight.
The study is intended to critically assess the impacts of liberalization of the financial system on savings and investment and by extension on growth and development in the Nigerian economy over the period of 11 years between covering 1997 and 2008. Emphasis will therefore centre on the macroeconomic indicators of gross domestic product, inflation rates, and savings as well as investment variables in the economy.
The objectives of the study are:
1. To examine the nature and challenges of the financial systems.
2. To analyse and assess the concept of financial liberalization in the content and context of legal and institutional framework.
The study will proffer probable policy recommendations on the identified flaws in the financial system liberalization for the benefit of the economy. This will lead to an enhanced standard of living and by extension the desired economic growth and development will become achievable.
The study will also reveal how effective the various reforms in the financial services sector have been and thereby illuminate on areas requiring effective controls. The remaining part of the study is structured as follows: next is the literature review, followed by the theoretical framework. Methodology and analysis are in section IV. Discussion of findings, recommendations and conclusion is in the last section.
INTERNATIONAL JOURNAL OF RESEARCH IN COMMERCE, IT & MANAGEMENT
REVIEW OF RELEVANT LITERATURE
Financial liberalization in Nigeria commenced as an effort towards participation in the globalization of the world economies. The United Nations via International Monetary Fund (IMF) tends to achieve a union in the world economy and therefore launched a programme aimed at achieving a turn-around on the economic situation faced by many of the less developed economies. The programme was named Structural Adjustment Programme (SAP). Several objectives expected of the programme to be achieved include the following according to Central Bank of Nigeria (CBN, 2004)3.
• Market liberalization to promote efficient resource allocation
• Expansion of savings mobilization base
• Promotion of investment and growth through market-based interest rates
• Foster healthy competition in the provision of services
• Laying the basis for inflation control and economic growth
Most developing countries liberalized their financial sector in an attempt to integrate globally by removing government interventions and restrictions. The reason behind the shift to financial liberalization is based purely on a straightforward implication of the following economic principles: financial markets allow proper allocation of savings to productive investments which accelerates economic growth. Generally, nations’ wish to have a smooth consumption pattern over time and in the course of achieving this, financial liberalization allows them a smoother consumption pattern via international risk sharing.
They are less constrained by domestic endowments due to their ability to borrow from global financial markets by avoiding substantial falls in national consumption in case of dramatic decrease in output. Soyibo (1994)4 observes that the reforms in Nigeria were carried out under conditions of severe macroeconomic imbalances and instability in the financial system. Financial systems liberalization came into being because it is believed that a well functioning system provides adequate support for economic development while its poor functioning causes more problems for development.
FINANCIAL LIBERALIZATION
The basic programme of financial liberalization contains two main components: 1. Removal of ceilings on interest rates to allow for market determined ones.
2. Reduction in quantitative controls to allow financial intermediaries greater control over the use of their liabilities. (Levine, 1996)5.
Financial restructuring of the banking sector constitutes other aspects of financial sector reforms. These include the following as enunciated by World Bank, (1989)6 report:
1. Causes of bank insolvency and restructuring or closing down of insolvent firms. 2. Improved management of banks.
3. Increased competition in the banking sector as well as the development of a more diverse range of financial institutions such as insurance and pension firms, development finance institutions et cetera.
4. Removal of entry barriers to private sector financial institutions. 5. Improved legal controls and powers that are of benefit to lenders. 6. Improved government supervision.
7. Reduction of taxation either directly or indirectly via large reserve requirements. 8. Development of money and capital markets.
LEGAL AND INSTITUTIONAL FRAMEWORK FOR FINANCIAL LIBERALIZATION
A. LEGAL FRAMEWORK
Liberalized financial systems cannot be effective without sound legal and institutional framework. Evolutionary and proactive strategies are possible approaches to financial system development, (Obstfeld and Taylor, 2004)7. In the evolutionary strategy, financial markets are allowed to develop gradually with the economy.
As major distortions or bottlenecks emerge, government intervenes through improvements or changes in laws or regulations. In this strategy, financial deepening and financial system development are basically market driven within an adaptable legal, regulatory and prudential framework. Sander and Kleimeier (2006)8 see this as the appropriate strategy for African and other developing countries for three main reasons:
• Inadequate neutral incentive environment and market forces that is insufficiently strong for financial markets to develop by themselves.
• Lack of institution-building capacity to determine the pace and strength of financial markets development.
• Need for flexibility to allow for the use of the most efficient institutional set-up, required training infrastructure and choice of technology that is most suited to the local conditions and level of development.
The proactive approach suggested by Sander and Kleimeier seem to agree with the views of the World Bank (1989)9, which sees the legal and institutional framework of most developing countries as inadequate to support modern financial processes.
B. INSTITUTIONAL FRAMEWORK
The legal, regulatory and prudential framework discussed in the preceding section is essential for fostering financial market functions and promoting and anchoring its institutional framework. The ultimate function of financial markets, as earlier indicated, is to mobilize and allocate resources through financial intermediation in order to accelerate the process of economic growth. The function is performed through two distinct but interrelated components (the money and capital markets). The money market and the capital market are inter-related. First, the development of the money market usually precedes capital market development. Second, the same institutions may operate actively in both markets. Hence, the money market serves as a source of liquidity for the long-term investment needs of operators in the capital market. Bloch and Tang (2003)10 has argued that in order to develop and achieve the objective of supporting economic growth, the capital market requires environment in which government policies are generally favourable to economic growth. In such environment, resources are allocated in accordance with market forces rather than government directives. During the period 1970–1985, Nigeria’s financial sector was characterized by financial repression, macroeconomic imbalances and instability (Soyibo 1994)11.
Prior to 1970, banking regulations were largely prudential, aimed mainly at ensuring sound banking practices and protection. From the early 1970s, the aims remained broadly the same as in the previous years, but the control instruments became rather restrictive. The system was so regulated that by the mid-1970s, the Central Bank could stipulate what loans and advances each commercial bank should make to each of the sixteen different priority sectors of the economy, as well as maximum interest ceilings for agricultural and other priority areas (King and Levine, 1993)12. Government controlled 60 percent of commercial bank share capital while the Central Bank controlled 33 percent of the financial assets. Prior to the implementation of financial liberalization, government took no serious measures to establish appropriate legal framework under which the financial system would operate. No appropriate safety nets were established to safeguard against liquidity crises and no adequate regulatory and monitoring framework to prevent collusion and excessive risk-taking was put in place.
FINANCIAL LIBERALIZATION AND THE INFORMAL SECTOR
Financial liberalization acts directly on the formal sector financial system, through the removal of interest rate and other controls. As noted, however, the majority of small scale borrowers, particularly women, gain access to financial services through the informal sector.
INTERNATIONAL JOURNAL OF RESEARCH IN COMMERCE, IT & MANAGEMENT
sector. In terms of predictions, this depends to some extent on the view taken regarding dualism. There are competing views as to why Less Developed Countries (LDC) financial markets are characterized by segmentation, fragmentation, or dualism and thus about the nature of relations between the different segments and how these are likely to evolve (Nielsen et al, 2005)13.
The theory of financial repressionsees the development of informal sector finance as linked to distortions in financial markets caused by government controls, leading to the creation of parallel markets, to serve those crowded out of regulated markets by rationing. In this view, the informal sector should recede in favour of the formal sector, with interest rates converging, as liberalization proceeds. Savings will increase and move into the formal sector as interest rates rise, increasing the funds available for loan and investment. Informal sector operators may move into the formal sector as entry barriers, controls and taxes on the formal sector are removed or reduced.
An alternative view is that problems of imperfect informationare the main cause of market segmentation and fragmentation, i.e. that high information and transactions costs lead to market failure and lack of institutional development (Nielsen et al, 2005)14. In this view, credit rationing persists even with liberalization, so that the need for the informal sector persists, or possibly expands, as demand for financial services grows under adjustment. To a large extent, the effects will depend on the degree of market integration prior to liberalization. They find little evidence of market integration between formal and informal sectors in four Sub-Sahara African countries including Nigeria. Some informal intermediaries place deposits with banks, mainly for security, since these are short-term and rarely interest bearing. Formal financial institutions are reluctant to lend to informal operators who on-lend.
THEORETICAL FRAMEWORK
Most developing economies implemented financial reforms as part of a larger market-oriented reforms since 1980s and in the light of this, several versions of the financial liberalization hypothesis exists (Aziakpono, 1999)15, but the one mostly adopted particularly by less developed economies is the orthodox approach of McKinnon and Shaw. The orthodox approach in this instance suggests that financial liberalization increases both savings and investments and thus leads to enhance and efficient investment as posited by Shaw (1973)16.
With the elimination of controls on interest rates, credit ceilings and direct credit allocation, financial liberalization is expected to lead to the establishment of positive interest rates on deposit loans. In such instance, it makes both savers and investors appreciate the scarcity of capital, leading to a reduced dispersion in profit rates amongst varying economic sectors, improved allocative efficiency and higher output growth, (Villanueva and Mirakhor, 1990)17. Though the financial liberalization theory places more emphasis on the desirable effects of raising interest towards equilibrium, it also postulates that the effect of a change in interest rate depends on whether the actual interest rate is below or above equilibrium. If below the equilibrium, investment is constrained by savings. An increase in the interest rate towards equilibrium will increase savings and investment. Therefore as long as the equilibrium interest rate is not reached, investment is positively related to the interest rate. Beyond the equilibrium however, increase in interest rate will have a negative effect on investment as the economy moves along the negatively-sloped investment demand curve, (Gourinchas and Jeanne, 2003)18.
Against this backdrop which is based on the classical notions and beliefs, we have the Keynesian framework which believes that savings is positively related to income and investment is negatively related to the price of credit on which interest rate stands as a proxy. However, the proponents of this view concede that the interest rate might also have a positive effect on investment via the provision of credit.
This implies that as financial savings and the rate of interest are positively related, interest rate may also have a positive effect on investment through the process of financial deepening as well as the provision of credit to the private sector while it could be negative since an upward swing in the price of credit adjusted for inflation is expected to discourage investment spending in the economy. The net effect of interest rate on investment therefore will depend on the relative strength of its negative effect through the cost of investment and its positive effect through the provision of credit, (Eatwell, 1997)19.
The Harrod-Domar Growth Model on the other hand posits that every economy must save a certain proportion of its national income if only to replace worn-out or impaired capital goods. However and in order to grow, new investments representing net additions to the capital stock are very necessary, (Esen, 2000)20.
Therefore the variables that could stimulate the rate of savings in an economy apart from income, as well as how savings and capital formation (investment) could generate the required level of growth and by extension economic development in the developing economies like Nigeria become imperative as reflected in the formular below. It implies income (Y) as a function of the stated variables:
Y = f (S, GCF, NBB, INF) Where
Y = Income or GDP S = Savings
GCF = Gross Capital Formation or Investment NBB= Number of Bank Branches
INF = Inflation
DESCRIPTION OF VARIABLES
GROSS DOMESTIC PRODUCT (GDP) data at current market prices. This is the Gross Domestic Product at current factor cost plus indirect taxes net of subsidies. It is the GDP valued at the market prices which purchasers pay for the goods and services they acquire or use.
AGGREGATE SAVINGS (S) is the part of the national income that would not be spent on consumer goods. Klein (2005)21 defined savings as “abstinence from
consumption, an exchange of present income against an equal amount of income in the future or against the security accompanying a store of wealth”. In this instance, savings is not hoarding since it involves the productive use of funds not spent on present consumption.
GROSS CAPITAL FORMATION (GCF) This is also known as Gross Domestic Investment and it connotes the total change in the value of fixed assets plus changes in stocks.
NUMBER OF BANK BRANCHES (NBB) is the total number of branches per bank operating in the country at a particular period of time. INFLATION (INF) is a deceleration of economic growth and a massive disequilibrium of international payments.
HYPOTHESIS OF THE STUDY
The following hypothesis is formulated in order to find answer to the problem of the study as stated above:
Ho: There is no significant difference on the impact of liberalized financial system on savings, investment, growth and development.
METHODOLOGY
INTERNATIONAL JOURNAL OF RESEARCH IN COMMERCE, IT & MANAGEMENT
DATA ANALYSIS AND RESULTS
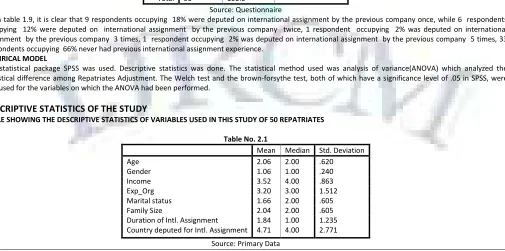
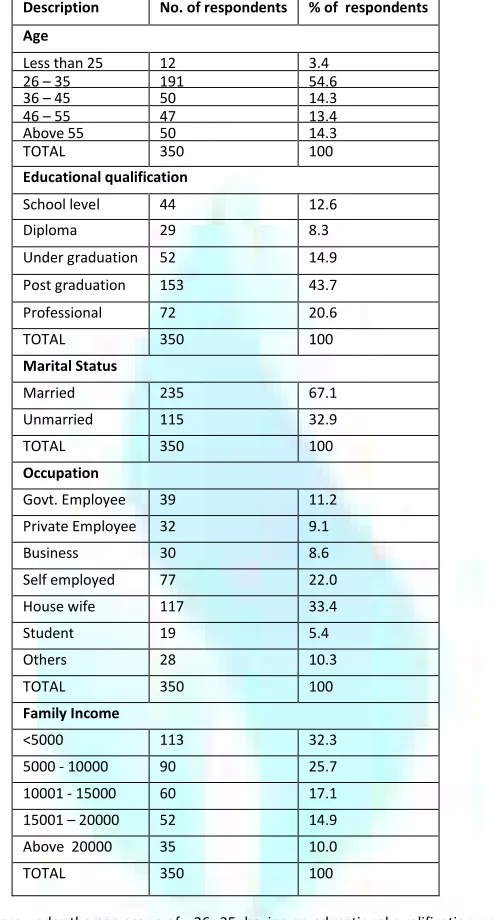
TABLE: RELEVANT DATA ON THE REQUIRED VARIABLES OF STUDY YEAR GDP SAVINGS GCF NBB INFLATION 1997 2,801,973 177,648 205,553 2,551 10.67 1998 2,708,430 200,065 192.984 2,298 7.86 1999 3,194,015 277,667 175,736 2,298 6.62 2000 4,512,127 385,191 268,895 2,444 6.94 2001 4,725,086 488,045 371,898 2,994 18.87 2002 6,912,381 592,094 438,115 3,018 12.89 2003 8,487,031 655,739 429,230 3,247 14.03 2004 11,411,067 797,517 456,970 3,492 15.01 2005 14,572,239 1,316,957 *804,400 3,492 17.85 2006 18,564,595 N/A *1,546,525 3,004 8.24 2007 20,657,251 2,693,554 *1,917,000 3,897 5.38 2008 23,842,126 4,118,172 *2,283,050 3,897 11.60
Source: National Bureau of Statistics; * United Nations Statistics; CBN TEST OF HYPOTHESIS
ANOVA SUMMARY
Groups Count Sum Average Variance
Column 1 12 1.22E+08 10199027 5.65E+13 Column 2 12 11702649 975220.8 1.5E+12 Column 3 12 9090356 757529.7 5.41E+11 Column 4 12 36632 3052.667 328890.1 Column 5 12 135.96 11.33 20.14402
ANOVA
Source of Variation SS Df MS F P-value F crit
Between Groups 9.25E+14 4 2.31E+14 19.72899 4.05E-10 2.539689 Within Groups 6.44E+14 55 1.17E+13
Total 1.57E+15 59 ANALYSIS OF RESULTS
From the above analysis the F-ratio of 19.7 is greater than the F-critical value of 2.53. The null hypothesis is rejected. We conclude that there is significant difference on the impact of liberalized financial system on savings, investment, growth and development in Nigeria.
DISCUSSION OF FINDINGS AND RECOMMENDATIONS
Based on the outcome of the study the following recommendations were of relevance:
1. Financial liberalization should be well coordinated with policies that encourages growth and stability of the economy and thus enhances credit worthiness of borrowers via prudent economic policies of great importance to achieve desired success.
2. Financial liberalization as it were stimulates investment better than it will stimulate national aggregate savings and the implication is that foreign borrowing will increase. In this instance, capital inflows require stringent regulations most importantly short term capital inflows to ensuring that activities of export industries are not in any way disrupted. However, it must be noted that capital inflow could not be objected to if such do not result to a foreign debt problem.
3. The government should focus more on the creation of conducive atmosphere that will make private investment interesting and attractive. Such conditions could include but not limited to stable macroeconomic environment, provision of adequate property rights such a