Anthocyanin Pigments of Siahe Sardasht Grapes
R. Heidari,
1J. Khalafi,
2and N. Dolatabadzadeh
1,*1 Department of Biology, Science Faculty, University of Urmia, Urmia 57154, Islamic Republic of Iran 2 Department of Chemistry, Science Faculty, University of Urmia, Urmia 57154, Islamic Republic of Iran
Abstract
The anthocyanins of Siahe Sardasht variety (Vitis vinifera L. var. S.S.) were
extracted from freezed samples and were purified by adsorption on
cation-exchange resin column. Individual pigments were separated by TLC on cellulose
plates. Monomeric anthocyanin content that was determined by pH-differential,
was 1740.11±3.58 mgL
−1(based on malvidin 3-glucose). Five major pigments
were identified by
1H-NMR, IR and UV-Visible spectroscopies. All pigments
were acylated with acetyl groups and three of them were acylated with malonyl
groups.
Keywords:Grape; Anthocyanin; H-NMR; IR; UV-Vis; Spectroscopy; Siahe Sardasht variety
* E-mail: ms0093@yahoo.com
Introduction
Anthocyanins consist a large family of widespread flavonoids in plants and they are responsible for many of fruit and floral colors that are observed in nature. Interest in the anthocyanins has increased because of their potential as natural colorants and beneficial health effects. Furthermore, anthocyanins have applications in chemotaxonomical and ecological studies. They have bright attractive colors, and they are water soluble. Acylated anthocyanin pigments show greater stability during processing and storage. Because of the presence of acylated groups in the structure of anthocyanins it is believed that they can protect the oxonium ion from hydration, thereby prevent the formation of hemiketal (pseudobase) or chalcone forms.
Anthocyanin pigments were found in 1835 for the first time. In 1916, Wehldale proposed anthocyanin flavanons formation pathway, since they were products of shikimic acid cycle. Willstatter and Zollinger (1915, 1916) reported malvidin 3-glucoside as the major
pigment in Vitis vinifera grapes, and malvidin 3,5-diglucoside and malvidin as the minor ones. Brown (1940) identified petunidin 3,5-diglucoside as the major pigment in Hunt muscandine grape (V. ro'undifolia Miehex) [1].
Rankine et al. (1958) surveyed anthocyanin pigments in 55 vinifera samples from 42 known varieties. An additional 125 varieties of vinifera were examined by Albach et al. (1959) [1].
Akiyoshi et al. (1963) reported cyaniding 3-monoglucoside as the major pigment in Flame Tokay variety. Somaatmadja and Powers (1963) isolated six anthocyanins from Cabernet Sauvignon grapes. Albach et al. (1965) reported monoglucosides of delphinidin, petunidin, malvidin, and peonidin in V. vinifera that were acylated with caffeic and ρ-coumaric acids [1]. Chen and Luh (1967) used cation exchange resin and paper chromatography for separation and identification of anthocyanins in Royalty grapes [12].
3-glucoside), mono-ρ-coumaroyl oenin and 3-glucosides of peonidin, petunidin and delphinidin [12].
Since a little is known about the chemistry of anthocyanins in Sardasht grapes, the present work covers the isolation, purification and identification of anthocyanin pigments in Siahe Sardasht grapes.
Materials and Methods
Grape Samples
The members of Siahe Sardasht variety of Vitis vinifera L. grow as wild plants on mountains of Sardasht in the south of West Azarbayejan (W.A.) province and are planted at the north of Kordestan and the south of W.A. province in Iran. Siahe Sardasht grapes were harvested from Mahabad in the south of W.A. province. The samples were washed with tap water and then were stemmed and sealed in polyethylene bags and finally they were frozen and stored at −18°C.
Extraction Procedures
Grapes (500 g) were thawed at room temperature and macerated in a Waring blender with methanol (250 ml) containing 0.1% HCl (v/v) under a nitrogen atmosphere for 5 min. The macerated sample was filtered through Whatman filter paper (No. 1) under vacuum and the residue was extracted with the same solvent until most of the pigments were extracted [11]. The combined extracts were mixed with Dowex 50W-X8 cation-exchange resin in the hydrogen form in a column (100×20 cm), sufficient resin was used for adsorption of the most pigments. After setting for a short time, the resin was thoroughly washed with distilled water to remove inorganic compounds and then washed with pure methanol to remove sugars and organic compounds other than anthocyanins. The pigments were eluted from the resin using methanol containing HCl at concentrations varying from 0.1 to 1.0% (v/v). The elutes were combined and concentrated under vacuum in a flash evaporator at 34°C to be dried out. The concentrated sample was redissolved in a small volume of 0.01% HCl in methanol, and was stored at −2°C in the dark under a nitrogen atmosphere [12].
Monomeric Anthocyanin Content
Monomeric anthocyanin content was determined using a pH differential method [14]. A LKB spectrophotometer (model: 4054) and 1 cm pathlenght disposable cells were used for spectral measurements at
700 and 720 nm. Pigment content was calculated as malvidin 3-glucoside, using an extinction coefficient (ε) 13,900 L cm−1mg−1 and molecular weight of 562.5 gL−1. The monomeric anthocyanin content of Sardasht grape was 1740.11±3.58 (mgL−1) (Malvidin 3-glucose basis).
One and Two-dimensional Cellulose TLC
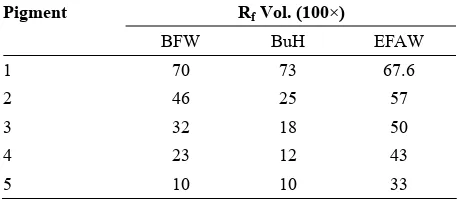
For TLC, about 20 μg of the concentrated extract was spotted on each cellulose plate (20×20 cm) [9]. For two-dimension TLC, the first solvent was BAW (n-buthanol-acetic acid-water; 4:1:5, v/v) and the second solvent was AWH (acetic acid-water-HCl; 15:82:3, v/v) [12]. The one-dimension TLC carried out in BuH [5], BFW [13] and EFAW [2] solvent systems (Table 3).
Separation and Purification of Anthocyanin
The final purification was achieved by preparative thin-layer chromatography (PTLC) on microcrystalline cellulose (Merck Corp.) using n-Buthanol/HCl (1:1 v/v), as solvent system. The isolated bands were eluted with 0.01% HCl in methanol, and the solvents were concentrated under vacuum in a flash evaporator at 34°C to be dried out, and were stored at −2°C.
Spectroscopic Analysis
1H-NMR spectral data were recorded on an
instrument that operated at 500.13 MHz (Model DRX500, Bruker) in CD3OD/TFA-d1(98:2 v/v) [10] or CD3OD [8]. When the signals of the anomeric protons of the investigated anthocyanins were partially overlapped by the signal of the dissolving H2O, an additional shift to lower magnetic field of this signal was produced by adding TFA-d1.
Infra Red (IR) spectral data were recorded on an IR spectrophotometer (Model 200-91527, Shimadzu).
Visible spectral data were recorded on an UV-Visible spectrophotometer (Model 4054, LKB) in 0.01% HCl in methanol.
Results and Discussion
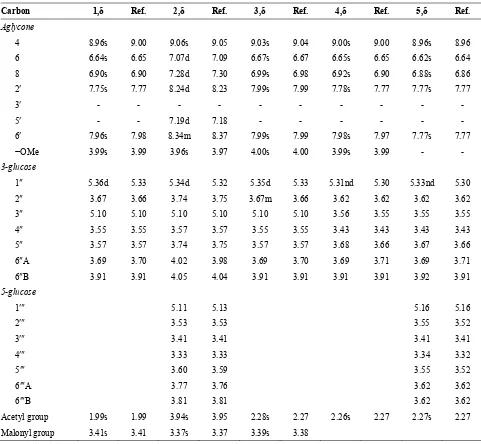
Compounds 1-5 of Siahe Sardasht grape berries were isolated by column chromatography on Dowex 50W-8X cation-exchange resin, followed by preparative cellulose TLC. 1H-NMR and UV-Visible spectral and TLC chromatography data of five anthocyanins (1-5) (Fig. 1) are shown in Tables 1-3, respectively.
Figure 1. Structure of Siahe Sardasht anthocyanins.
An absorbance band in the range from 310 to 360 nm indicated that pigment 1 was acylated with organic-acids [13,4]. AUV-max/AVis-max ratio for this pigment was 76%, indicating the presence of 3-glycoside substitution [3]. 1H-NMR spectral data (Table 1), for the glucosyl moiety showed an anomeric proton chemical shift in the region of 5.36 ppm as a doublet with a large coupling constant (7.8 Hz). This coupling- constant is characteristic of a β configuration of sugar moiety [10,6]. The methylen protons of C6 and C3 of sugar moiety were shifted to a low magnetic field (3.91 ppm and 5.10 ppm, respectively), indicating that OH of these carbons may be bound to two organic acids. IR spectrum for 1 indicated the presence of the aliphatic acid by observation of carbonyl absorption at 1723 cm−1. According to the IR spectrum (1723 cm−1) and 1.99ppm and 3.41ppm signals in the 1H-NMR spectrum, this pigment was acylated by acetyl (R3) and malonyl (R4) groups, respectively, and this pigment was petuni-din-3-O-(6-O-malonyl, 3-O-acetyl)-β-D-glucoside.
The UV-Visible spectral data showed that pigment 2
had a maximum absorption band in the UV region at 277 nm and in the visible region at 530 nm (Table 2). The A440/A530 ratio for this pigment was 11%, and AUV-max/AVis-max ratio was 28%. These results indicated that carbons 3 and 5 of this pigment were occupied by glucose. The presence of a shoulder at 310-360 nm
region, indicated that pigment 2 was acylated with organic acid. 1H-NMR spectrum (Table 1) showed that pigment 2 have signals at 5.34 ppm and 5.11 ppm for anomeric protons that were related to glucoses at 3 and 5 positions, respectively [7]. This indicated that the glucose moiety (gl.2) with an anomeric proton resonance at δ 5.11 must be attached to the 5-OH position, while glucose 2 with an anomeric proton resonance at δ 5.34 must be attached to the 3-OH position of pigment. As the coupling constants for these protons were small, therefore bonds between these glucoses and pigment were α glycosidic bond. The chemical shift values for the 6-CH2 protons and 3-CH proton of glucose 1 (gl.1) were shifted downfield (Table 1) and indicated acylation at the C-6 and C-3 positions. According to IR absorption at 1725 cm−1 (Table 5) and proton NMR signals at δ 3.94 and δ 3.37, this pigment must be acylated with acetyl and malonyl groups, respectively. Over these findings and proton NMR signals, the name of pigment 2 was suggested as peonidin 3-O-(6-O-malonyl, 3-O-acetyl)-α -D-glucoside)-5-O-α-D-glucoside.
The maximum absorption bands in the spectrum of pigment 3, were at 278 nm in UV region and 540 nm in visible region (Table 2). A440/A540 ratio for sample 3 was 19%, and AUV-max/AVis-max ratio was 49%. These results indicated a substitution on C-3 of the pigment 3. The presence of a peak at 352 nm indicated the acylation with organic acids. There was a signal at 5.36 ppm, in the 1H-NMR spectrum of 3 (Table 1) for anomeric proton, which related to the presence of a glucose at it's 3-position. The coupling constant of the anomeric proton was large (5.55 Hz). This coupling- constant is characteristic of a β configuration of the sugar moiety. The methylen protons of C6 and C3 of sugar moiety were shifted to a low magnetic field (3.91 ppm and 5.10 ppm, respectively), indicating that OH of these carbons must be bound to two organic acids. The IR spectrum for 3 indicated the presence of an acylating aliphatic acid by the ester carbonyl absorption at 1720 cm−1. Further, the presence of signals at 2.28 ppm and 3.34 ppm in 1H-NMR, showed that pigment 3 was acylated with acetyl and malonyl groups, respectively. Thus, according to 1H-NMR, IR and UV-Visible spectral data, the chemical structure of pigment 3 should be malvidin 3-O-(6-O-malonyl, 3-O-acety-β -D-glucoside).
Table 1. Chemical shifts of 1H-NMR of five anthocyanins in CD3OD or CD3OD/TFAd (98:2 v/v)
Carbon 1,δ Ref. 2,δ Ref. 3,δ Ref. 4,δ Ref. 5,δ Ref.
Aglycone
4 8.96s 9.00 9.06s 9.05 9.03s 9.04 9.00s 9.00 8.96s 8.96
6 6.64s 6.65 7.07d 7.09 6.67s 6.67 6.65s 6.65 6.62s 6.64
8 6.90s 6.90 7.28d 7.30 6.99s 6.98 6.92s 6.90 6.88s 6.86
2′ 7.75s 7.77 8.24d 8.23 7.99s 7.99 7.78s 7.77 7.77s 7.77
3′ - - -
5′ - - 7.19d 7.18 - - -
6′ 7.96s 7.98 8.34m 8.37 7.99s 7.99 7.98s 7.97 7.77s 7.77
−OMe 3.99s 3.99 3.96s 3.97 4.00s 4.00 3.99s 3.99 - -
3-glucose
1″ 5.36d 5.33 5.34d 5.32 5.35d 5.33 5.31nd 5.30 5.33nd 5.30
2″ 3.67 3.66 3.74 3.75 3.67m 3.66 3.62 3.62 3.62 3.62
3″ 5.10 5.10 5.10 5.10 5.10 5.10 3.56 3.55 3.55 3.55
4″ 3.55 3.55 3.57 3.57 3.55 3.55 3.43 3.43 3.43 3.43
5″ 3.57 3.57 3.74 3.75 3.57 3.57 3.68 3.66 3.67 3.66
6″A 3.69 3.70 4.02 3.98 3.69 3.70 3.69 3.71 3.69 3.71
6″B 3.91 3.91 4.05 4.04 3.91 3.91 3.91 3.91 3.92 3.91
5-glucose
1′″ 5.11 5.13 5.16 5.16
2′″ 3.53 3.53 3.55 3.52
3′″ 3.41 3.41 3.41 3.41
4′″ 3.33 3.33 3.34 3.32
5′″ 3.60 3.59 3.55 3.52
6′″A 3.77 3.76 3.62 3.62
6′″B 3.81 3.81 3.62 3.62
Acetyl group 1.99s 1.99 3.94s 3.95 2.28s 2.27 2.26s 2.27 2.27s 2.27 Malonyl group 3.41s 3.41 3.37s 3.37 3.39s 3.38
nd: non detect, s: singlet, d: doublet, m: multi
Table 2. UV-Visible spectral data of Siahe Sardasht grape anthocyanins
Samples Vismax (nm) UVmax (nm) A440/AVis-max (%) AUV-max/AVis-max Acyl moiety (nm) Aacyl/AVis-max
1 540 277 15 76 Sh
2 530 277 11 28 Sh
3 540 278 19 49 352 18
4 541 278 18.5 44 352 20
5 542 277 7 23 360 46
Table 3. Rf Values of five anthocyanins from Siahe Sardasht grapes in solvent systems BFW (n-butanol, formic acid, water; 60:25:100 v/v), BuH (n-butanol, hydrocholoric acid; 1:1 v/v) and EFAW (ethanol, formic acid, acetic- acid, water; 100:11:101:26 v/v)
Pigment Rf Vol. (100×)
BFW BuH EFAW
1 70 73 67.6
2 46 25 57
3 32 18 50
4 23 12 43
5 10 10 33
organic acids. AUV-max/AVis-max ratio for this pigment was 44%, indicating the presence of 3-glycoside substitution. 1H-NMR spectral data (Table 1) for the glucosyl moiety showed that, anomeric proton chemical shift was in the region of 5.32 ppm, but it's doublet was not detected. Thus, the coupling constant was not calculated for α or β configuration of sugar moiety. The methylen protons of C6 of sugar moiety shifted to a low magnetic field (3.91 ppm), indicating the OH of this carbon to be bound to an organic acid. IR spectrum for 4
indicated the presence of the acylating aliphatic acid by ester carbonyl absorption at 1722 cm−1. According to the IR spectrum and 2.26 ppm signal in 1H-NMR spectrum, we suggested that this pigment was acylated by acetyl group, and should be petunidin-3-O-(6-O-acetyl-glucosid).
The UV-Visible spectral data showed that pigment 5
has a maximum absorption band at 277 nm in UV region and at 542 nm in the visible region (Table 2). The A440/A530 ratio for this pigment was 7%, and AUV-max/AVis-max ratio was 23%. These results indicated that carbons 3 and 5 of this pigment were occupied by glucose. The presence of a peak at 360 nm region, indicated that pigment 5 was acylated with organic acid. In the 1H-NMR spectrum (Table 1) of pigment 5 there were signals at 5.33 ppm and 5.16 ppm for anomeric protons that were related to glucoses at 3 and 5 positions, respectively. This indicated that the glucose moiety (gl.2) with an anomeric proton resonance at δ
5.16 must be attached at the 5-OH position, while glucose 1, with an anomeric proton resonance at δ 5.33 must be attached at the 3-OH position of pigment. Since
the coupling constants for these protons were not calculated, bonds between these glucoses and pigment were not detected. The chemical shift values for the 6-CH2 protons of glucose 1 were shifted downfield (Table1), indicating acylation at the C-6 position. According to IR absorption at 1720 cm−1 and proton NMR signals at δ 2.27 ppm, this pigment must be acylated with acetyl group, and the pigment 5 should be delphinidin 3-O-(6-O-acetyl glucoside)-5-O -glucoside.
References
1. Chen L.F. and Luh B.S. Anthocyanins in Royalty grapes.
J. Food Sci., 32: 66-74 (1967).
2. Fuleki T. and Francis F.J. Quantitative methods for anthocyanins. 1. Extraction and determination of total anthocyanin in Cranberries. Ibid., 33: 72-77 (1968). 3. Harborne J.B. Biochemistry of Phenolic Compounds.
Academic Press, London and New york (1964).
4. Harborne J.B. Phytochemical Methods. Academic Press. London (1988).
5. Hosokawa K., Fukushi E., Kawabata J., Fujii C., Ito T., and Yamamura S. Seven acylated anthocyanins in blue flowers of Gentiana. Phytochemistry, 45(1): 167-171 (1997).
6. Ishikawa T., Kondo T., Kinoshita T., Haruyama H., Inaba S., Takeda K., Grayer R.J., and Veitch N.C. An acylated anthocyanin from the blue petals of Saliva uliginosa.
Ibid., 5: 517-521 (1999).
7. Kosir I.J. and Kidric J. Use of modern nuclear magnetic resonance spectroscopy in wine analysis: determination of minor compounds. Analytica Chimia Acta, 458: 77-84 (2002).
8. Lees D.H. and Francis F.J. Quantitative methods for anthocyanins. J. Food Sci., 36: 1056-1060s (1971). 9. Mateus N., Silva A.M.S., Santos-Buelga C.S.,
Rivas-Gonzalo J.C., and Freitas V.D. Identification of anthocyanin-flavanol pigments in red wines by NMR and mass spectroscopy. J. Agric. Food Chem., 50: 2110-2116 (2002).
10. Pale E., Nacro M., Vanhaelen M., and Vanhaelen-Fastre R. Anthocyanins from Bambara Groundnut (Vigna subterranean). Ibid., 45: 3359-3361 (1997).
11. Philip T. Anthocyanins of beauty seedless grape. J. Food Sci., 39: 449-451 (1974).
12. Sakellariades H.C. and Luh B.S. Anthocyanins in Barbera grapes. Ibid., 39: 329-333 (1974).
13. Shrikhande A.J. and Francis F.J. Anthocyanin pigments of Sour Cherries. Ibid., 38: 649-651 (1973).