Please cite this article as: A. Doniavi, A. Hosseini, G. Ranjbary, Prediction and Optimization of Mechanical Properties of St52 in GMAW Using Response Surface Methodology and ANOVA, International Journal of Engineering (IJE), TRANSACTIONS C: Aspects Vol. 29, No. 9, (September 2016) 1307-1313
International Journal of Engineering
J o u r n a l H o m e p a g e : w w w . i j e . i rPrediction and Optimization of Mechanical Properties of St52 in Gas Metal Arc Weld
Using Response Surface Methodology and ANOVA
A. Doniavi*, A. Hosseini, G. Ranjbary
Mechanical Engineering Department, Faculty of Engineering, Urmia University, Urmia, Iran
P A P E R I N F O
Paper history:
Received 05 June 2016
Received in revised form 01 July 2016 Accepted 20 July 2016
Keywords: Gas Metal Arc Weld Response Surface Methodology ANOVA
St52 Tensile Strength
A B S T R A C T
Many researchers have developed algorithms to predict welding parameters. The variety of welding types is broad because the confine mixture of pressure and temperature could be selected. This paper introduces a response surface methodology (RSM) for optimization and prediction of the influence of Ar and CO2 gases and electrical current on tensile strength of St52’s gas metal arc weld (GMAW) line.
After doing experiments the optimum levels of input variables for achieving high tensile strength and contribution of parameters have been obtained by RSM and ANOVA; respectively. In this study the maximum error is 0.44%. Thus it can be concluded that, RSM is one of the best methods and can be used to predict the output parameters and save the time and cost of additional experiments.
doi: 10.5829/idosi.ije.2016.29.09c.17
1. INTRODUCTION1
Gas metal arc welding (GMAW), sometimes referred to its subtypes as metal inert gas (MIG) welding or metal active gas (MAG) welding, is a welding process in which an electric arc forms between a consumable wire electrode and the work piece metal (s), causing them to melt and join. The mechanical properties of welding are very important aspect of manufacturing. Because of high quality, gas metal arc welding (GMAW) is one of the best processes in manufacturing due to its high speed and both manual and automatic modes of welding for wide range of ferrous and nonferrous metal parts [1]. St52 is most commonly used for structural assemblies where good weld ability and tensile strength are advantages. The quality of welding work pieces is influenced by input parameters. Because of variety of input parameters the control and optimization of welding process is very difficult then optimization of any welding process is a costly and time consuming task, due to many kinds of non-linear events involved.
1*Corresponding Author’s Email:[email protected] (A. Doniavi)
One of the most widely used methods to solve this problem is response surface methodology (RSM), because it is easy to estimate and apply, even when little is known about the process. In RSM the experimenter tries to approximate the unknown mechanism with an appropriate empirical model. Identifying and fitting from experimental data, a good response surface model requires some knowledge of statistical experimental design fundamentals, regression modeling techniques and elementary optimization methods [2].
In this research by control of shielding gas percentages (18% CO2+82% Ar, 2.5% CO2+97.5% Ar
2. LITERATURE
In recent years, many researchers have investigated the relationship between the input parameters and output variables. There are many optimization methods like GA, PSO, Taguchi, grey relational and etc, that their applications will be referred in the following studies. The correlation between welding parameters and bead geometry of 3F fillet joint (a vertical weld done using a fillet joint) welded by GMAW in downhill position has been investigated by Tham et al. [3]. A calculator has been developed to display the values of weld bead geometry for any value of welding parameter and vice versa. The comparison between genetic algorithm (GA) and RSM has been done by Correia et al. [4]. The situation was to choose the best values of three control variables (voltage, wire feed rate and welding speed) based on four quality responses (deposition efficiency, bead width, depth of penetration and reinforcement). It was found from their investigation that GA can be a powerful tool in experimental welding optimization, even when the experimenter does not have a model for the process. However, the optimization by GA technique requires a good setting of its own parameters, such as population size, number of generations, etc. Otherwise, there is a risk of an insufficient sweeping of the search space. RSM technique found a better compromise between the evaluated responses than GA [4]. Besides, RSM generated models can be useful in further investigations of the search space, avoiding the experiments with undesired predicted responses. Micro-Macro-characterization and modeling of mechanical properties of gas metal arc welding (GMAW) DP600 steel has been done by Ramazani et al. [5]. Kubiak et al. [6], have done laser and GMAW welding process with experimental verification. They concluded that application of Kriging method in the numerical analysis allows to specify Yb:YAG laser power distribution in more precise way by reproduction of the real thermal load depending on the laser profile obtained for specified industrial laser. From performed analysis it can be observed that two heat sources in hybrid welding process are cooperating in a single welding pool. The geometry of the weld at the top surface mainly depends on the arc heat source. Laser beam heat source determines the weld penetration depth, thus at lower parts the weld is more laser-like. Process parameter optimization of lap joint fillet weld based on FEM– RSM–GA integration technique has been carried out by Islam et al. [7]. This method is able to search for optimum set of process parameters for minimum distortion while ensuring sufficient weld penetration. In this optimization problem, a straightforward solution approach was to run all possible combinations and select the best one as optimum solution. In this approach, obviously the number of combinations will be very large and it would be computationally inefficient
and infeasible to try to run all combinations. Using RSM and GA, they achieved optimum results with 75 FE simulations. So, the method was certainly effective for this case study. Zhang et al. [8] have investigated the effect of fluid flow in the weld pool on the numerical simulation accuracy of the thermal field in hybrid welding (Laser and GMAW-P hybrid welding). They found that the convective heat transfer caused by fluid flow has a significant effect on the temperature distribution in the hybrid welding, thus on the thermal cycles, and the coupled model of fluid flow and heat transfer obviously improves the calculation accuracy of thermal cycles.
Xueping et al. [9] have done a numerical analysis of arc plasma behavior in double-wire GMAW and concluded that with the same welding parameters, the pressure on the work piece is less in double wire-GMAW than that in single wire-wire-GMAW and it decreases the occurrence of undercut and humping. The magnetic flux density distribution presents circular in
SW-GMAW but elliptic in DW-GMAW. The
welding parameters for welding of P92 material using Taguchi based grey relational analysis has been done by Shanmugarajan et al. [21]. They concluded that (1) Taguchi based optimisation of laser welding parameters for autogenous laser welding of P92 material has shown that for the given conditions, 3 kW laser power, 1 m/ min welding speed and positioning the focal plane of the laser at 4 mm from the surface of the base material have evolved as the optimal parameters. (2) From ANOVA, amongst the parameters experimented, welding speed has the most significant contribution with 74.39% followed by laser power with 14.63% and focal length with 10.97%. (3) Microhardness survey across welds with optimised parameter did not indicate any softening in the HAZ/BM boundary and microstructural analysis did not reveal any deleterious phases, which confirms that the parameters obtained through optimisation are valid.
3. RESPONSE SURFACE METHODOLOGY
The procedure of RSM consists of the following steps [2, 14]:
1) Design of experiments (DOE) 2) Development of approximate model 3) Optimization of approximate model
4) Representation of direct and interactive effects of the process parameters through two and three dimensional plots and determination of the optimized results
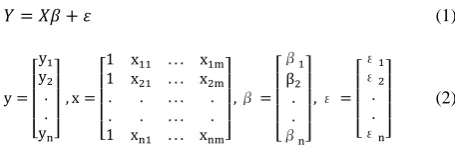
In step 2, the polynomial function is usually assumed to be the approximate model for the response surface in order to simplify the procedure, when the number of experiments is n, a second order model can be expressed by the following matrix equation:
(1)
[ ]
[
] [ ] [ ]
(2)
where y is the response vector, x is the design variable matrix, β is the regression coefficient vector, ε is the random error term and m is the number of design variables. The details of this method are well described elsewhere [2].
4. EXPERIMENTAL METHOD
In this study an attempt is made to explore the influence of two elements: proportion of shielding gasses Ar and CO2 and electrical current on welding of St52's tensile
strength through GMAWand using Er70S-6 electrode.
Because high tensile strength of weld line is considered as best quality property of welding, it is used as response variable in this research. So by control of shielding gas percentages (18% CO2+82% Ar, 2.5%
CO2+97.5% Ar and 100% Ar) and electrical current
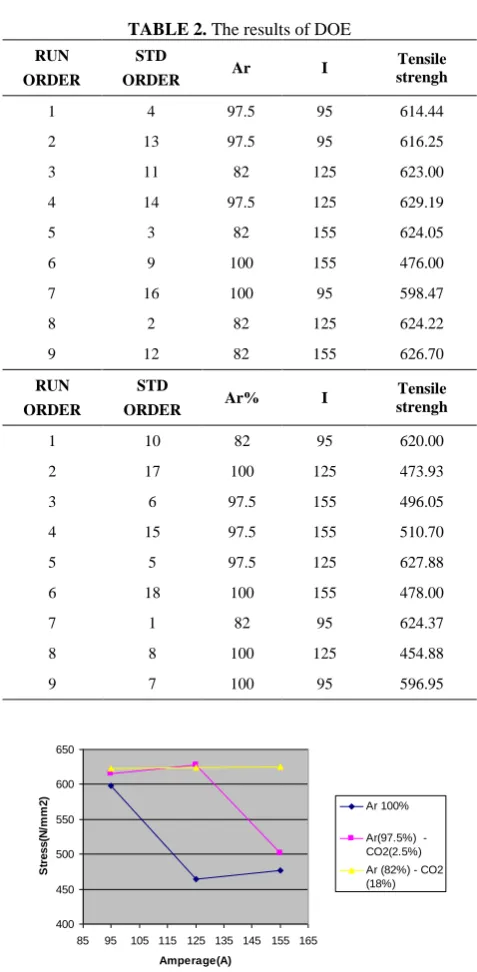
(155 A, 125 A and 95 A) and then according to tensile tests, at first in experimental form and then using DOE method by Minitab software the effects of these factors on tensile strength have been examined. Full factorial design of experiments has been used to cover all of states. In statistics, a full factorial experiment is an experiment whose design consists of two or more factors, each with discrete possible values or "levels", and whose experimental units take on all possible combinations of these levels across all such factors. Such an experiment allows the investigator to study the effect of each factor on the response variable, as well as the effects of interactions between factors on the response variable. In this paper, we have two factors with three levels. The results of experiments and DOE have been shown in Tables 1 and 2.
Comparison of three different levels based on increasing electrical current and Ar are shown in Figures 1 and 2, respectively. According to the figures by increasing electrical current and Ar percentage, the tensile strength decreases intensively because in the same temperature the heat coefficient of Ar is lower than CO2.
5.RESULTS AND DISCUSSION
5. 1. Regression Models for Prediction of Tensile Strength According to test results, suitable models have been provided for estimation of tensile strength with reliability of 95%. Analysis of variance has been done for modeling and coefficients of variables. Finally the adequacy of modeling has been investigated by residual diagrams.
TABLE 1. The values of input parameters
Number of work pieces Percentage of gas
Electrical current (A)
1 82% Ar+18% CO2
95
2 82% Ar+18% CO2
125
3 82% Ar+18% CO2
155
4 97.5% Ar+2.5% CO2
95
5 97.5% Ar+2.5% CO2
125
6 97.5% Ar+2.5% CO2
155
7 100% Ar
95
8 100% Ar
125
9 100% Ar
TABLE 2. The results of DOE Tensile strengh I Ar STD ORDER RUN ORDER 614.44 95 97.5 4 1 616.25 95 97.5 13 2 623.00 125 82 11 3 629.19 125 97.5 14 4 624.05 155 82 3 5 476.00 155 100 9 6 598.47 95 100 16 7 624.22 125 82 2 8 626.70 155 82 12 9 Tensile strengh I Ar% STD ORDER RUN ORDER 620.00 95 82 10 1 473.93 125 100 17 2 496.05 155 97.5 6 3 510.70 155 97.5 15 4 627.88 125 97.5 5 5 478.00 155 100 18 6 624.37 95 82 1 7 454.88 125 100 8 8 596.95 95 100 7 9
Figure 1.The effect of electrical current on tensile strength
Figure 2.The effect of Ar percentage on tensile strength
The second order model coefficients and the adequacy of them have been shown in Table 3. According to this table the primary model for coding data is:
(2)
ANOVA table helps to select suitable coefficients in Equation (2). P and T values should compare with statistic tables for T and P. Firstly the values in ANOVA should be less than statistic table values. Secondly P values should be less than 0.05 to be accepted as a valid coefficient.
According to Table 3, percent of Ar*Percent of Ar and Amperage*Amperage will be removed from Equation (2). Then the final model for coding variables is:
(3)
Analysis of variance (ANOVA) and residual versus order diagrams for checking of modeling efficiency have been shown in Table 4 and Figure 3, respectively. According to ANOVA table, it has been claimed that the modeling of tensile strength is attributable and reliable.
The efficiency of modeling can be realized from Figure 3. The normal probability plot is in linear form. The residual versus order plot shows that the randomizing has been done well and there is not a meaningful relationship between residuals. The residual histogram is not attributable because the number of tests is low. Residual versus time shows that there is not any meaningful sequence among residuals. The residuals are dispersing. According to Figure 4 it can be seen that the tensile strength decreases with increasing the electrical current and percentage of Ar but due to the slope of the graph, it can be seen that the impact of changes in the amount of argon gas is higher than the amperage changes. The experimental results have been shown with points.
TABLE 3. Estimated regression coefficients
P-value T SE Coef. Coef. Term 0.000 30.539 19.04 581.542 Constant 0.000 -5.306 10.43 -55.342 Percent of Ar
0.003 -3.677 10.43 -38.248 Amperage 0.452 -0.777 18.07 -14.038 Percent of Ar*Percent of Ar
0.943 0.073 18.07 1.315 Amperage*Amperage 0.032 -2.42 12.77 -30.975 Percent of Ar*Amperage
400 450 500 550 600 650
85 95 105 115 125 135 145 155 165
Amperage(A) S tr e s s (N /m m 2 ) Ar 100%
Ar(97.5%) -CO2(2.5%) Ar (82%) - CO2 (18%) 400 450 500 550 600 650
75 80 85 90 95 100 105
percent of Ar(%)
TABLE 4. Analysis of variance
P-value T
SE Coef. Coef.
Term
0.000 30.539 19.04
581.542 Constant
0.000 -5.306 10.43
-55.342 Percent of Ar
0.003 -3.677 10.43
-38.248 Amperage
0.452 -0.777 18.07
-14.038 Percent of Ar*Percent of Ar
0.943 0.073 18.07
1.315 Amperage*Amperage
0.032 -2.42 12.77 -30.975 Percent of Ar*Amperage
To better understand how tensile strength changes by changing the input variables, three-dimensional curved surface is shown in Figure 5. As it can be seen from Figure 5, the maximum amount of tensile strength is obtained when Ar gas percentage is 82% and electrical current is 155 A and the minimum amount of tensile strength is obtained when Ar gas percentage is 100% and electrical current is 155 A.
5. 2. Numerical Optimization of the process
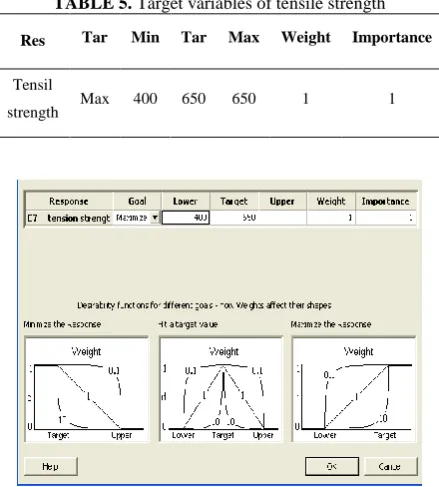
Input variables for desired condition have been shown in Table 5.
Figure 3. Diagrams for checking of modeling efficiency
Figure 4. Contour plot of tensile strength versus amperage and percentage of Ar
Figure 5. Surface plot of tension strength versus amperage and percentage of Ar.
The output of Minitab software has been shown in Figures 6 and 7. According to Figure 7 and Table 6 the optimum value for tensile strength of weld line, optimum amount of electrical current and percentage of Ar has been obtained. In the other words, the values in Figure 7 have been applied in Table 6. These figures show that both electrical current and percentage of Ar have opposite effect on tensile strength.
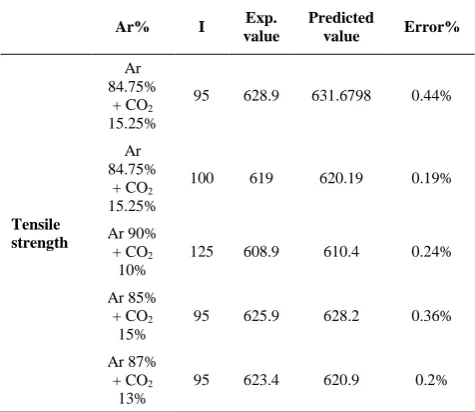
The evaluation of modeling and optimization has been done by five experiments that is shown in Table 7. According to Table 7, there is a good accordance between the experimental and predicted values. The maximum error is 0.44 %.
TABLE 5. Target variables of tensile strength
Importance Weight
Max Tar Min Tar Res
1 1
650 650 400 Max Tensil
strength
Figure6. Desirability functions for different goals 100
50 0 -50 -100 99 90 50
10 1
Residual
P
er
ce
nt
650 600 550 500 100
50 0 -50 -100
Fitted Value
R
es
id
ua
l
80 40 0 -40 -80 4 3 2 1 0
Residual
F
re
q
ue
nc
y
18 16 14 12 10 8 6 4 2 100
50 0 -50 -100
Observation Order
R
es
id
ua
l
Normal Probability Plot Versus Fits
Histogram Versus Order
Residual Plots for TS
Ar(%)
A
100 96 92 88 84 150
140
130
120
110
100
> – – – – < 480
480 510
510 540
540 570
570 600
600 TS
Contour Plot of TS vs A, Ar(%)
160 140 450
500 550
120 600
85 90 100
95 100
TS
A
Ar(%)
Figure 7. The optimum value for tensile strength
TABLE 6. The results of optimization
Desirability Estimated
value Electrical
current Percentage of Ar
92% 631.6798
95 Ar 84.75% + CO2
15.25%
TABLE 7. The evaluation of optimization
Error% Predicted
value Exp.
value I
Ar%
0.44% 631.6798
628.9 95
Ar 84.75%
+ CO2
15.25%
Tensile strength
0.19% 620.19
619 100 Ar
84.75% + CO2
15.25%
0.24% 610.4
608.9 125 Ar 90%
+ CO2
10%
0.36% 628.2
625.9 95
Ar 85% + CO2
15%
0.2% 620.9
623.4 95
Ar 87% + CO2
13%
6. CONCLUSION
This study carried out an optimization and proposed a prediction model to investigate the weld line tensile strength based on electrical current and percentage of Ar gas in GMAW using RSM and ANOVA. The study not only presents a model to predict the tensile strength but also optimize the process for achieving the higher strength value. The lower the temperature difference between the weld HAZ areas is the lower tensile stress in weld line. It is due to slower heat transfer and uniform solidification. Then less temperature difference between the weld line and the surrounding area will
increase weld strength. It can be achieved with increasing the amount of CO2 percentage. In this study
the maximum error between predicted and experimental values for tensile strength is 0.44%. Thus it can be concluded that, RSM is one of the best methods of optimization and it can be used to predict the output parameters and save the time and cost of additional experiments.
7. REFERENCES
1. Moore, K., Naidu, D. and Ozcelik, S., "Modeling, sensing and control of gas metal arc welding", Kidlington (UK): Elsevier Science Ltd, (2003).
2. Montgomery, D.C., "Design and analysis of experiments, John Wiley & Sons, (2008).
3. Tham, G., Yaakub, M.Y., Abas, S.K., Manurung, Y.H. and Jalil, B.A., "Predicting the gmaw 3f t-fillet geometry and its welding parameter", Procedia Engineering, Vol. 41, (2012), 1794-1799. 4. Correia, D.S., Gonçalves, C.V., da Cunha, S.S. and Ferraresi, V.A., "Comparison between genetic algorithms and response surface methodology in gmaw welding optimization", Journal of Materials Processing Technology, Vol. 160, No. 1, (2005), 70-76.
5. Ramazani, A., Mukherjee, K., Abdurakhmanov, A., Prahl, U., Schleser, M., Reisgen, U. and Bleck, W., "Micro–macro-characterisation and modelling of mechanical properties of gas metal arc welded (gmaw) dp600 steel", Materials Science and
Engineering: A, Vol. 589, (2014), 1-14.
6. Kubiak, M., Piekarska, W., Saternus, Z. and Domański, T., "Numerical prediction of fusion zone and heat affected zone in hybrid yb: Yag laser+ gmaw welding process with experimental verification", Procedia Engineering, Vol. 136, (2016), 88-94.
7. Islam, M., Buijk, A., Rais-Rohani, M. and Motoyama, K., "Process parameter optimization of lap joint fillet weld based on fem–rsm–ga integration technique", Advances in Engineering
Software, Vol. 79, (2015), 127-136.
8. Zhang, Z. and Wu, C., "Effect of fluid flow in the weld pool on the numerical simulation accuracy of the thermal field in hybrid welding", Journal of Manufacturing Processes, Vol. 20, (2015), 215-223.
9. Xueping, D., Huan, L., Huiliang, W. and Jiquan, L., "Numerical analysis of arc plasma behavior in double-wire gmaw", Vacuum, Vol. 124, (2016), 46-54.
10. Holimchayachotikul, P., Laosiritaworn, W., Jintawiwat, R. and Limcharoen, A., "Optimization of gas metal are welding parameters for st 37 steel using support vector regression", in The IE network conference., (2007), 189-193.
11. Tusek, J. and Suban, M., "Experimental research of the effect of hydrogen in argon as a shielding gas in arc welding of high-alloy stainless steel", International Journal of Hydrogen Energy, Vol. 25, No. 4, (2000), 369-376.
12. Durgutlu, A., "Experimental investigation of the effect of hydrogen in argon as a shielding gas on tig welding of austenitic stainless steel", Materials & Design, Vol. 25, No. 1, (2004), 19-23.
13. Ebrahimnia, M., Goodarzi, M., Nouri, M. and Sheikhi, M., "Study of the effect of shielding gas composition on the mechanical weld properties of steel st 37-2 in gas metal arc welding", Materials & Design, Vol. 30, No. 9, (2009), 3891-3895.
homogeneity in aerospace forgings", Chinese Journal of
Aeronautics, Vol. 23, No. 2, (2010), 260-267.
15. Chandrasekaran, K., Marimuthu, P. and Raja, K., "Prediction model for cnc turning on aisi316 with single and multilayered cutting tool using box behnken design (research note)",
International Journal of Engineering-Transactions A: Basics,
Vol. 26, No. 4, (2012), 401-410.
16. Nikoi, R., Sheikhi, M. and Arab, N.B.M., "Experimental analysis of effects of ultrasonic welding on weld strength of polypropylene composite samples", International Journal of
Engineering-Transactions C: Aspects, Vol. 28, No. 3, (2014),
447-453.
17. Hashemi, H., Shaharouna, A.M., Sudin, I., Bijan, G., Zafar, N. and Saeed, S., "Fixture design automation and optimization techniques: Review and future trends", International Journal of
Engineering, Vol. 27, (2014), 1787-1794.
18. Rezaei, G.R. and Arab, N.B.M., "Investigation on tensile
strength of friction stir welded joints in pp/epdm/clay nonocoposits", International Journal of
Engineering-Transactions C:Aspects, Vol. 28, No. 9, (2015), 1383-1391.
19. Ai, Y., Shao, X., Jiang, P., Li, P., Liu, Y. and Liu, W., "Welded joints integrity analysis and optimization for fiber laser welding of dissimilar materials", Optics and Lasers in Engineering, Vol. 86, No., (2016), 62-74.
20. Nandagopal, K. and Kailasanathan, C., "Analysis of mechanical properties and optimization of gas tungsten arc welding (gtaw)
parameters on dissimilar metal titanium (6al 4v) and aluminium 7075 by taguchi and anova techniques", Journal of Alloys and
Compounds, Vol. 682, No., (2016), 503-516.
21. Shanmugarajan, B., Shrivastava, R., Sathiya, P. and Buvanashekaran, G., "Optimisation of laser welding parameters for welding of p92 material using taguchi based grey relational analysis", Defence Technology, Vol., No., (2016).
Prediction and Optimization of Mechanical Properties of St52 in Gas Metal Arc Weld
Using Response Surface Methodology and ANOVA
A. Doniavi, A. Hosseini, G. Ranjbary
Mechanical Engineering Department, Faculty of Engineering, Urmia University, Urmia, Iran
P A P E R I N F O
Paper history:
Received 05 June 2016
Received in revised form 01 July 2016 Accepted 20 July 2016
Keywords: Gas Metal Arc Weld Response Surface Methodology ANOVA
St52 Tensile Strength
ديكچ ه
متیروگلا یناوارف یاه ریخا تاعلاطم رد
اب هلاقم نیا رد.تسا هدض هئارا یراکضوج دنیارف رد رثوم یاهرتماراپ ینیب صیپ تهج
شور زا هدافتساRSM یططک ماکحتسا یزاس هنیهب و ینیب صیپ هب ،نبرک دیسکا ید و نوگرآ یاهزاگ رادقم ریثات هعلاطم و
دلاوف St52 دنیارف ردGMAW طسوت یدورو یاهرتماراپ هنیهب حوطس تاطیامزآ ماجنا زا سپ .تسا هدض هتخادرپRSM و
ANOVA تفرگ هجیتن ناوتیم نیاربانب .دضابیم %4.00 اطخ رادقم نیرتطیب هلاقم نیا رد.تسا هدمآ تسدبRSM زا یکی