Research Paper:
The Reliability and Validity of the Persian Version of
Pittsburgh Sleep Quality Index in Iranian People
Naser Mohammad Gholi Mezerji1 , Parisa Naseri2 , Zohreh Omraninezhad3, Zahra Shayan4*1. Department of Biostatistics and Epidemiology, School of Health, Students Research Committee, Hamadan University of Medical Sciences, Hamadan, Iran. 2. Department of Biostatistics, School of Allied Medical Sciences, Shahid Beheshti University of Medical Sciences, Tehran, Iran.
3. Department of Biostatistics, School of Health, Arak University of Medical Sciences, Arak, Iran.
4. Trauma Research Center, Department of Biostatistics, School of Medicine, Shiraz University of Medical Sciences, Shiraz, Iran.
* Corresponding Author:
Zahra Shayan, PhD.
Address: Trauma Research Center, Department of Biostatistics, School of Medicine, Shiraz University of Medical Sciences, Shiraz, Iran.
E-mail: shayanz@sums.ac.ir
Introduction: Sleep disturbances are a significant public health issue and such problems are associated with a number of psychiatric disorders. The Pittsburgh Sleep Quality Index (PSQI) is an effective instrument frequently used to evaluate sleep style and quality.
Objectives: The present study aimed to assess the reliability, validity, and factor structure of the Persian version of PSQI.
Materials and Methods: This cross-sectional study was conducted on 1115 citizens of Arak City, Iran aged 18-60 years. They were selected by stratified random sampling method from different parts of the city. The following aspects of the Persian version of PSQI were evaluated to assess its validity and reliability. To assess the validity of the content, the questionnaire was sent to a panel of 15 academic members consisting of experts in the fields of psychology and health education. The internal consistency of the PSQI questionnaire was evaluated by the Cronbach alpha coefficient and item-scale correlation. To investigate the factor structure of the PSQI, Exploratory Factor Analysis (EFA) was performed with a 2-factor solution and varimax rotation. The extraction of principal factors was performed after varimax orthogonal rotation and Kaiser’s criterion. At last, Confirmatory Factor Analysis (CFA) was applied to assess the reliability of the PSQI questionnaire. All analyses were performed in SPSS V. 16.0 and AMOS for Windows.
Results: The Persian version of PSQI was evaluated in the study with regard to its internal consistency and factor structure. The result showed excellent item content validity index (≥0.78) and excellent scale content validity index (≥0.90). The result of the Cronbach alpha coefficient was 0.65. The factors of perceived sleep quality and sleep efficiency were extracted by means of factor analysis and these two factors explained 51.75% of the total variance. Confirmatory factor analysis results show the model’s satisfactory fitting based on adequacy criteria goodness of fit index, goodness of fit index adjusted for degrees of freedom, root mean square error of approximation, and comparative fit index. The non-normed fit index was close to its reference value of 0.90.
Conclusion: In general, findings suggest that the Persian version of PSQI displayed satisfactory validity and reliability to measure the quality of sleep of Iranian people, at least citizens of Arak City, Iran.
A B S T R A C T
Keywords:
Sleep, Psychometrics, Reliability and validity, Factor analysis
Citation Mohammad Gholi Mezerji N, Naseri P, Omraninezhad Z, Shayan Z. The Reliability and Validity of the Persian
Ver-sion of Pittsburgh Sleep Quality Index in Iranian People. Avicenna J of Neuropsychophysiology. 2017; 4(3):95-102. http://dx.doi. org/10.32598/ajnpp.4.3.95
:
http://dx.doi.org/10.32598/ajnpp.4.3.95 Use your device to scan
and read the article online
Article info: Received: 10 Dec 2016
Accepted: 15 Apr 2017
1. Introduction
leep is a physical and mental resting state in which a person becomes relatively inactive and careless of their environment. Sleep problems include the inability to fall asleep or go back to sleep and frequent waking up during the night; such problems affect not only occupa-tional and educaoccupa-tional functioning but also the safety and quality of life. Sleep disorders can increase tension; cause irritability, depression, and confusion; and have an adverse impact on the quality of life in general [1].
Different instruments such as several questionnaires have been developed to assess sleep disturbances. Standardized questionnaires provide comprehensive assessments of sleep quality, but these questionnaires are few. One of the most widely used instruments in clinical and research settings is the Pittsburgh Sleep Quality Index (PSQI) questionnaire. This questionnaire was introduced by Buysse as a fast and valid instrument for determining sleep quality and sleep disorders [2]. Different studies applied PSQI for detecting sleep disor-ders among the general population [3], working people
[4], and clinical populations [5-9]. The PSQI has been evaluated for its reliability and validity in different popu-lations as different cultures have different perceptions of sleep and its problems. Cole examined the factor structure of the PSQI using confirmatory factor analysis in older adults. The study found that a 3-factor model was a better fit than a 1-factor model [10].
A study done by Aloba, however, confirmed a 3-factor model generated by principal component analysis with the best cut-off score at 5 (sensitivity 0.720, specificity 0.545, and overall correct classification rate of 0.554) among Nigerian university students. The concurrent validity of the PSQI is further supported by its modest correlation with the General Health Quality (GHQ)-12 scores (r=0.252, P<0.001) [11]. Burkhalter conducted a confirmatory factor analysis of the PSQI in renal transplant recipients and concluded that the 3-factor model had a weak fit [χ2=11.850, df=8, P=0.408; Root
Mean Square Error of Approximation (RMSEA)=0.060; Weighted Root Mean square Residual (WRMR)=0.384; Confirmatory Fit Index (CFI)=0.992] [12].
Mariman used factor analysis for validation of the PSQI in patients diagnosed with chronic fatigue syndrome and obtained a 3-factor model. All factor loadings were significant and all goodness-of-fit values were in accept-able range [χ2=14.70, df=11, P=0.20; Goodness of Fit
In-dex (GFI)=0.99; Adjusted Goodness of Fit InIn-dex (AGFI)
for Degrees of Freedom=0.97; CFI=0.99; RMSEA=0.03; The Consistent version of the Akaike Information Cri-terion (CAIC)=134.10]. Similarly, the 1-factor model suggested by Buysse et al. indicated a poor fit with the data (χ2=109.90, df=14, P<0.001; GFI=0.92; AGFI=0.85;
CFI=0.84; RMSEA=0.13; CAIC=208.23) [13]. Results of the study conducted by Tomfohr showed that a 3-factor model was better than 1-factor model in English ing non-Hispanic whites and English and Spanish speak-ing Hispanics of Mexican descendens.
The Cronbach alpha values were stating of adequate in-ternal consistency (Non-Hispanic Whites (NHW) α=0.775; English-speaking Hispanics of Mexican Descent (HMD) α=0.741; HMD α=0.770) [14]. But in another study, Otte indicated a 2-factor model as the best model for breast cancer patients (χ2=89.70, df=13, P<0.05, Standardized
Root Mean Square Residual (SRMR)=0.0048, Root-Mean Square Error Approximation (RMSEA)=0.075, CFI=0.98)
[15]. Cultural and demographic differences can lead to differences in factor structure results of the PSQI be-cause sleep quality and perceptions of sleep are related to various factors such as sex, age, health, and culture. Therefore, this study aimed to assess the internal consis-tency, reliability, and factor structure of the PSQI for the citizens of Arak City, Iran.
2. Materials and Methods
Study subjects
A pilot study on 50 individuals was conducted to de-termine the internal consistency and item-total correla-tions of the PSQI. This pilot study confirmed the reliabil-ity of the PSQI questionnaire. Then in a cross-sectional study, 1115 Arak citizens aged 18-60 years, were se-lected by stratified random sampling method in 2015. In the first stage, the city was divided into three areas (S1, S2, and S3).
In the second stage, the samples were selected ran-domly from each area with proportional to area size (N1, N2, and N3). All participants provided verbal in-formed consent for using their information in this study. The participants were included in the study who were ≥18 years old, with illiterate level education, without psychotic or cognitive disorders, and not hos-pitalized or received outpatient treatment in the last month. All samples were interviewed face to face by a trained researcher.
variables were assessed, too. The variables that may af-fect sleep were evaluated, such as age, sex, and educa-tion level. This study was approved by the Ethics Com-mittee of Arak University of Medical Sciences and each sample expressed his or her consent for participation in the study.
Study assessment
The PSQI questionnaire was used to survey the sleep quality of the previous month of the participants. The PSQI is a 19-item self-report questionnaire. These 19 items assess seven components: Sleep quality, sleep latency, sleep duration, habitual sleep efficiency, sleep disturbance, use of sleeping medication, and daytime dysfunction. Each component is rated on a 0-3 scale, where 0 and 3 indicate no difficulty and severe difficulty, respectively. The scores of seven component are then summed up to yield a total score which has a range of 0-21; higher scores indicate worse sleep quality [2].
Statistical analysis
The PSQI questionnaire has a normal distribution. Thus, the results from parametric tests were proper for the PSQI. The descriptive statistics were computed for the total sample and separately for the male and female participants and stratified by age and education levels. For the PSQI, we presented the results as the Mean±SD or No. (%).
For The Pittsburgh Sleep Quality Index (PSQI), the descriptive statistics were calculated for total and sub-scale scores. A PSQI total score >5 was used to define clinically significant abnormalities, as has been done in studies on young and middle-aged adults [2]. Pairwise comparisons were conducted with respect to the age groups (19-30, 31-50, and >51 years), educational level (under high school, high school, some college, college and graduate degree), and sex (male and female). The Independent samples t-test was used for quantitative sleep variables (PSQI total scores) and the Chi-square test was used for qualitative sleep variables (PSQI total score >5 vs. ≤5).
Validity
To assess the validity of the test content, the question-naire was sent to a panel of 9 academic members con-sisting of experts in the fields of psychology and health education. For each item, the Item Content Validity In-dex (I-CVI) was calculated as the number of experts giv-ing a ratgiv-ing of either 3 or 4, divided by the number of
experts. For the Scale Content Validity Index (S-CVI), the calculated I-CVI for each item and then the average I-CVI were calculated across all items.
As Polit and Beck noted, for a scale to have excel-lent content validity, it should have items with I-CVIs of 0.78 or higher and S-CVI/Ave of 0.90 or higher [16]. The internal consistency of the PSQI questionnaire was evaluated by the Cronbach alpha coefficient and item-scale correlation.
Reliability
To investigate the factor structure of the PSQI, the Exploratory Factor Analysis (EFA) was performed with a 2-factor solution and varimax rotation. Kaiser-Mayer-Olkin (KMO) value and Bartlett’s sphericity were report-ed, too. The correlations between each item and the total score of the specified factor were also calculated.
For the factorial analysis, the Kaiser-Meyer-Olkin (KMO) index and Bartlett-Test of Sphericity (BTS) were used as measures of adequacy of the sample size. Fac-tor analysis is done to test the null hypothesis of the identity matrix, to verify no cross-correlation among variables and that all off-diagonal correlations are zero. KMO values >0.50 and P values <0.05 in Bartlett’s test are considered adequate for the factorial analysis [17]. Principal components analysis was used to extract maxi-mum variance (total variance explained for each factor) for decreasing a large number of variables into a smaller number of components [18].
Confirmatory factor analysis
To test the model’s goodness of fit, we used model fit indexes, including the Chi-square test (χ2) with
signifi-cance greater than 0.05, Chi-square ratio (χ2/df) with
ac-ceptable values below 2.0, Goodness of Fit Index (GFI) with acceptable values equal to or greater than 0.85, GFI Adjusted Goodness of Fit Index (AGFI) with accept-able values equal to or greater than 0.80, Root Mean square Residual (RMR) with acceptable values equal to or lower than 0.10, Root Mean Square Error of Approxi-mation (RMSEA) with acceptable values equal to or low-er than 0.08, Bentllow-er Comparative Fit Index (CFI) with acceptable values equal to or greater than 0.90, and finally Bentler and Bonett Non-Normed Fit Index (NNFI) with acceptable values equal to or greater than 0.90.
estimate factor loads, we used the maximum likelihood method with a minimum of ten observations per item that represented univariate normality of items [20]. All analyses were done in SPSS version 16.0 (SPSS Institute, Chicago, Illinois) and AMOS for Windows. The signifi-cance level was set at 0.05.
3. Results
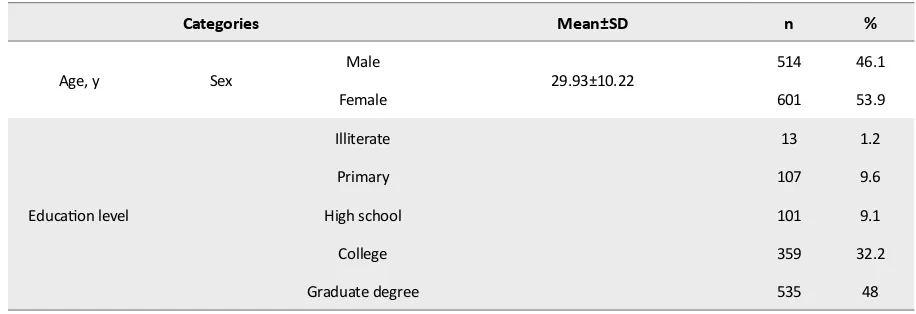
Of 1115 participants who completed the PSQI ques-tionnaires, 601 (54%) were females and 511 (46%) were males. Mean±SD age of the participants was 29.93±10.22 years (range: 18-60 y). Also, almost half (48%) of the participants passed a graduate degree. The demographic characteristics of participants are
present-ed in Table 1.
Descriptive statistics for PSQI
Table 2 presents the frequency distributions of the to-tal scores and subscales of the PSQI by age, education, and sex. The Mean±SD PSQI total score was 7.01±3.63, and 72.40% of the total sample had a PSQI total score >5, indicating a significant abnormality in sleep quality. The participants with less education level reported worse sleep quality and usually obtained a PSQI total score >5. There was a significant difference between sex and PSQI total score (P<0.001) or PSQI >5 (P<0.001), indicating that women had worse sleep quality and usually obtained a PSQI total score>5. Age was not significantly associated with PSQI total scores or PSQI total score >5 (Table 2).
Validity
The validity of the Persian version of PSQI was evalu-ated by its internal consistency and factor structure. The result showed excellent I-CVI (≥0.78) and S-CVI (≥0.90)
values. The Cronbach alpha coefficient was 0.65. In or-der to examine the validity of the PSQI, the exploratory factor analysis was determined by application of vari-max rotation and 2-factor solution. The result of KMO was 0.746, and the Bartlett’s sphericity was evaluated as significant at 0.05. These two tests showed efficiency for the factor analysis in terms of structure detection on our dataset.
Two factors were extracted by factor analysis that ex-plained 51.75% of the variance. Table 3 presents the fac-tor loadings of each of the seven PSQI components on these two identified factors. The first factor consists of sleep quality, sleep disturbances, sleep latency, daytime dysfunction and use of sleep medication; the Cronbach alpha was obtained as 0.65. The second factor consists of habitual sleep efficiency and sleep duration and the obtained Cronbach alpha was 0.57. The correlation coef-ficient between the first factor and the second factor was 0.31 (P<0.001).
Reliability
The reliability coefficient (the Cronbach alpha) of the PSQI questionnaire was determined as 0.65. The Pearson correlations between component scores and the PSQI total score are presented in Table 4. The cal-culations showed the largest correlation coefficient for habitual sleep efficiency (r=0.90, P<0.001), and the smallest correlation coefficient for the use of sleeping medication (r=0.55, P<0.001).
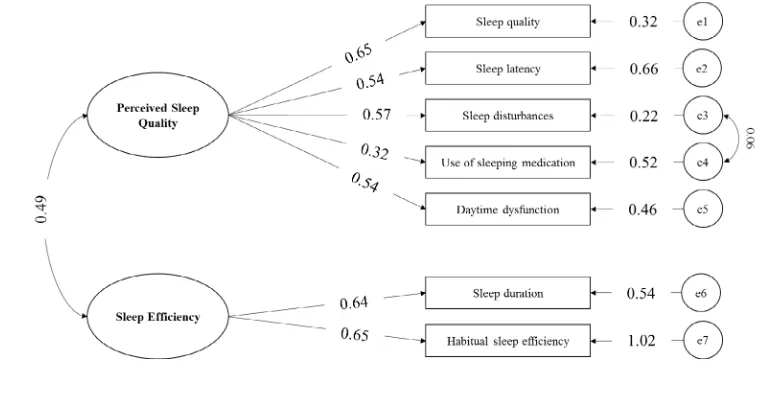
Confirmatory factor analysis
Figure 1 displays the path diagram, illustrating the fac-tor loads of the observed variables in the latent vari-ables (sleep quality, sleep latency, sleep duration,
habit-Table 1. The demographic characteristics of the study participants (n=1115)
Categories Mean±SD n %
Age, y Sex Male 29.93±10.22 514 46.1
Female 601 53.9
Education level
Illiterate 13 1.2
Primary 107 9.6
High school 101 9.1
College 359 32.2
ual sleep efficiency, sleep disturbance, use of sleeping medication and daytime dysfunction), as well as the factors loading, factors covariance, and items variances.
Overall, factor loadings showed good values, when they are larger than 0.40 in their factors. The symbol demonstrated by the mark “e” is named error. The over-all fitting results were χ2=27.906; χ2/df=2.326, P<0.006;
GFI=0.993; AGFI=0.984; RMR=0.020; RMSEA=0.034;
CFI=0.985; and NNFI=0.974. These results show the model’s satisfactory fitting based on adequacy criteria of GFI, AGFI, RMR, RMSEA, CFI, and NNFI. However χ2/df
was close to its acceptable values below 2.0.
4. Discussion
This study aimed to determine factor structure and inter-nal consistency of the Pittsburgh Sleep Quality Index (PSQI) Table 2. The descriptive statistics Mean±SD, or % for PSQI scores across demographic variables
Categories Total ScorePSQI Habitual Sleep Efficiency
Sleep
Latency DurationSleep
Sleep Distur -bances
Sleep Quality
Use of Sleeping Medication
Daytime Dysfunc
-tion
Global Score>5
%
Tot
al Score
(n=1115) 7.01±3.63 1.38±1.37 1.41±0.97 0.8±0.98 1.2±0.57 1.05±0.74 0.31±0.76 0.96±0.81 72.40
Ag
e gr
oup, y
18-30 6.99±3.55 1.47±1.38 1.42±0.95 0.72±0.93 1.18±0.55 1.05±0.75 0.27±0.69 0.99±0.81 72.70 31-50 6.91±3.7 1.17±1.32 1.37±0.99 0.91±1.02 1.3±0.57 1.04±0.71 0.34±0.83 0.89±0.79 71.10 >51 7.82±4.03 1.49±1.34 1.48±1.12 1.21±1.11 1.46±0.6 1.01±0.75 0.5±1.04 1.01±0.88 75
Educ
ation*
Illiterate 10.30±3.22 2.15±1.06 2±0.91 1.53±1.26 1.69±0.48 1.69±0.85 0.3±0.85 0.92±0.75 99 Primary
school 6.94±3.78 1.22±1.36 1.3±0.94 0.81±1.02 1.39±0.61 1.02±0.78 0.37±0.83 0.93±0.88 69.20 High
school 7.01±3.53 1.37±1.38 1.4±1.02 0.74±0.94 1.21±0.59 1±0.7 0.34±0.78 0.9±0.79 74.40 College 6.98±3.49 1.45±1.36 1.4±0.96 0.76±0.98 1.26±0.56 1.04±0.68 0.34±0.81 0.95±0.77 74.30 Graduate
degree 6.89±3.67 1.35±1.38 1.3±0.97 0.81±0.96 1.16±0.55 1.05±0.77 0.26±0.69 0.99±0.82 70.70
Se
x** Female 7.73±3.84 1.54±1.35 1.61±0.98 0.92±1.04 1.31±0.59 1.09±0.75 0.34±0.82 1.05±0.85 77.20
Male 6.17±3.15 1.19±1.37 1.17±0.91 0.65±0.88 1.14±0.52 1±0.73 0.25±0.67 0.87±0.74 66.70 PSQI: Pittsburgh Sleep Quality Index; Higher scores indicate worse sleep quality (total PSQI scores range from 0-21).
No significant differences between age categories (P=0.39) for PSQI total score or for age categories (P=0.17) for PSQI>5.
* Significant differences between education categories for PSQI total score (P=0.021) or PSQI >5 (P=0.01); ** Significant differences be-tween sex for PSQI total score (P<0.001) or PSQI >5 (P<0.001).
Table 3. Seven-factor loadings of PSQI obtained from varimax rotation
Factor Components Factor Loadings
Perceived Sleep Quality
Sleep disturbances 0.760
Sleep quality 0.659 Daytime dysfunction 0.617 Use of sleeping medication 0.614 Sleep latency 0.550
in Iranian people, in particular 1112 citizens in Arak City, Iran. Although the PSQI is frequently used in clinical and non-clinical research, its reliability and validity have not yet been determined in prior studies in this population.
Results of this study reveals the PSQI (Persian version) internal consistency as 0.65 that is consistent with the results of Mariman [13]. However, in Nazifi study, the internal consistency was determined as 0.55 in employ-ees of Kerman hospitals [21]. KMO and Bartlett’s test indicated that factor analysis was a good idea for our dataset. Factor analysis extracted two factors: perceived sleep quality and sleep efficiency. These two compo-nents of the PSQI were correlated and each had a sepa-rate and unique concept. The first component loaded on the perceived sleep quality and the second one on
sleep efficiency. In Otte study, the first component was loaded on sleep efficiency [15].
The first and the second factors explained 29.88% and 21.87% of the variance, respectively. The results of this study were inconsistent with those of some other stud-ies. Most other studies confirmed that the 3-factor PSQI model had acceptable performance and fit to the data
[10-13, 21]. However, the extracted factors were differ-ent in these studies. The results reported in Otte study show that a 2-factor model was the best fit to data.
This conclusion could be attributed to cultural differ-ences related to the quality of sleep differdiffer-ences among the various studies. However, the result of this study was similar to that of Otte in terms of the number of ex-Table 4. Component-total correlations
Component Total Score P
Habitual sleep efficiency 0.90 <0.001
Sleep latency 0.70 <0.001
Sleep duration 0.78 <0.001
Sleep disturbances 0.66 <0.001
Sleep quality 0.69 <0.001
Use of sleeping medication 0.55 <0.001 Daytime dysfunction 0.66 <0.001
tracted factors and their components [15]. In summary, factor analysis confirmed that the Persian version of the PSQI with 2-factor model had legitimate validity and re-liability in relation to Iranian people, at least the citizens in Arak City. These results also call for further validation in other populations.
5. Conclusion
The Persian version of the PSQI demonstrated satis-factory validity and reliability for our study sample. It was concluded that the PSQI is a useful instrument to measure the quality and patterns of sleep in citizens of Arak. Using a large sample and spotting more criteria in the validity and reliability of PSQI were the strong points of this study. However, some limitations of this study were first of all its research design which was cross-sectional. Only a 2-factor solution was applied to estimations.
The coefficients in the path diagram were not adjusted for covariates such as age, sex, and education level. Arak population have three major ethnics, Fars, Lor, and Kord, thus the ethnic issue could be fit into the demographic sec-tion. In future studies, we suggest investigating the PSQI in other cities, with more information in the demographic section and adjusted coefficients for these covariates. We suggest to use PSQI in a case-control or a cohort study that cases are Iranian participants with any special psy-chosis. Also, by using similar statistical models to estimate coefficients (e.g. multiple linear regression, logistic regres-sion), we can investigate the effect of covariates in the total score of PSQI.
Ethical Considerations
Compliance with ethical guidelines
This study was approved by the Ethics Committee of Arak University of Medical Sciences and each sample ex-pressed his or her consent for participation in the study.
Funding
This work was supported by Arak University of Medical Sciences (Grant No.: 918).
Authors contributions
Conceptualization: Mohammad Gholi Mezerji, Parisa Naseri, Zahra Shayan; Methodology: All authors; Inves-tigation: All authors; Writing-original draft: All authors; Writing-review & editing: All authors; Funding
acquisi-tion: All authors; Resources: All authors; and Supervi-sion: Parisa Naseri, Zahra Shayan.
Conflict of interest
The authors declared no conflict of interest.
Acknowledgements
The authors would like to thank Dr. Nasrin Shokrpour in Center for Development of Clinical Research of Namazi Hospital for her editorial assistance.
References
[1] Altevogt BM, Colten HR. Sleep disorders and sleep deprivation: An unmet public health problem. Washington, DC.: National Acad-emies Press; 2006.
[2] Buysse DJ, Reynolds III CF, Monk TH, Berman SR, Kupfer DJ. The Pittsburgh sleep quality index: A new instrument for psychiatric practice and research. Psychiatry Research. 1989; 28(2):193-213.
[DOI:10.1016/0165-1781(89)90047-4]
[3] Grandner MA, Kripke DF, Yoon IY, Youngstedt SD. Criterion valid-ity of the Pittsburgh sleep qualvalid-ity index: Investigation in a non-clinical sample. Sleep and Biological Rhythms. 2006; 4(2):129-36.
[DOI:10.1111/j.1479-8425.2006.00207.x] [PMID] [PMCID]
[4] Monazzam MR, Hosseini M, Matin LF, Aghaei HA, Khosroabadi H, He-sami A. Sleep quality and general health status of employees exposed to extremely low frequency magnetic fields in a petrochemical com-plex. Journal of Environmental Health Science and Engineering. 2014; 12(1):78. [DOI:10.1186/2052-336X-12-78] [PMID] [PMCID]
[5] Adib Hajbaghery M, Izadi Avanji F, Akbari H. Quality of sleep and its related risk factors in hospitalized older patients in Kashan’s hospi-tals, Iran 2009. Iranian Journal of Nursing and Midwifery Research. 2012; 17(6):414-20. [PMID] [PMCID]
[6] Ait Aoudia M, Levy PP, Bui E, Insana S, De Fouchier C, Germain A, et al. Validation of the French version of the Pittsburgh sleep quality index addendum for post traumatic stress disorder. European Jour-nal of Psychotraumatology. 2013; 4(1):19298. [DOI:10.3402/ejpt. v4i0.19298] [PMID] [PMCID]
[7] Doi Y, Minowa M, Uchiyama M, Okawa M, Kim K, Shibui K, et al. Psychometric assessment of subjective sleep quality using the Japa-nese version of the Pittsburgh Sleep Quality Index (PSQI-J) in psy-chiatric disordered and control subjects. Psychiatry Research. 2000; 97(2-3):165-72. [DOI:10.1016/S0165-1781(00)00232-8]
[8] Knutson KL, Rathouz PJ, Yan LL, Liu K, Lauderdale DS. Stability of the Pittsburgh sleep quality index and the Epworth sleepiness question-naires over 1 year in early middle-aged adults: The CARDIA study. Sleep. 2006; 29(11):1503-6. [DOI:10.1093/sleep/29.11.1503] [PMID]
[9] Kotronoulas GC, Papadopoulou CN, Papapetrou A, Patiraki E. Psychometric evaluation and feasibility of the Greek Pittsburgh Sleep Quality Index (GR-PSQI) in patients with cancer receiving chemotherapy. Supportive Care in Cancer. 2011; 19(11):1831-40.
[10] Cole JC, Motivala SJ, Buysse DJ, Oxman MN, Levin MJ, Irwin MR. Validation of a 3-factor scoring model for the Pittsburgh sleep qual-ity index in older adults. Sleep. 2006; 29(1):112-6. [DOI:10.1093/ sleep/29.1.112] [PMID]
[11] Aloba OO, Adewuya AO, Ola BA, Mapayi BM. Validity of the Pittsburgh Sleep Quality Index (PSQI) among Nigerian univer-sity students. Sleep Medicine. 2007; 8(3):266-70. [DOI:10.1016/j. sleep.2006.08.003] [PMID]
[12] Burkhalter H, Sereika SM, Engberg S, Wirz Justice A, Steiger J, De Geest S. Structure validity of the Pittsburgh sleep quality index in renal transplant recipients: A confirmatory factor analysis. Sleep and Biological Rhythms. 2010; 8(4):274-81. [DOI:10.1111/j.1479-8425.2010.00473.x]
[13] Mariman A, Vogelaers D, Hanoulle I, Delesie L, Tobback E, Pe-vernagie D. Validation of the three-factor model of the PSQI in a large sample of Chronic Fatigue Syndrome (CFS) patients. Journal of Psychosomatic Research. 2012; 72(2):111-3. [DOI:10.1016/j.jpsy-chores.2011.11.004] [PMID]
[14] Tomfohr LM, Schweizer CA, Dimsdale JE, Loredo JS. Psychometric characteristics of the Pittsburgh sleep quality index in English speak-ing non-hispanic whites and English and Spanish speakspeak-ing Hispan-ics of Mexican descent. Journal of Clinical Sleep Medicine. 2013; 9(1):61-6. [DOI:10.5664/jcsm.2342]
[15] Otte JL, Rand KL, Carpenter JS, Russell KM, Champion VL. Factor analysis of the Pittsburgh sleep quality index in breast cancer survi-vors. Journal of Pain and Symptom Management. 2013; 45(3):620-7. [DOI:10.1016/j.jpainsymman.2012.03.008] [PMID] [PMCID]
[16] Polit DF, Beck CT. The content validity index: Are you sure you know what’s being reported? Critique and recommendations. Research in Nursing & Health. 2006; 29(5):489-97. [DOI:10.1002/ nur.20147] [PMID]
[17] Costa ALS, Silva RMD, Mussi FC, Serrano PM, Graziano EDS, Ba-tista KDM. Short version of the “instrument for assessment of stress in nursing students” in the Brazilian reality. Revista Latino-Americana De Enfermagem. 2017; 25:e2976. [DOI:10.1590/1518-8345.2071.2976]
[18] Yong AG, Pearce S. A beginner’s guide to factor analysis: Focusing on exploratory factor analysis. Tutorials in Quantitative Methods for Psychology. 2013; 9(2):79-94. [DOI:10.20982/tqmp.09.2.p079]
[19] Kline P. An easy guide to factor analysis. Abingdon: Routledge; 2014. [DOI:10.4324/9781315788135]
[20] Hair JF, Black WC, Babin BJ, Anderson RE, Tatham RL. [Análise multivariada de dados (Portuguese)]. Porto Alegre: Bookman edi-tora; 2009.